. 2019 Jun;18(6):1054-1069.
doi: 10.1074/mcp.RA119.001380. Epub 2019 Mar 8.

Quantification of Dynamic Protein Interactions and Phosphorylation in LPS Signaling Pathway by SWATH-MS

Affiliations

Quantification of Dynamic Protein Interactions and Phosphorylation in LPS Signaling Pathway by SWATH-MS

Xiurong Wu et al. Mol Cell Proteomics. 2019 Jun.

Abstract

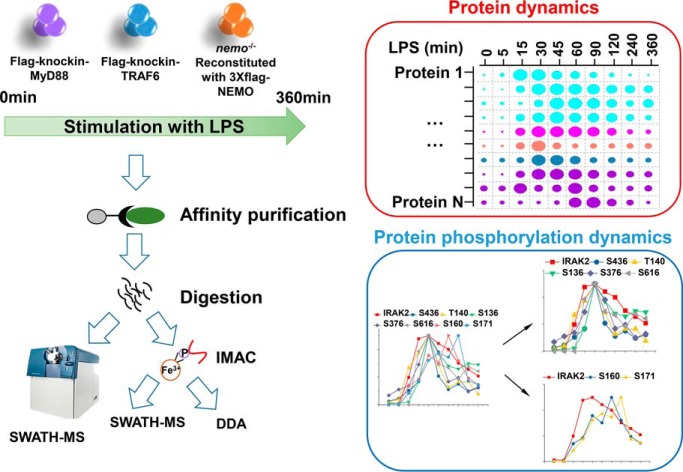
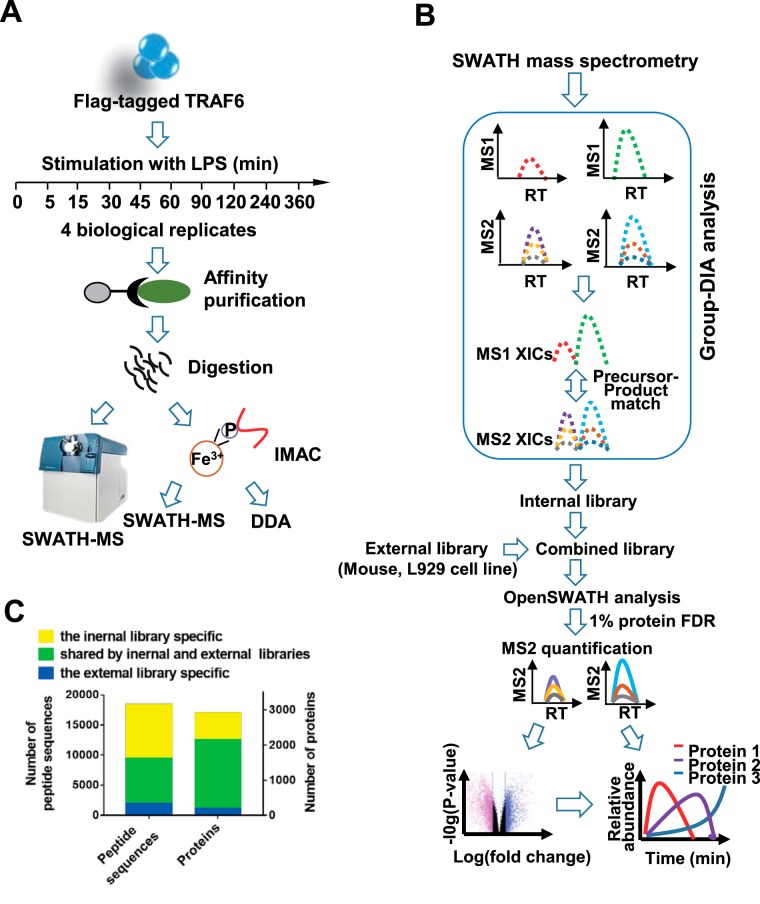
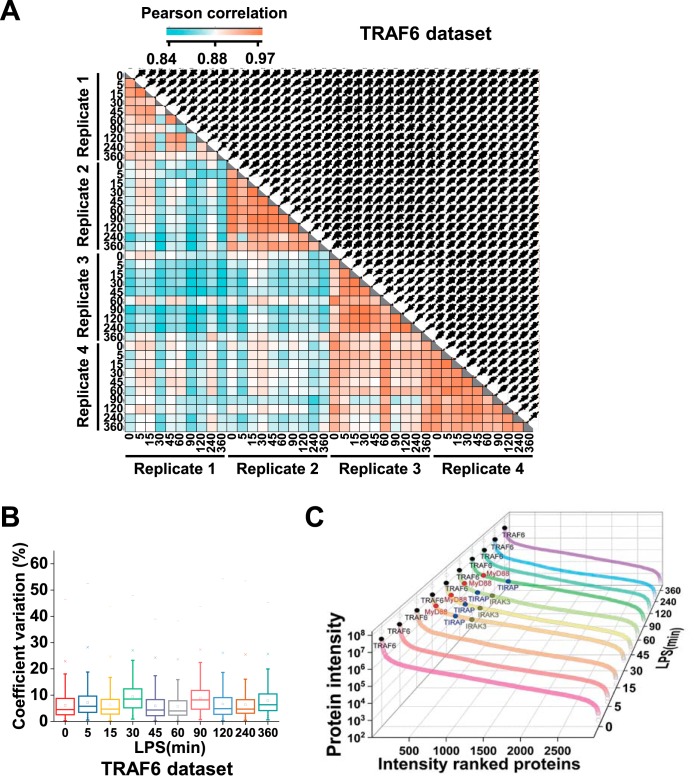
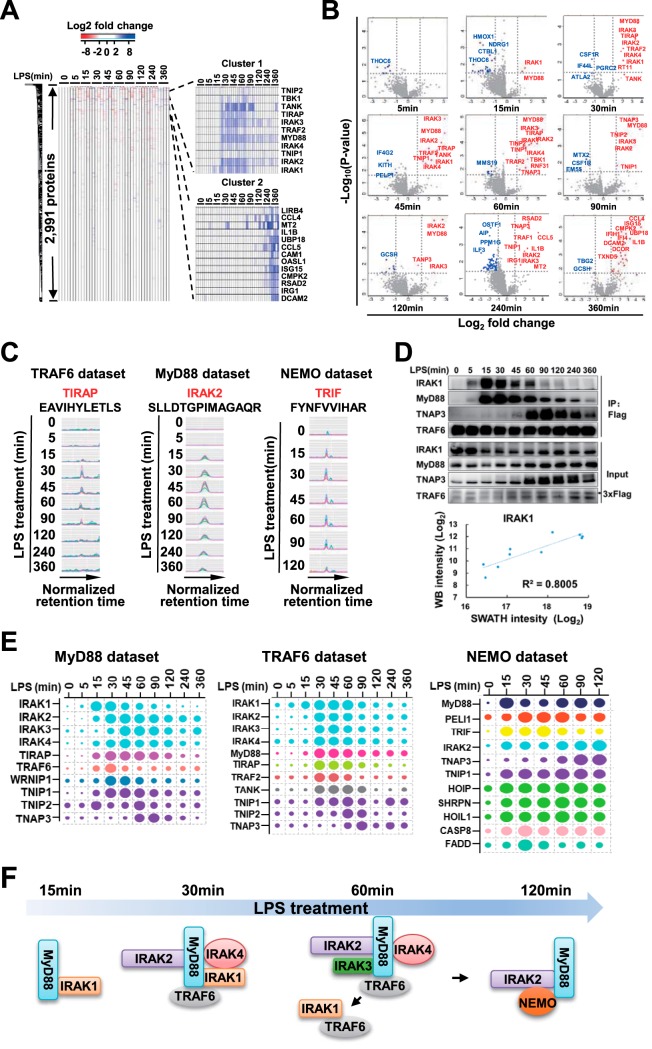
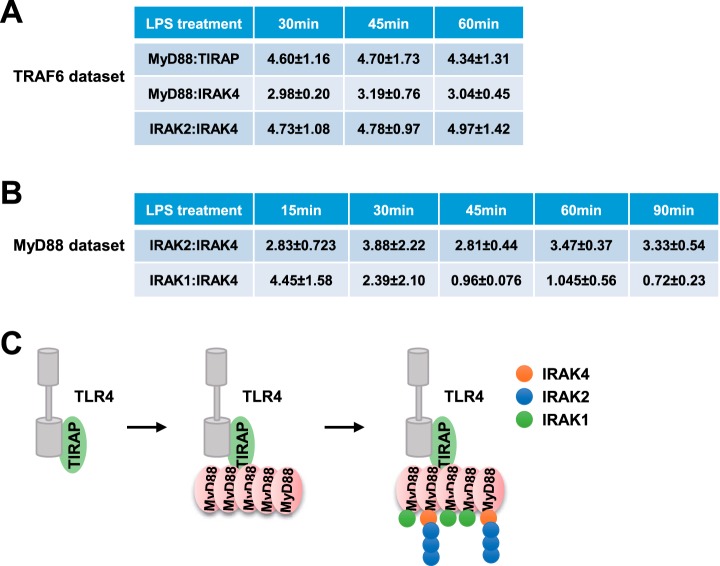
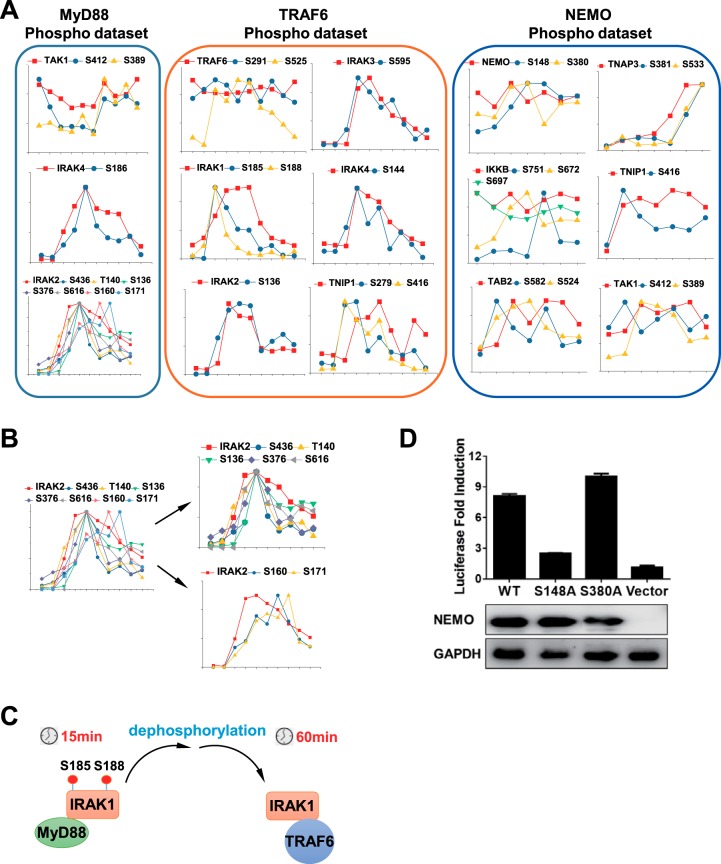
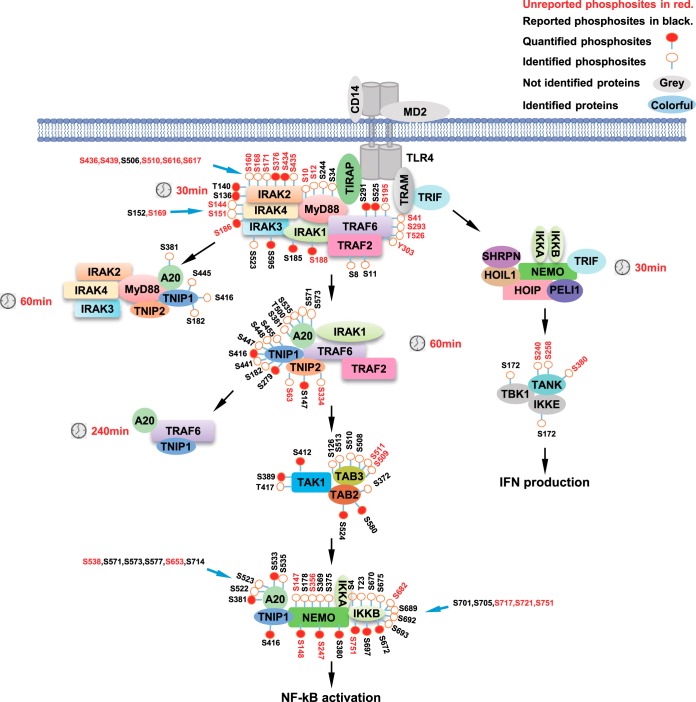
Lipopolysaccharide (LPS)-induced macrophage activation is a prototype of innate immune response. Although key effector proteins in LPS signaling pathway have been revealed, the map of dynamic protein interactions and phosphorylation as well as the stoichiometry of protein complexes are lacking. Here we present a dynamic map of protein interactions and phosphorylation in MyD88, TRAF6 and NEMO complexes obtained by SWATH-MS. The comprehensive MS measurement leads to quantification of up to about 3,000 proteins across about 21-40 IP samples. We detected and quantified almost all known interactors of MyD88, TRAF6 and NEMO. By analyzing these quantitative data, we uncovered differential recruitment of IRAK family proteins to LPS-induced signaling complexes and determined the stoichiometry of the Myddosome complex. In addition, quantitative phosphoproteomics analysis identified a number of unreported high-confidence phosphosites on the key proteins in LPS signaling pathway. Collectively, data of dynamic protein interactions and phosphorylation presented by this study could be a resource for further study of the LPS signaling pathway.

Keywords: Immunoaffinity; Immunology*; Phosphoproteome; Quantification; SWATH-MS.


Figures

None
Graphical abstract
Fig. 1.
Fig. 1.
The AP-SWATH workflow. A, The TRAF6 complexes were immunoprecipitated from RAW 264.7 cells treated with (100 ng/ml) LPS for indicated time-points, followed by digestion and IMAC enrichment. Tryptic peptides were analyzed by SWATH-MS, and phosphopeptides were analyzed by SWATH-MS and shotgun MS based DDA (data-dependent acquisition). B, Data processing procedures for SWATH-MS data. Group-DIA (data-independent acquisition) was used to construct pseudo-spectra from SWATH-MS data, and an internal library was made by these pseudo-spectra. The internal library and a premade external library of murine cell line were used either independently or in combination (combined library) in OpenSWATH analysis of SWATH-MS data. The final results were filtered at 1% global protein level. C, Comparison of the numbers of peptides and proteins detected in TRAF6 complexes (TRAF6 data set) by using internal, external or combined library.
Fig. 2.
Fig. 2.
Quality of the quantitative data of TRAF6 data set. A, Correlation analysis of protein intensities between any two samples. The matrix of correlation plots is shown, and the colors represent the indicated correlation coefficients. B, Quantitative reproducibility of protein intensities in biological quadruplicates. The coefficient of variation (CV), which is calculated by dividing the standard deviation of protein profiles by the mean, is reported as percentages. C, Dynamic range of all identified proteins in TRAF6 data set. The log10 abundances of proteins calculated using “TOP 3” approach in ten time-points are shown. Some interactors as well as the bait protein are highlighted.
Fig. 3.
Fig. 3.
Identification of high-confidence interactors of TRAF6, MyD88 and NEMO. A, Heatmap of protein-abundance change after LPS treatment relative to untreated sample is shown on the left. Hierarchical clusters are shown on the right. B, Differential expression analysis in TRAF6 data set. Proteins with Log2(fold change) >1 and -Log10(p value) >1.5 were considered significantly changed. Upregulated proteins were labeled in red, and downregulated proteins were labeled in blue. C, MS2 XICs of representative peptides of a representative high-confidence interactor of TRAF6, MyD88, and NEMO. Traces in different colors mean different product ions of given peptides. D, Comparison of band intensities in Western blotting and protein intensities in TRAF6 IP SWATH-MS. The panel above shows IRAK1, MyD88, TNAP3, and TRAF6 detected by Western blotting in TRAF6 IP samples, and the panel below shows the comparison of IRAK1 band intensities in Western blotting and IRAK1 protein intensities in SWATH-MS. The coefficient of correlation is shown. E, Relative levels of interactors without induced protein expression by LPS in MyD88, TRAF6, and NEMO data set. The size of each dot is proportional to the relative abundance of the indicated protein. In each data set, proteins labeled in the same color mean one subcomplex they belong to. F, Assembling and de-assembling of IRAK family proteins into LPS signaling complexes, a model deduced from MyD88, TRAF6, and NEMO data sets.
Fig. 4.
Fig. 4.
The stoichiometry of MyD88 and TRAF6 complexes. A, The ratios of MyD88:TIRAP, MyD88:IRAK4, and IRAK2:IRAK4 in TRAF6 data set. The values are represented with the median value ± standard errors in biological quadruplicates. B, The ratio of IRAK2:IRAK4 and IRAK1:IRAK4 in MyD88 data set. The values are represented with the median value ± standard errors in biological triplicates. C, The proposed model for Myddosome assembly.
Fig. 5.
Fig. 5.
Identification of phosphosites on high-confidence interactors in MyD88, TRAF6 and NEMO phospho-data set. A, Dynamic profiles of proteins and their phosphosites in MyD88, TRAF6, and NEMO phospho-data set. B, Dynamic profiles of seven phosphosites on IRAK2 in MyD88 phospho-data set. C, Model of dephosphorylation of S185 and S188 on IRAK1 in TRAF6 complex derived from A. D, The ability of NEMO and its mutants in inducing NF-κB activation. The NF-κB firefly luciferase reporter plasmid and renilla luciferase transfection control plasmid were co-transfected into 293T cells along with the plasmid encoding wildtype NEMO, S148A NEMO, or S380A NEMO. Luciferase activities were measured 24 h post transfection. Values represent the fold of luciferase activity induction relative to cells transfected with empty vector.
Fig. 6.
Fig. 6.
Summary of all identified phosphosites in LPS signaling pathway.

References

    1. Lu Y. C., Yeh W. C., and Ohashi P. S. (2008) LPS/TLR4 signal transduction pathway. Cytokine 42, 145–151 - PubMed
    1. Lord K. A., Hoffman-Liebermann B., and Liebermann D. A. (1990) Nucleotide sequence and expression of a cDNA encoding MyD88, a novel myeloid differentiation primary response gene induced by IL6. Oncogene 5, 1095–1097 - PubMed
    1. Yamamoto M., Sato S., Hemmi H., Hoshino K., Kaisho T., Sanjo H., Takeuchi O., Sugiyama M., Okabe M., Takeda K., and Akira S. (2003) Role of adaptor TRIF in the MyD88-independent toll-like receptor signaling pathway. Science 301, 640–643 - PubMed
    1. Horng T., Barton G. M., and Medzhitov R. (2001) TIRAP: an adapter molecule in the Toll signaling pathway. Nat. Immunol. 2, 835–841 - PubMed
    1. Fitzgerald K. A., Palsson-McDermott E. M., Bowie A. G., Jefferies C. A., Mansell A. S., Brady G., Brint E., Dunne A., Gray P., Harte M. T., McMurray D., Smith D. E., Sims J. E., Bird T. A., and O'Neill L. A. (2001) Mal (MyD88-adapter-like) is required for Toll-like receptor-4 signal transduction. Nature 413, 78–83 - PubMed

Publication types

Substances