

Evolution of Cold Acclimation and Its Role in Niche Transition in the Temperate Grass Subfamily Pooideae
- PMID: 30850470
- PMCID: PMC6501083
- DOI: 10.1104/pp.18.01448
Evolution of Cold Acclimation and Its Role in Niche Transition in the Temperate Grass Subfamily Pooideae
Abstract
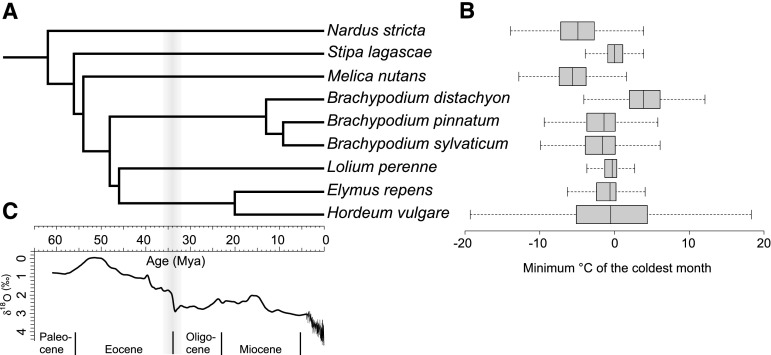
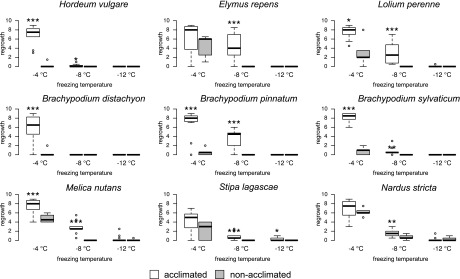
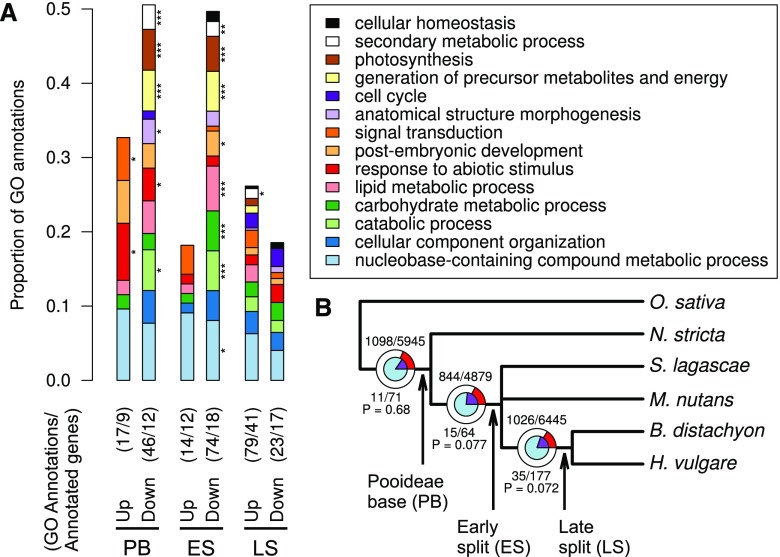
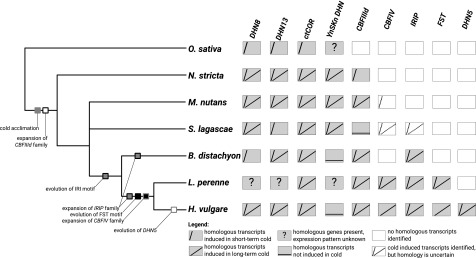
The grass subfamily Pooideae dominates the grass floras in cold temperate regions and has evolved complex physiological adaptations to cope with extreme environmental conditions like frost, winter, and seasonality. One such adaptation is cold acclimation, wherein plants increase their frost tolerance in response to gradually falling temperatures and shorter days in the autumn. However, understanding how complex traits like cold acclimation evolve remains a major challenge in evolutionary biology. Here, we investigated the evolution of cold acclimation in Pooideae and found that a phylogenetically diverse set of Pooideae species displayed cold acclimation capacity. However, comparing differential gene expression after cold treatment in transcriptomes of five phylogenetically diverse species revealed widespread species-specific responses of genes with conserved sequences. Furthermore, we studied the correlation between gene family size and number of cold-responsive genes as well as between selection pressure on coding sequences of genes and their cold responsiveness. We saw evidence of protein-coding and regulatory sequence evolution as well as the origin of novel genes and functions contributing toward evolution of a cold response in Pooideae. Our results reflect that selection pressure resulting from global cooling must have acted on already diverged lineages. Nevertheless, conservation of cold-induced gene expression of certain genes indicates that the Pooideae ancestor may have possessed some molecular machinery to mitigate cold stress. Evolution of adaptations to seasonally cold climates is regarded as particularly difficult. How Pooideae evolved to transition from tropical to temperate biomes sheds light on how complex traits evolve in the light of climate changes.
© 2019 American Society of Plant Biologists. All Rights Reserved.
Figures
Comment in
-
Diverse Strategies Coping with Winter in Barley and its Relatives.Plant Physiol. 2019 May;180(1):5-6. doi: 10.1104/pp.19.00333. Plant Physiol. 2019. PMID: 31053671 Free PMC article. No abstract available.
Similar articles
-
Successive evolutionary steps drove Pooideae grasses from tropical to temperate regions.New Phytol. 2018 Jan;217(2):925-938. doi: 10.1111/nph.14868. Epub 2017 Nov 1. New Phytol. 2018. PMID: 29091285
-
Did gene family expansions during the Eocene-Oligocene boundary climate cooling play a role in Pooideae adaptation to cool climates?Mol Ecol. 2010 May;19(10):2075-88. doi: 10.1111/j.1365-294X.2010.04629.x. Epub 2010 Apr 16. Mol Ecol. 2010. PMID: 20406386
-
Evidence for adaptive evolution of low-temperature stress response genes in a Pooideae grass ancestor.New Phytol. 2013 Sep;199(4):1060-1068. doi: 10.1111/nph.12337. Epub 2013 May 23. New Phytol. 2013. PMID: 23701123 Free PMC article.
-
Gene Regulatory Networks Mediating Cold Acclimation: The CBF Pathway.Adv Exp Med Biol. 2018;1081:3-22. doi: 10.1007/978-981-13-1244-1_1. Adv Exp Med Biol. 2018. PMID: 30288701 Review.
-
Molecular mechanisms underlying frost tolerance in perennial grasses adapted to cold climates.Plant Sci. 2011 Jan;180(1):69-77. doi: 10.1016/j.plantsci.2010.07.011. Epub 2010 Jul 27. Plant Sci. 2011. PMID: 21421349 Review.
Cited by
-
Melica as an emerging model system for comparative studies in temperate Pooideae grasses.Ann Bot. 2023 Dec 30;132(7):1175-1190. doi: 10.1093/aob/mcad136. Ann Bot. 2023. PMID: 37696761 Free PMC article.
-
The Application of Auxin-like Compounds Promotes Cold Acclimation in the Oilseed Rape Plant.Life (Basel). 2022 Aug 22;12(8):1283. doi: 10.3390/life12081283. Life (Basel). 2022. PMID: 36013462 Free PMC article.
-
Diverse Strategies Coping with Winter in Barley and its Relatives.Plant Physiol. 2019 May;180(1):5-6. doi: 10.1104/pp.19.00333. Plant Physiol. 2019. PMID: 31053671 Free PMC article. No abstract available.
-
Integrative Comparative Assessment of Cold Acclimation in Evergreen and Deciduous Iris Species.Antioxidants (Basel). 2022 May 16;11(5):977. doi: 10.3390/antiox11050977. Antioxidants (Basel). 2022. PMID: 35624841 Free PMC article.
-
Inferring the Evolutionary Model of Community-Structuring Traits with Convolutional Kitchen Sinks.Syst Biol. 2024 Sep 5;73(3):546-561. doi: 10.1093/sysbio/syae026. Syst Biol. 2024. PMID: 38767123 Free PMC article.
References
-
- Aguan K, Sugawara K, Suzuki N, Kusano T (1991) Isolation of genes for low-temperature-induced proteins in rice by a simple subtractive method. Plant Cell Physiol 32: 1285–1289
-
- Alexa A, Rahnenfuhrer J (2018) topGO: Enrichment analysis for gene ontology. R package version 2.32.0. https://rdrr.io/bioc/topGO/.
-
- Alm V, Busso CS, Ergon A, Rudi H, Larsen A, Humphreys MW, Rognli OA (2011) QTL analyses and comparative genetic mapping of frost tolerance, winter survival and drought tolerance in meadow fescue (Festuca pratensis Huds.). Theor Appl Genet 123: 369–382 - PubMed
-
- Andrés F, Coupland G (2012) The genetic basis of flowering responses to seasonal cues. Nat Rev Genet 13: 627–639 - PubMed
-
- Antikainen M, Griffith M (1997) Antifreeze protein accumulation in freezing-tolerant cereals. Physiol Plant 99: 423–432
Publication types
MeSH terms
Substances
LinkOut - more resources
Full Text Sources
