. 2019 Mar 26;116(13):6319-6328.
doi: 10.1073/pnas.1900983116. Epub 2019 Mar 8.

Lipoprotein lipase is active as a monomer

Affiliations

Lipoprotein lipase is active as a monomer

Anne P Beigneux et al. Proc Natl Acad Sci U S A. .

Abstract

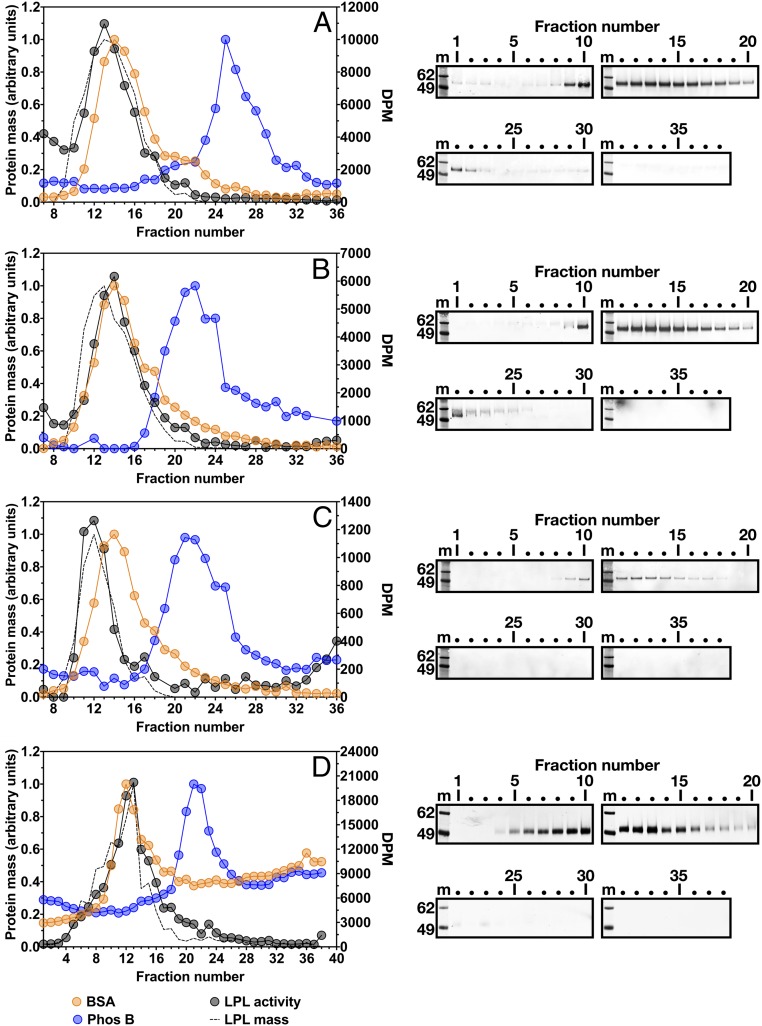
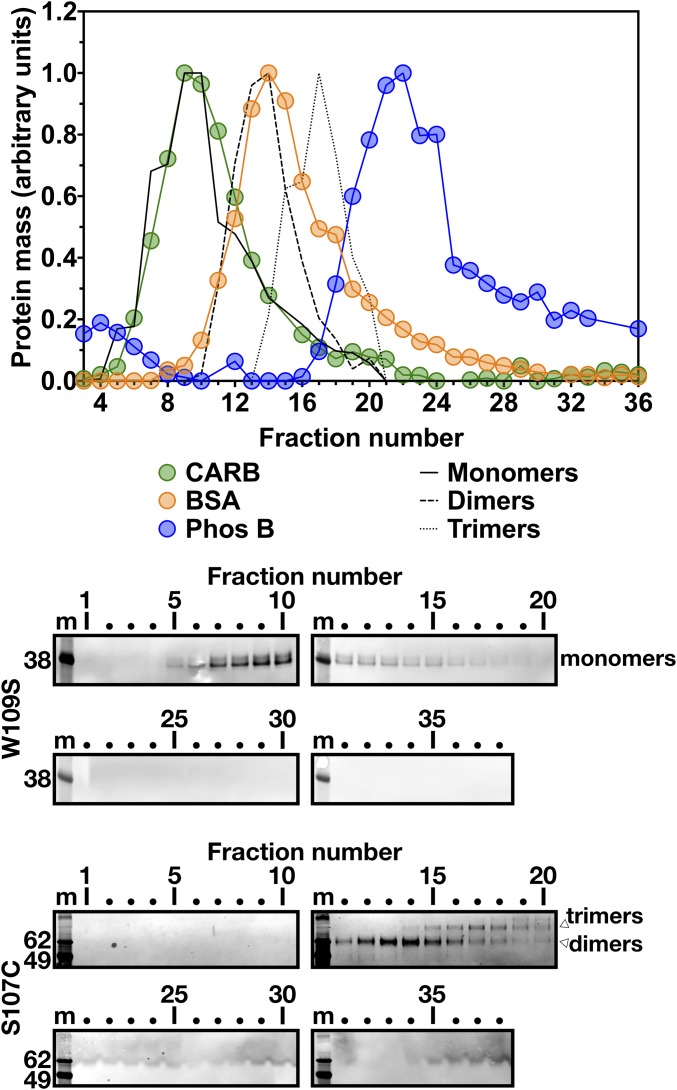
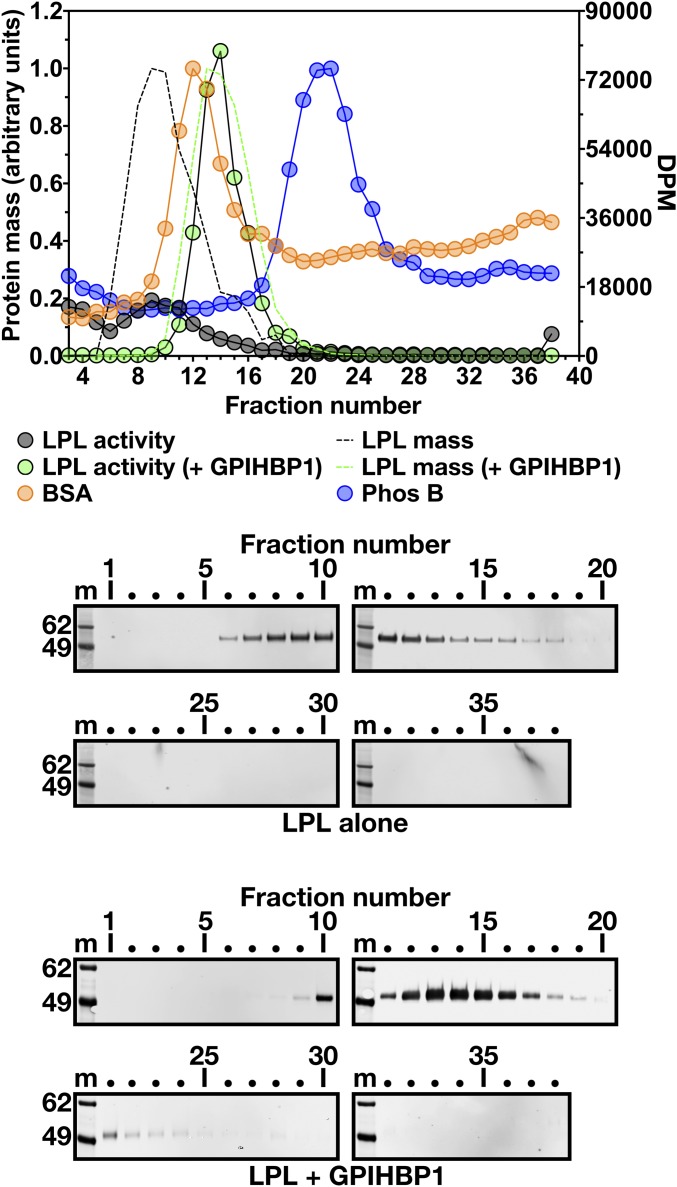
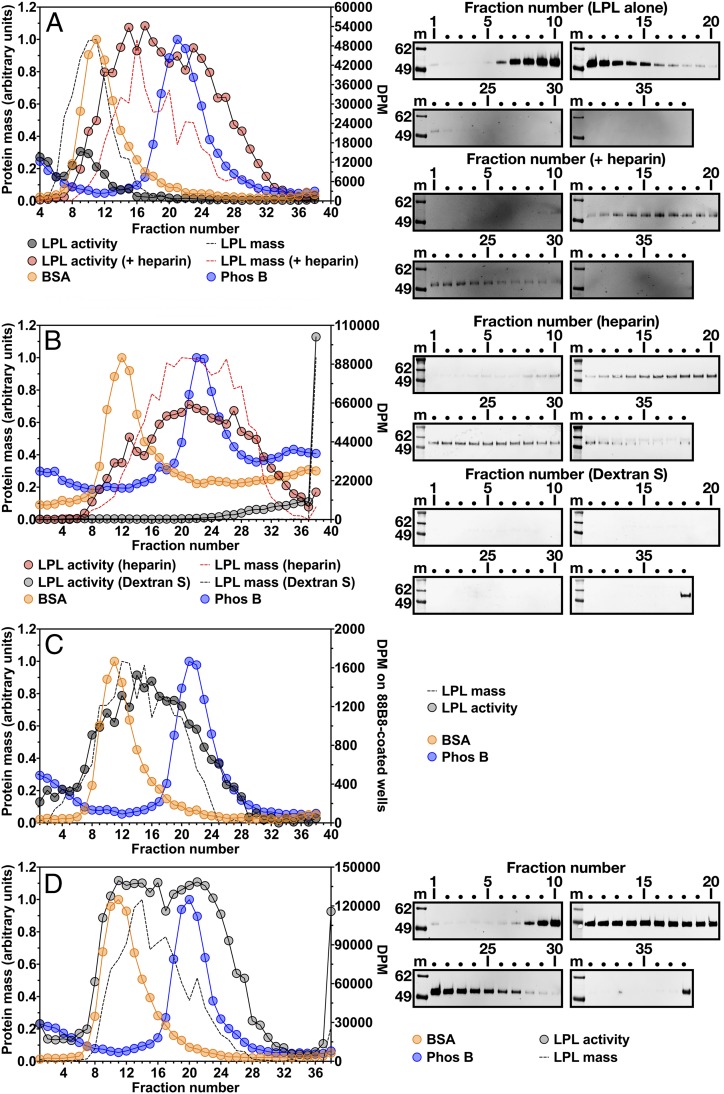
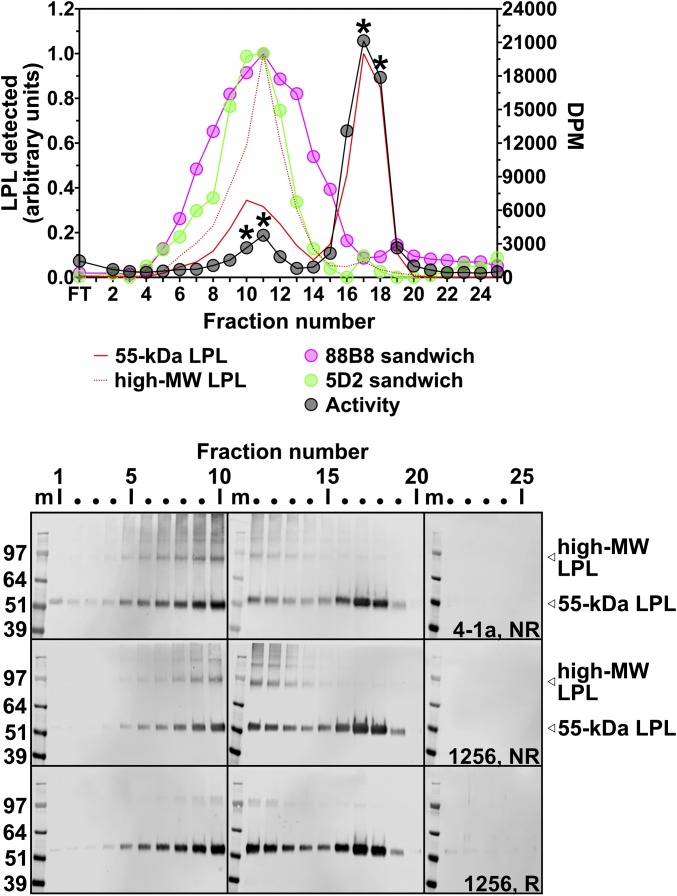
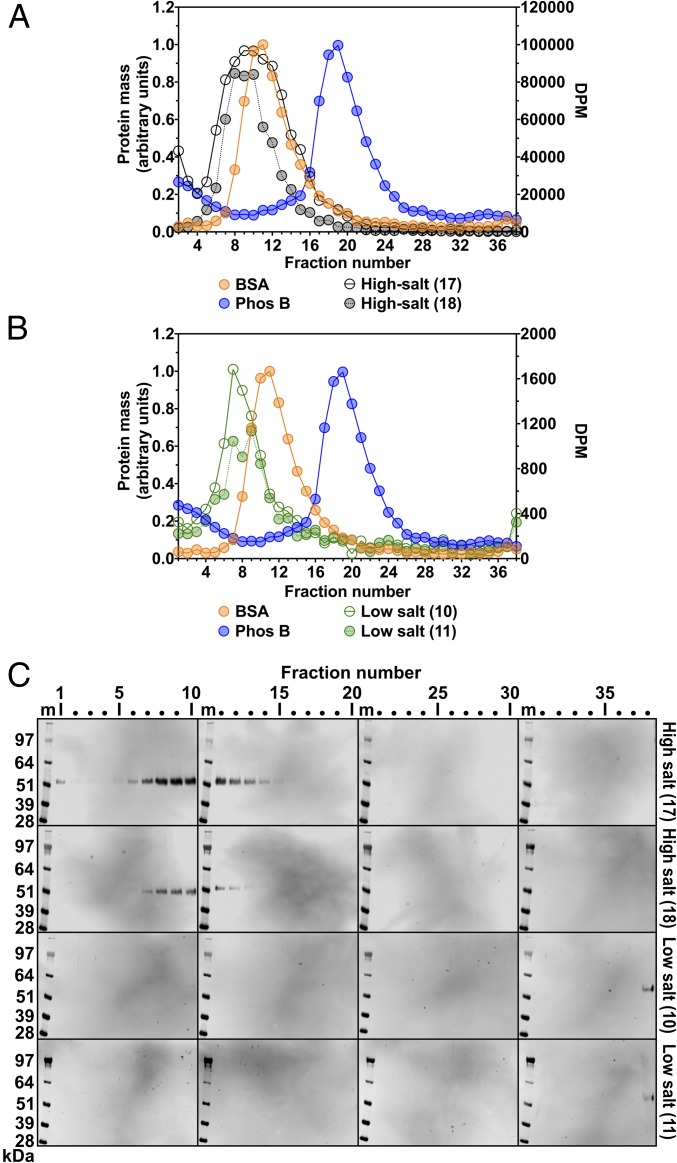
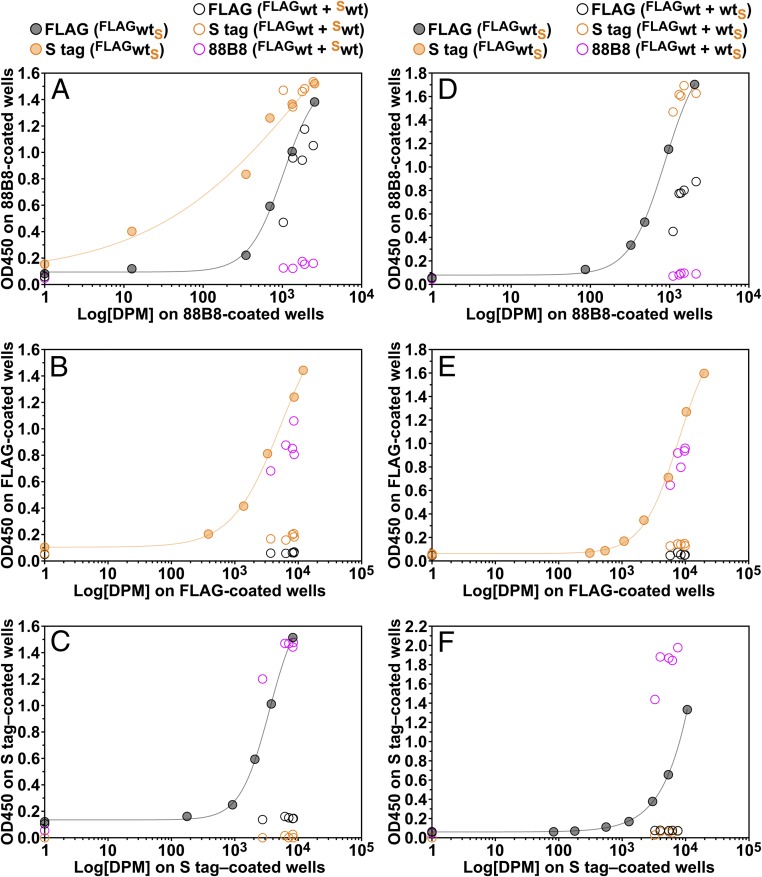
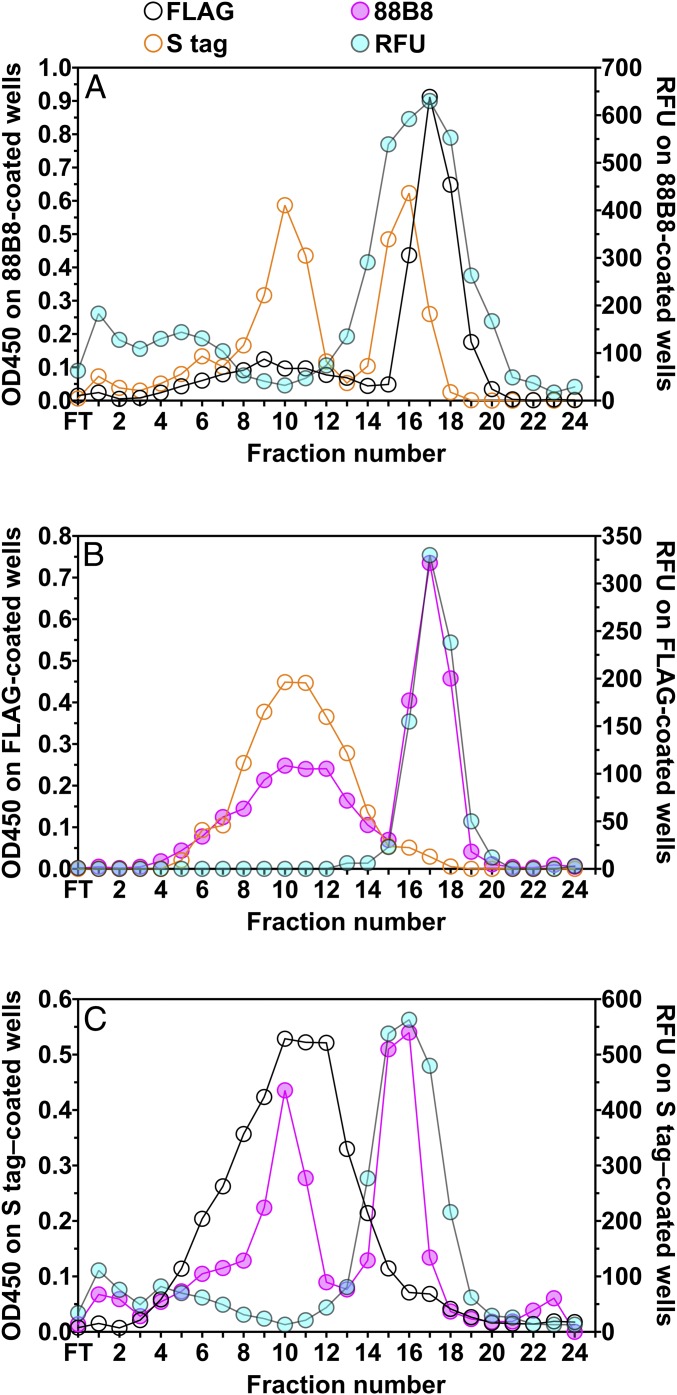
Lipoprotein lipase (LPL), the enzyme that hydrolyzes triglycerides in plasma lipoproteins, is assumed to be active only as a homodimer. In support of this idea, several groups have reported that the size of LPL, as measured by density gradient ultracentrifugation, is ∼110 kDa, twice the size of LPL monomers (∼55 kDa). Of note, however, in those studies the LPL had been incubated with heparin, a polyanionic substance that binds and stabilizes LPL. Here we revisited the assumption that LPL is active only as a homodimer. When freshly secreted human LPL (or purified preparations of LPL) was subjected to density gradient ultracentrifugation (in the absence of heparin), LPL mass and activity peaks exhibited the size expected of monomers (near the 66-kDa albumin standard). GPIHBP1-bound LPL also exhibited the size expected for a monomer. In the presence of heparin, LPL size increased, overlapping with a 97.2-kDa standard. We also used density gradient ultracentrifugation to characterize the LPL within the high-salt and low-salt peaks from a heparin-Sepharose column. The catalytically active LPL within the high-salt peak exhibited the size of monomers, whereas most of the inactive LPL in the low-salt peak was at the bottom of the tube (in aggregates). Consistent with those findings, the LPL in the low-salt peak, but not that in the high-salt peak, was easily detectable with single mAb sandwich ELISAs, in which LPL is captured and detected with the same antibody. We conclude that catalytically active LPL can exist in a monomeric state.

Keywords: lipase; lipolysis; triglycerides.


Conflict of interest statement

Conflict of interest statement: M. Meiyappan and J.E.G. are employees of Shire, now part of Takeda, and Takeda stock owners. K.M. is an employee of Immunobiologic Laboratories and holds stock in that company. K.N. holds stock in Immunobiologic Laboratories and serves as a consultant for Skylight and Sysmex.

Figures

Fig. 1.
Fig. 1.
Analyzing human and bovine LPL by density gradient ultracentrifugation. Samples were loaded onto density gradients and centrifuged in an SW41 rotor (Beckman Coulter) for 23 h at 39,000 rpm. Gradients were unloaded in 38 fractions. Each fraction (70 μL) was tested for LPL activity with a [3H]triolein substrate [plotted as disintegrations per minute (DPM); y-axis on the right]. The black circles show LPL activity in the density fractions. LPL mass was assessed by Western blot analysis (blots shown on the right). The Western blots were scanned and quantified with an infrared scanner. The dotted black line depicts the intensity of the LPL band in each lane, normalized to the lane with the highest-intensity band. m, molecular mass standards. Two size markers were examined: BSA (66 kDa) and phosphorylase b (Phos B; 97.2 kDa). For each marker, protein concentration was quantified and normalized to the fraction with the highest protein concentration (protein mass is depicted on the y-axis on the left). (A and B) Size of human LPL, as judged by density gradient ultracentrifugation. Here 26 μg of purified human LPL was loaded onto a 10–30% glycerol gradient (A) or a 5–20% sucrose gradient (B). Western blot analysis was performed under nonreducing conditions with the human LPL-specific mAb 4-1a. (C) Size of bovine LPL by density gradient ultracentrifugation (5–20% sucrose gradient). Here 20 μg of purified bovine LPL was loaded onto the gradient, and Western blot analysis was performed with mAb 5D2. (D) Size of freshly secreted, catalytically active human LPL, as judged by density gradient ultracentrifugation. CHO cells stably expressing human LPL were grown in suspension culture for 2 h at 37 °C. The conditioned medium (225 μL) was loaded onto a 10–30% glycerol gradient. Western blot analysis was performed under nonreducing conditions with a rabbit polyclonal antibody against human LPL. Sucrose and glycerol density gradient studies yielded similar findings, but glycerol gradients resulted in somewhat improved preservation of LPL activity and improved separation of the BSA and Phos B markers. In D, the uneven baseline for protein standards reflects the use of an old batch of glycerol (known to interfere with the protein assay). Comparing density gradients from purified LPL and freshly secreted LPL, two differences are apparent. The freshly secreted LPL appears to be slightly larger than the purified LPL. In addition, there was no LPL activity or mass in the early fractions (fractions 1–5) with freshly secreted LPL. However, lipase activity was evident in fractions 1–5 with purified LPL, likely due to a contaminating, exogenous lipase, because human LPL was either undetectable or present in only very small amounts on the Western blot.
Fig. 2.
Fig. 2.
Size of human GPIHBP1 as measured by density gradient ultracentrifugation (5–20% sucrose gradient). Here 800 μL of medium from Drosophila S2 cells stably expressing GPIHBP1-W109S or GPIHBP1-S107C (both containing an amino-terminal uPAR tag and a carboxyl-terminal 11A12 epitope tag) was loaded onto density gradients and centrifuged in an SW41 rotor (Beckman Coulter) for 23 h at 39,000 rpm. GPIHBP1 in the 38 fractions was assessed by Western blot analysis with mAb 11A12 (blots shown below). For each GPIHBP1 species (monomers, solid black line; dimers, dashed black line; trimers, dotted black line), band intensity was normalized to the highest-intensity band, and the distribution of each GPIHBP1 species was plotted. m, molecular weight standards. GPIHBP1 monomers (30.3 kDa) were quantified from the GPIHBP1-W109S Western blots, and GPIHBP1 dimers (60.6 kDa) and trimers (90.9 kDa) were quantified from the GPIHBP1-S107C Western blots. The three size markers— carbonic anhydrase (CARB; 29 kDa), BSA (66 kDa), and phosphorylase b (Phos B; 97.2 kDa)—were examined and plotted as described in Fig. 1.
Fig. 3.
Fig. 3.
Size of GPIHBP1-bound LPL measured by density gradient ultracentrifugation. Purified human LPL (26 μg) was preincubated on ice for 10 min alone or in combination with a uPAR-tagged wild-type human GPIHBP1 (LPL + GPIHBP1) (23.7 μg) and then loaded on 10–30% glycerol gradients and centrifuged in an SW41 rotor (Beckman Coulter) for 23 h at 39,000 rpm. Two size markers were examined, BSA (66 kDa) and phosphorylase b (Phos B; 97.2 kDa), as described in Fig. 1. The uneven baseline for protein standards reflects the use of an old batch of glycerol (known to interfere with the protein assay). 70 μL of the “LPL alone” density fractions (black circles) and 0.5 μL of fractions for LPL + GPIHBP1 (green circles) were tested for LPL activity with a [3H]triolein substrate (plotted as DPM on the y-axis on the right). LPL mass is also shown, based on quantification of LPL bands on the Western blots shown below. Western blots were performed under nonreducing conditions with a rabbit polyclonal antibody against human LPL. Quantification of the Western blot data was performed as described in Fig. 1. The black dotted line represents data for LPL alone, and the green dotted line represents data for LPL + GPIHBP1. m, molecular weight standards.
Fig. 4.
Fig. 4.
The size of LPL, as judged by density gradient ultracentrifugation, is increased by heparin or dextran sulfate. Samples were loaded onto 10–30% glycerol gradients and centrifuged in an SW41 rotor (Beckman Coulter) for 23 h at 39,000 rpm. LPL activity in each fraction was tested with a [3H]triolein substrate (DPM on the y-axis on the right). For A, B, and D, LPL mass in each fraction was assessed with Western blot analysis of SDS-polyacrylamide gels (nonreduced samples). Western blots (shown on the right) were scanned and quantified, and the data were plotted as described in Fig. 1. m, molecular weight standards. Two protein standards, BSA (66 kDa) and phosphorylase b (Phos B; 97.2 kDa), were examined, as described in Fig. 1. (A) Size of purified human LPL in the presence and absence of heparin. Purified human LPL (20 µg) or purified human LPL (5 µg) that had been incubated with heparin (10 U/mL) was loaded onto density gradients. Density fractions (70 µL for LPL alone fractions, 25 µL for LPL + heparin fractions) were tested for LPL activity, and the data are plotted as gray and red circles, respectively. Western blot analysis was performed with a rabbit polyclonal antibody against human LPL; LPL mass data from the LPL alone and LPL + heparin Western blots are plotted as black and red dotted lines, respectively. (B) The size of freshly secreted LPL is influenced by the inclusion of heparin or dextran sulfate in the culture medium. Human LPL-expressing cells were grown in suspension culture (8 × 10⁶ cells/mL) for 2 h at 37 °C in medium containing either heparin (50 U/mL) or dextran sulfate (molecular mass >500 kDa; 1 g/L). Conditioned medium (225 μL) was loaded onto gradients. The distribution of LPL catalytic activity in density fractions (70 μL) is plotted. The red circles represent LPL from medium containing heparin; gray circles, LPL from medium containing dextran sulfate. Western blots for LPL were performed with mAb 4-1a, and the band intensities were quantified. The red dotted line represents the distribution of LPL mass when cells were grown in medium containing heparin; the black dotted line, the distribution of LPL mass when cells were grown in medium containing dextran sulfate. The uneven baseline for protein standards reflects the use of an old batch of glycerol (known to interfere with the protein assay). (C) Size of LPL in postheparin plasma by density gradient ultracentrifugation. Pooled human postheparin plasma (200 μL) was loaded onto the gradient. To assess LPL activity, each fraction (150 μL) was loaded onto mAb 88B8-coated wells, and the triglyceride hydrolase activity of the captured LPL was measured with a [3H]triolein substrate. The gray circles represent LPL activity in the density fractions. Relative amounts of LPL mass were measured by adding 50 μL of each fraction to mAb 88B8-coated wells and then detecting bound LPL with HRP-labeled mAb 5D2. The OD450 value of each fraction, reflecting relative amounts of LPL mass, was normalized to the fraction with the highest OD450 value (fraction 12). LPL mass is plotted as a dotted black line. (D) Size of human LPL purified by ion-exchange chromatography in the presence of dextran sulfate (5 kDa). Here 20 µg of the LPL was loaded onto the density gradient. Each fraction (25 µL) was tested for LPL activity, and the data are plotted as gray circles. Western blot analysis was performed with a rabbit polyclonal antibody against human LPL; the LPL mass data are plotted as a black dotted line.
Fig. 5.
Fig. 5.
Elution of human LPL from a heparin-Sepharose column with a linear NaCl gradient. CHO cells expressing human LPL were grown in suspension culture for 16 h at 37 °C in medium containing protease inhibitors. Then 40 mL of medium was loaded onto a 3-mL heparin-Sepharose column, and the LPL was eluted with a NaCl gradient (0.4–2 M). For LPL activity measurements, 10 μL of each fraction was added to 88B8-coated wells, and triglyceride hydrolase activity was assessed with a [3H]triolein substrate (plotted as DPM on the y-axis on the right). The relative amount of LPL mass in the different fractions was assessed by Western blot analysis of SDS-polyacrylamide gels using mAb 4-1a or a rabbit polyclonal antibody against human LPL (antibody 1256). Samples were electrophoresed under reducing (R) and nonreducing (NR) conditions. A 55-kDa LPL band and a high molecular mass band (∼100 kDa) from the Western blots were quantified with an infrared scanner, normalized to the lane with the highest-intensity band, and averaged. The Western blot band intensity data (solid red line, 55-kDa LPL; dotted red line, high molecular weight LPL) were plotted along with the enzymatic activity data (black circles). LPL was characterized in each fraction (10 μL) with two different single-mAb sandwich ELISAs (an 88B8-88B8 sandwich ELISA and a 5D2-5D2 sandwich ELISA). The OD450 readings, after normalization to the well with the highest OD450 value, are plotted in pink for the 88B8-88B8 ELISA and in green for the 5D2-5D2 ELISA. *Denotes fractions that were subjected to density gradient ultracentrifugation (Fig. 6). FT, flow-through; m, SDS/PAGE protein size markers; MW, molecular weight.
Fig. 6.
Fig. 6.
Density gradient ultracentrifugation studies to assess the size of the LPL in fractions from the low- and high-salt peaks from a heparin-Sepharose column. Here 800 μL of two fractions from the low-salt peak (fractions 10 and 11) and 500 μL of two fractions from the high-salt peak (fractions 17 and 18) of the heparin-Sepharose column (shown in Fig. 5) were loaded onto 10–30% glycerol gradients and centrifuged in an SW41 rotor (Beckman Coulter) for 30 h at 39,000 rpm. Triglyceride hydrolase activity in 30 μL of each density fraction was assessed with a [3H]triolein substrate. (A) LPL activity (plotted as DPM on the y-axis on the right) for density gradient fractions derived from “high-salt peak fractions” 17 and 18. (B) LPL activity (plotted as DPM on the y-axis on the right) for density gradient fractions derived from “low-salt peak” fractions 10 and 11. Note the different scales on the right y-axis for A and B. (C) Assessing LPL mass in density gradient fractions by Western blot analysis with a rabbit polyclonal antibody against human LPL. Density gradient fractions derived from the high-salt peak fractions 17 and 18 were size-fractioned by SDS/PAGE under nonreducing conditions, while the density gradient fractions derived from the low-salt peak fractions 10 and 11 were electrophoresed under reducing conditions. m, SDS/PAGE protein size markers. Western blot band intensities for the high-salt fractions in C are quantified and plotted in SI Appendix, Fig. S2. SI Appendix, Fig. S3 depicts the distribution of LPL in density gradient fractions derived from the low-salt peak fractions 10 and 11, as measured by 88B8-88B8 and 5D2-5D2 single-mAb ELISA.
Fig. 7.
Fig. 7.
Testing the capacity of ELISAs to detect mixed LPL species in the medium of CHO cells that were cotransfected with two differentially tagged wild-type (wt) human LPL expression vectors (FLAG, S-protein). In one set of cotransfection experiments (AC), both epitope tags were at the amino terminus of LPL (FLAGwt + Swt); in another set of cotransfection experiments (DF), the FLAG tag was at the amino terminus, while the S-protein tag was at the carboxyl terminus (FLAGwt + wtS). As a control, we examined medium from cells that expressed a doubly tagged LPL (FLAGwtS). All of the tagged LPL constructs expressed catalytically active LPL. At 24 h after transfection, the medium was replaced, and the cells were incubated for 2 h at 37 °C in fresh medium containing 0.1% FBS. Samples of the conditioned medium were collected and applied to duplicate 96-well plates that had been coated with mAb 88B8 (A and D), a FLAG mAb (B and E), or an S-protein antibody (C and F). One set of 96-well plates was used solely for measuring LPL activity in samples of conditioned medium. Aliquots of medium from the cotransfected cells (either FLAGwt + Sw or FLAGwt + wtS) or dilutions of medium from cells expressing doubly tagged LPL (FLAGwtS) were added to 96-well plates, and the activity of antibody-captured LPL was assessed with a [3H]triolein substrate. As expected, all the samples of medium contained LPL activity (>103 DPM) (AF). The second set of 96-well plates was used for ELISAs. The antibody-captured LPL was detected with HRP-labeled versions of mAb 88B8, FLAG antibody, or S-protein antibody. (The HRP antibody used is shown in the legend at the top of A and D.) The LPL activity was plotted on the x-axis, and the OD450 of the ELISA (reflecting relative amounts of LPL mass) was plotted on the y-axis. When captured with mAb 88B8 (A and D), the tagged LPLs were readily detected with the HRP-labeled epitope tag antibodies but not with HRP–mAb 88B8. Similarly, when the LPL was captured with the FLAG antibody (B and E), the LPL could be easily detected with HRP-mAb 88B8 but not with HRP-labeled FLAG antibody. When the LPL was captured with the S-protein antibody (C and F), the LPL could be easily detected with HRP-mAb 88B8 but not with HRP-labeled S-protein antibody. In addition, the LPL captured by the FLAG antibody (B and E) yielded a very low signal with the HRP-labeled S-protein antibody, and the LPL captured by the S-protein antibody (C and F) yielded a very low signal with the HRP-labeled FLAG antibody. In contrast, at similar activity levels, the LPL produced by FLAGwtS-transfected cells yielded a very robust signal in both ELISAs (B, C, E, and F). Considered together, these findings indicate that there were very low amounts of mixed LPL species [i.e., LPL species containing both FLAGwt and Swt (B and C) or both FLAGwt and wtS (E and F)] in the medium of the cotransfected cells. Of note, as shown in Fig. 8, the very low amounts of mixed LPL species present in the medium did not contribute to the catalytic activity found in the medium of the cotransfected cells.
Fig. 8.
Fig. 8.
Heparin-Sepharose chromatography analysis of properties of mixed LPL species in the medium of cells coexpressing two differentially tagged LPL constructs, one for LPL with an amino-terminal FLAG tag and the other for LPL containing a carboxyl-terminal S-protein tag (FLAGwt and wtS). Conditioned medium (40 mL) from the cotransfected cells was loaded onto a heparin-Sepharose column, and the LPL was eluted with a NaCl gradient into 25 fractions. Samples of each fraction were collected and applied to duplicate sets of 96-well plates that had been coated with mAb 88B8 (A), a FLAG mAb (B), or an S-protein antibody (C). To assess LPL activity, 175 μL from each fraction was added to one set of 96-well plates, and the esterase activity of antibody-captured LPL was measured with the DGGR substrate (plotted as relative fluorescent units; y-axis on the right). LPL mass in the samples was assessed with ELISAs by adding fractions (1–10 μL) onto the second set of 96-well plates. The antibody-captured LPL was then detected with HRP-labeled FLAG antibody, S-protein antibody, or mAb 88B8. The OD450 value, reflecting relative amounts of LPL mass in each fraction, is plotted on the y-axis on the left. With mAb 88B8-coated plates (A), LPL catalytic activity was found in fractions from the high-salt peak (fractions 14–21) but was nearly absent in fractions from the low-salt peak (fractions 7–13). However, the two differentially tagged LPLs were detected in both the low-salt and high-salt peaks, as determined by ELISAs using HRP-labeled FLAG or S-protein antibodies. In plates coated with the FLAG antibody (B), LPL activity was confined to fractions of the high-salt peak, but the FLAG-tagged LPL was found in fractions from both the low-salt and high-salt peaks, as determined by an ELISA using HRP-labeled mAb 88B8. Of note, the mixed LPL species (i.e., FLAG antibody-captured LPL that could be detected with the HRP-labeled S-protein antibody) were confined to fractions of the catalytically inactive low-salt peak. Similarly, in plates coated with the S-protein antibody (C), LPL activity was confined to fractions of the high-salt peak, but the S-protein-tagged LPL was found in fractions of both the low-salt and high-salt peaks, as determined by ELISA using an HRP-labeled mAb 88B8. However, mixed LPL species (S-protein antibody–captured LPL that could be detected with HRP-labeled FLAG antibody) were confined primarily to fractions from the inactive low-salt peak. FT, flow-through.

Similar articles

Cited by

References

    1. Fong LG, et al. GPIHBP1 and plasma triglyceride metabolism. Trends Endocrinol Metab. 2016;27:455–469. - PMC - PubMed
    1. Davies BS, et al. GPIHBP1 is responsible for the entry of lipoprotein lipase into capillaries. Cell Metab. 2010;12:42–52. - PMC - PubMed
    1. Beigneux AP, et al. Assessing the role of the glycosylphosphatidylinositol-anchored high-density lipoprotein-binding protein 1 (GPIHBP1) three-finger domain in binding lipoprotein lipase. J Biol Chem. 2011;286:19735–19743. - PMC - PubMed
    1. Gin P, et al. Binding preferences for GPIHBP1, a glycosylphosphatidylinositol-anchored protein of capillary endothelial cells. Arterioscler Thromb Vasc Biol. 2011;31:176–182. - PMC - PubMed
    1. Lookene A, Groot NB, Kastelein JJ, Olivecrona G, Bruin T. Mutation of tryptophan residues in lipoprotein lipase: Effects on stability, immunoreactivity, and catalytic properties. J Biol Chem. 1997;272:766–772. - PubMed

Publication types