. 2019 Mar 8;10(1):1146.
doi: 10.1038/s41467-019-08480-y.

Deciphering the complex role of thrombospondin-1 in glioblastoma development

Affiliations

Deciphering the complex role of thrombospondin-1 in glioblastoma development

Thomas Daubon et al. Nat Commun. .

Abstract

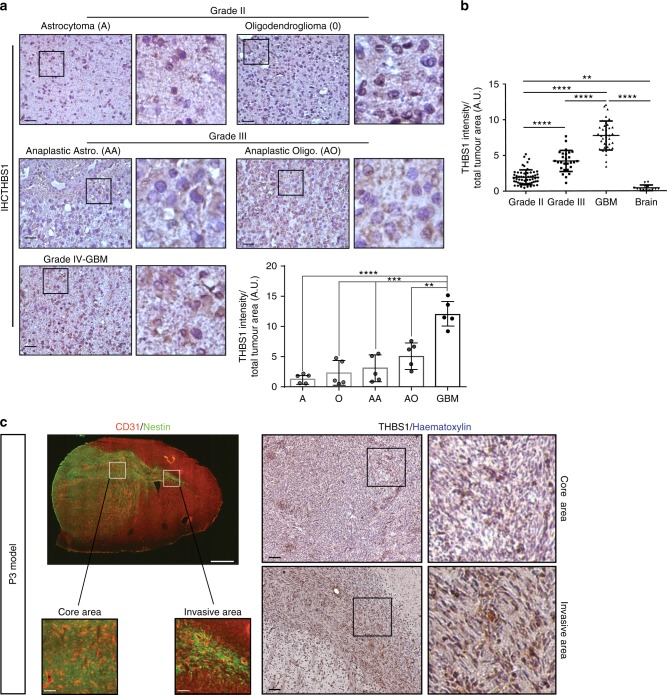
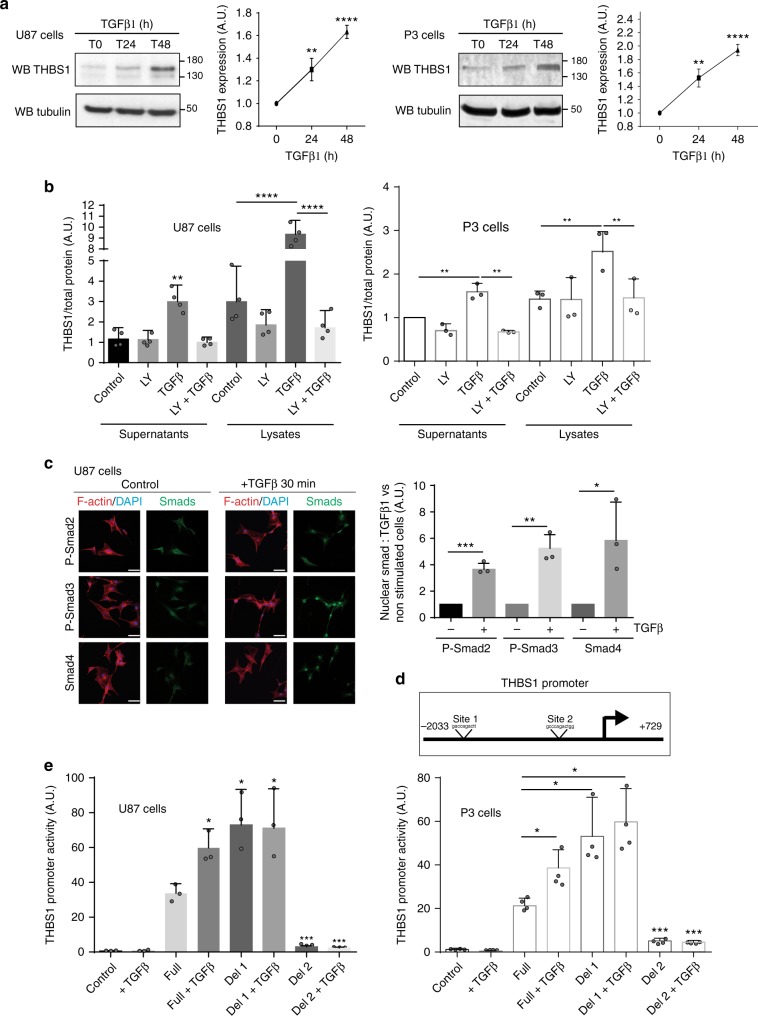
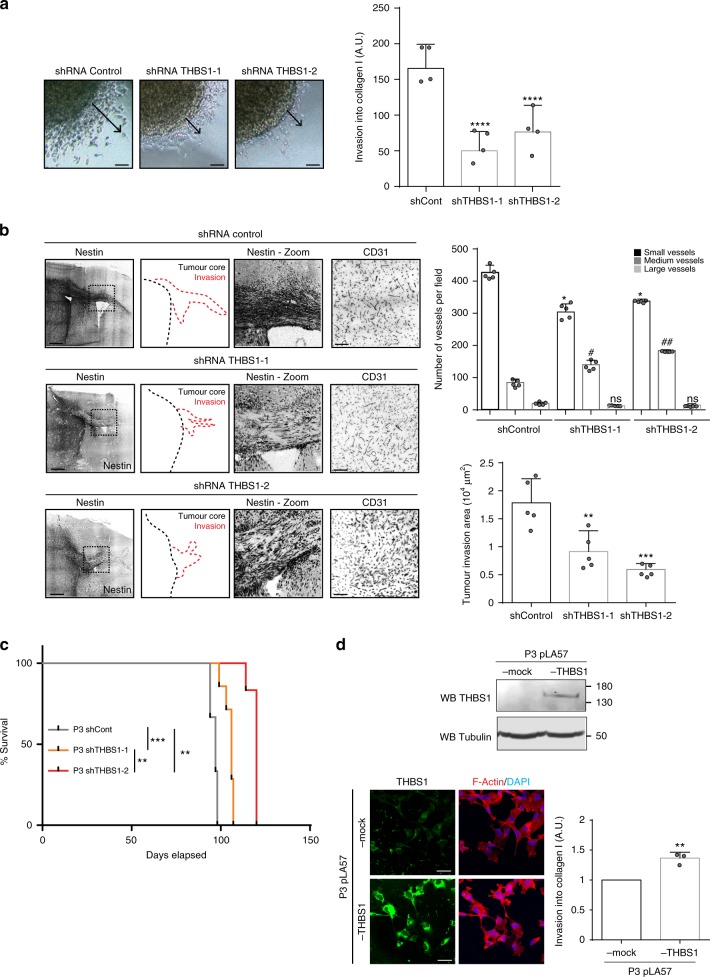
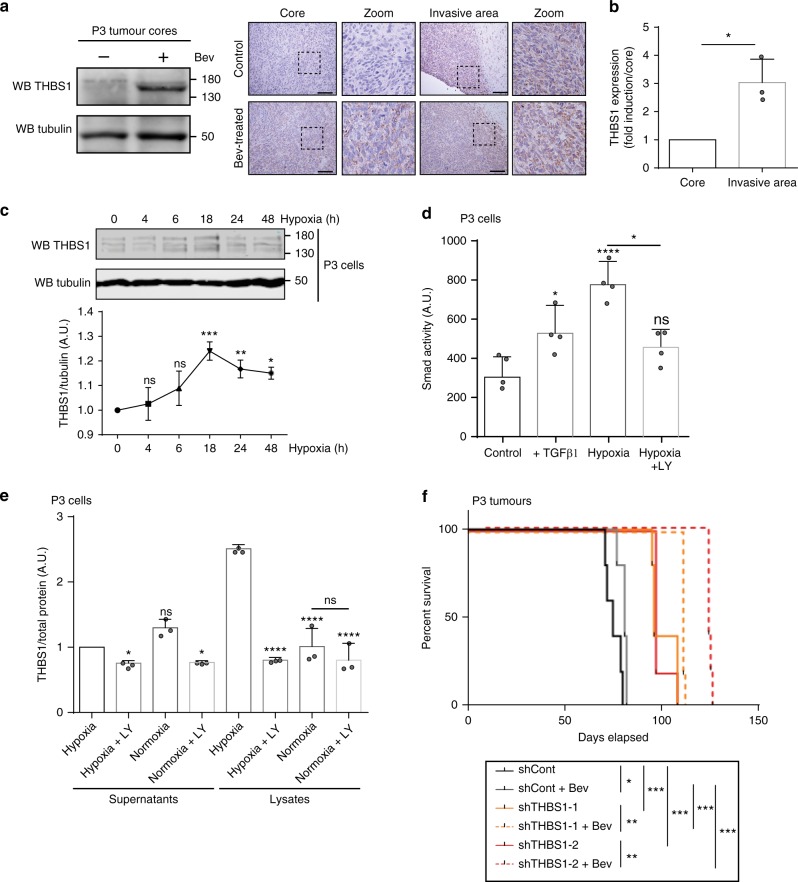
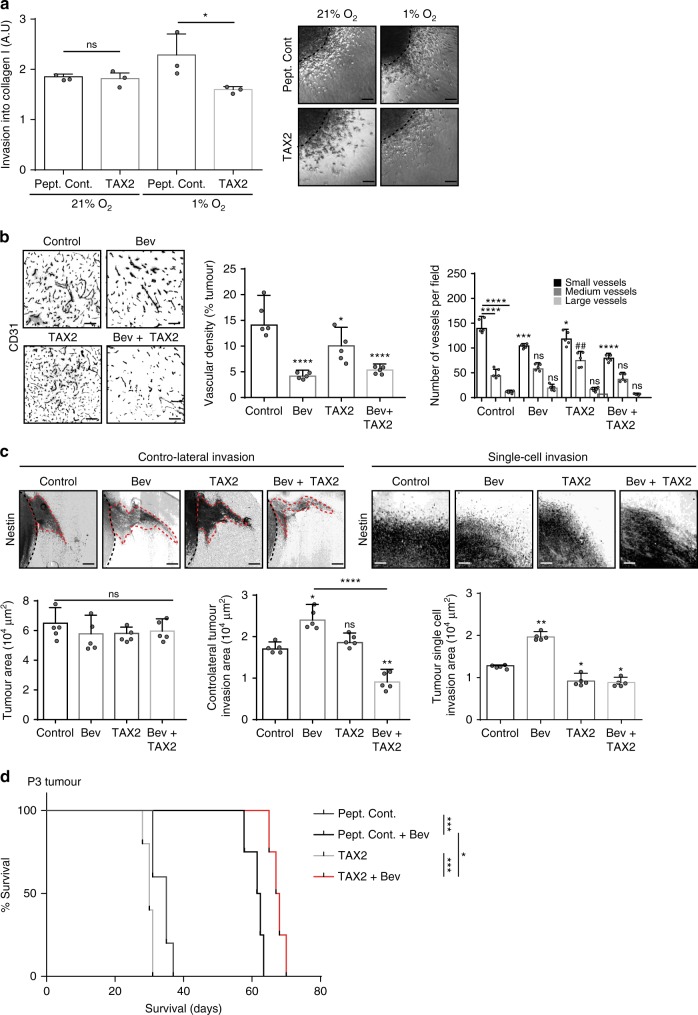
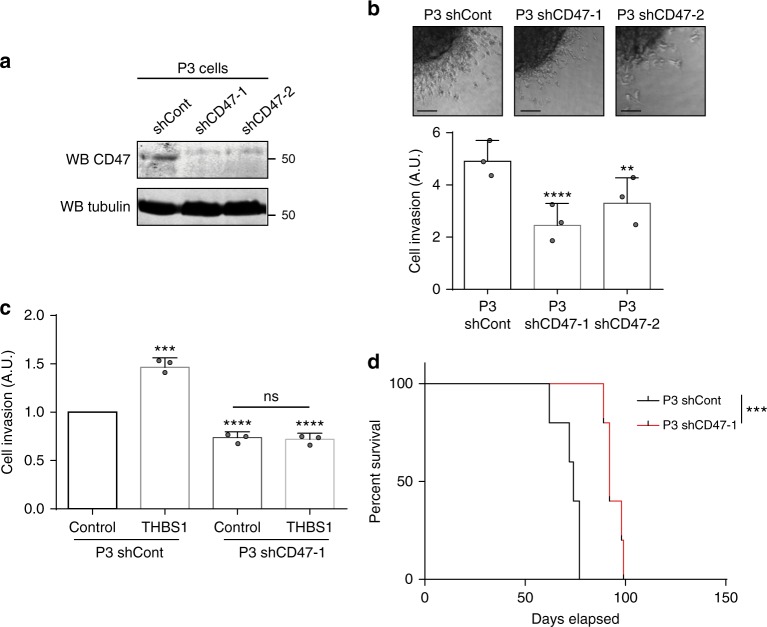
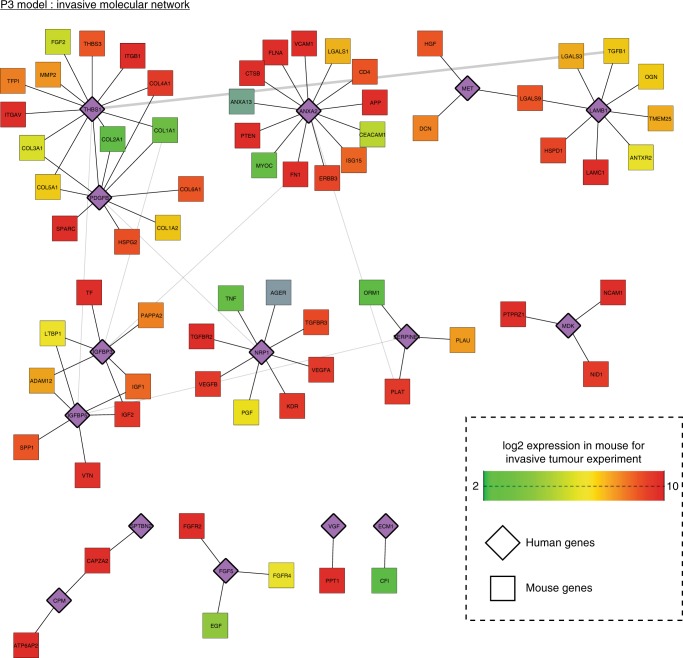
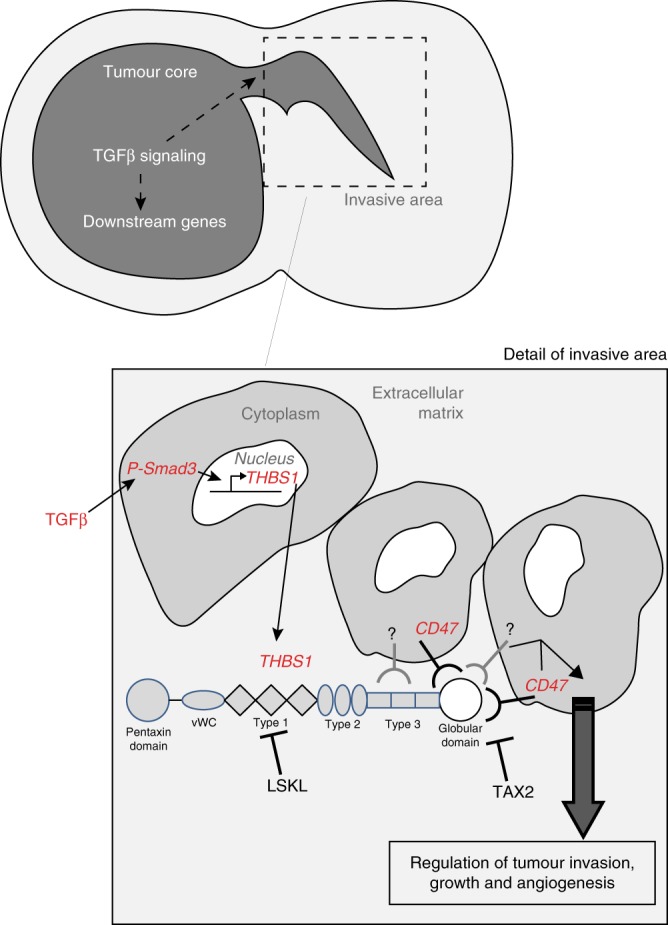
We undertook a systematic study focused on the matricellular protein Thrombospondin-1 (THBS1) to uncover molecular mechanisms underlying the role of THBS1 in glioblastoma (GBM) development. THBS1 was found to be increased with glioma grades. Mechanistically, we show that the TGFβ canonical pathway transcriptionally regulates THBS1, through SMAD3 binding to the THBS1 gene promoter. THBS1 silencing inhibits tumour cell invasion and growth, alone and in combination with anti-angiogenic therapy. Specific inhibition of the THBS1/CD47 interaction using an antagonist peptide decreases cell invasion. This is confirmed by CD47 knock-down experiments. RNA sequencing of patient-derived xenograft tissue from laser capture micro-dissected peripheral and central tumour areas demonstrates that THBS1 is one of the gene with the highest connectivity at the tumour borders. All in all, these data show that TGFβ1 induces THBS1 expression via Smad3 which contributes to the invasive behaviour during GBM expansion. Furthermore, tumour cell-bound CD47 is implicated in this process.


Conflict of interest statement

The authors declare no competing interests.

Figures

Fig. 1
Fig. 1
THBS1 is a marker of high-grade glioma. a Immunohistochemistry (IHC) of THBS1 in patient samples from grade II astrocytomas and oligodendrogliomas (upper panels), grade III anaplastic astrocytomas and anaplastic oligodendrogliomas (middle panels) and grade IV glioblastomas (lower panels). Magnification of tumour areas is shown in each panel on the right hand side. Scale: 50 µm. Quantification of THBS1 staining by IHC profiler from Fiji software. A, astrocytomas (n = 5); O, oligodendrogliomas (n = 5); AA, anaplastic astrocytomas (n = 5); AO, anaplastic oligodendrogliomas (n = 5); and GBM, glioblastomas (n = 5). The graph represents the results as means ± s.d. **P < 0.01; ***P < 0.001; ****P < 0.0001; ns not significant (ANOVA). b Quantification of THBS1 staining by using tissue microarrays. 121 patients were analysed using TMA (Biomax), and IHC with anti-THBS1 antibodies. 57 were of grade II, 27 of grade III and 37 of GBM–grade IV. The graph represents the results as means ± s.d. **P < 0.01; ****P < 0.0001 (ANOVA). c Left panels: immunofluorescence stainings of CD31 (red) and Nestin (green) of a P3 tumour section. Images below represent core and invasive areas. Scales: 500 µm (upper panel) and 20 µm (lower panels). Right panels: IHC for THBS1 in samples representing core and invasive areas in P3 tumours, counterstained with haematoxylin. THBS1 is expressed in invasive areas of P3 tumours. Scale: 50 µm
Fig. 2
Fig. 2
THBS1 expression is regulated by TGFβ1 via SMAD3 promoter binding. a Analysis of THBS1 expression in protein extracts from non-treated or TGFβ1-treated U87 (left) and P3 (right) cells (24 or 48 h treatment). TGFβ1 was used at a concentration of 5 ng/ml. The graphs represent quantifications of THBS1 signal normalised to Tubulin (n = 3). Densitometry analysis (right panels) is represented as fold induction compared to control. Student’s t-test P- value: **P < 0.01; ****P < 0.0001. b ELISA experiment performed on U87 (left) and P3 (right) cell supernatants or lysates, treated with 5 ng/ml of TGFβ1, 10 µM of TGFβR inhibitor LY2157299 or combination treatment for 48 h. The graph represents a mean of four (U87) or three (P3) independent experiments as fold induction to non-treated cells. c Representative immunofluorescence images of starved U87 control or TGFβ1-treated cells (30 min TGFβ1 treatment with a concentration of 5 ng/ml) showing nuclear translocation of P-SMAD2, P-SMAD3 or SMAD4. Staining: Smads (green), Phalloidin for F-Actin (red) and DAPI for nuclei (blue). Scale bars: 10 µm. The graph on the right represents a mean of three independent experiments (100 cells analysed in each), as fold induction vs non-treated cells. d Schematic representation of SMAD3-binding sites on THBS1 promoter. Binding site 1 is located at −1125/−1115 and binding site 2 at −110/−100 on the THBS1 promoter. e Luciferase promoter activity was measured by transfecting a PGL3 vector containing the full-length THBS1 promoter (Full) or inserts deleted either in binding site 1 (Del1) or binding site 2 (Del2). A GFP plasmid was used as a control. U87 (left) and P3 (right) cells were starved for 24 h and treated with 5 ng/ml of recombinant TGFβ1. The results are represented of three (U87) or four (P3) independent experiments. All graphs are represented as means ± s.d. *P < 0.05; **P < 0.01; ***P < 0.001; ns, not significant (ANOVA)
Fig. 3
Fig. 3
THBS1 controls invasion and growth of P3 tumour. a P3 cells were transduced with shRNA control or shRNA THBS1 (−1 and −2). P3 spheroid invasion was measured in collagen I gels after 24 h. Arrows represent the migration distance from the spheroid core. Scale: 50 µm. The graph represents the invasion results as means ± s.d. of four independent experiments each done in 6–8 replicates for each condition. ****P < 0.0001 (ANOVA). b Control shRNA or THBS1 shRNA-transduced P3 cells were xenotransplanted into Ragγ2 C−/− mice. Representative images of tumours with invasive areas are shown by Nestin staining (grey) with schematic representations (invasion in red dashed lines and tumour mass in black dashed lines). Scale: 200 µm. The graphs on the right represent the number of small (<10 µm), medium (between 10 and 20 µm), large blood vessels (>20 µm) (upper panel) and the invasion area (lower panel) of control shRNA and THBS1-1/-2 shRNA-transduced P3 tumours (average of 5 tumours with 8 sections/tumour analysed; * means comparison of small vessels; # means comparison of medium size vessels). The graphs represent results as means ± s.d (n = 5 tumours analysed per group). *P < 0.05; #P < 0.05; ##P < 0.01; ns, not significant (ANOVA). c Kaplan–Meier survival curves of xenotransplanted mice with shTHBS1-1 (orange line), shTHBS1-2 (red line) or shControl (grey line) transduced P3 cells, based on the presence of neuropathological features (n = 8 mice per group); P-values were calculated with log-rank test, **P-value < 0.01, ***P-value < 0.001. d P3 cells were transduced with pLA57-control or pLA57-THBS1 lentiviral constructs. Analysis of THBS1 and Tubulin expression in protein extracts from pLA57-control or pLA57-THBS1 P3 cells by western blot (Upper panel) and by immunostaining (lower left panel), THBS1 (green) and F-actin (red) and nuclei (blue). Scale bar: 10 µm. pLA57-control or pLA57-THBS1 P3 cell spheroid invasion was measured in collagen I gels after 24 h. The graph represents the results as means ± s.d of three independent experiments each done in 6–8 replicates for each condition, **P < 0.01 (Student t-test)
Fig. 4
Fig. 4
THBS1 is induced by hypoxia through TGFβ1 activation. a Protein extracts from P3 tumour cores were analysed by western blot probed with anti-THBS1 and anti-Tubulin antibodies (left panel). Representative images of P3 control or bevacizumab-treated tumours stained for THBS1 (brown) and counterstained with haematoxylin (blue) are shown (right panels). Images represent the core and the invasive areas of both tumours. Scale bars: 100 µm. b qPCR of THBS1 transcript from the core or the invasive area of P3 tumours, after laser microdissection. Three independent tumours were analysed, results are represented as means ± s.d and compared to the tumour core. *P < 0.05 (Student t-test). c Immunoblots of protein extracts from P3 cells exposed to hypoxia (1% O2) for 4, 6, 18, 24 or 48 h, and probed with anti-THBS1 or anti-Tubulin antibodies. The graph below represents ratios of THBS1 and Tubulin signal intensities. Results are represented as means ± s.d. of three independent experiments. *P < 0.05; **P < 0.01; ***P < 0.001; ns, non-significant (Student t-test, comparison to time 0). d P3 cells were incubated under normoxia (21% O2) or hypoxia (1% O2) for 48 h and stimulated or not with 5 ng/ml of recombinant TGFβ1 or 10 µM of LY2157299. Cells were transfected with SRE construct and luciferase activity was assessed. Results are represented as means ± s.d. of four independent experiments. e ELISA experiments performed on P3 cell lysates and supernatants. Cells were treated or not with 10 µM of TGFβR inhibitor LY2157299, in normoxic or hypoxic conditions for 48 h. The graph represents three independent experiments as fold induction in comparison to non-treated cells (mean ± s.d.). *P < 0.05; **P < 0.01; ***P < 0.001; ****P < 0.0001; ns, non-significant (ANOVA). f Kaplan–Meier survival curves of mice with intracranially implanted control (grey lines), THBS1-1 (orange lines) or THBS1-2 (red lines) shRNA-transduced P3 cells. Animals were treated or not with Bevacizumab (Bev) (n = 7 mice per group); P-values were calculated with log-rank test; *P-value < 0.05; **P-value < 0.01; ***P-value < 0.001
Fig. 5
Fig. 5
THBS1/CD47 interaction in P3 tumour invasion and growth. a P3 cells were included into collagen I gels and then incubated in normoxia (21 % O2) or hypoxia (1 % O2). P3 spheroid invasion was measured in collagen I gels after 24 h. Scale: 50 µm. The graph represents the results as means ± s.d. of three independent experiments, each done in 6–8 replicates for each condition. *P < 0.05; ns, non-significant (ANOVA). b P3 tumours were treated with 10 mg/kg (BW) of bevacizumab (Bev), control peptide (control), TAX2 alone (TAX2) or in combination (Bev + TAX2). Tumours sections were stained with anti-CD31 antibody. Scale: 20 µm. The graphs below represent the vascular density (left panel) and the quantification of vessel types according to size (right panel: small vessels < 10 μm; medium size vessels between 10 and 20 μm; large vessels > 20 μm) (average of 5 tumours with 8 sections/tumour analysed). Results are represented as means ± s.d. *P < 0.05; ***P < 0.001; ****P < 0.0001 for small vessel comparison; ##P < 0.01 for medium vessel comparison; ns, non-significant (ANOVA). c P3 tumours were stained for Nestin (grey) to evaluate contra-lateral or single-cell invasions (black dashed lines around tumour edges and red dashed lines around invasive areas). Scale: 100 µm. The graphs below represent core (left panel), contra-lateral invasion (medium panel) and single-cell invasion (right panel) areas of tumours from treated and untreated mice (average of 5 tumours with 8 sections/tumour analysed). Results are represented as means ± s.d. *P < 0.05; **P < 0.01; ****P < 0.0001; ns, non-significant (ANOVA). d Kaplan–Meier survival curves of P3 xenotransplanted mice treated with control peptide, TAX2 and bevacizumab alone or in combination (n = 5 mice per group); P-values were calculated with log-rank test; *P-value < 0.05; ***P-value < 0.001
Fig. 6
Fig. 6
Tumour-associated CD47 controls glioma cell invasion and motility. a Immunoblots of protein extracts from control or CD47-1/-2 shRNA-transduced P3 cells probed with anti-CD47 or anti-Tubulin antibodies. b P3 cells were transduced with control or CD47 (−1 and −2) shRNAs. P3 spheroid invasion was measured in collagen I gels after 24 h. Scale: 50 µm. The graph below represents the results as means ± s.d. of three independent experiments each done in 6–8 replicates for each condition. **P < 0.01; ****P < 0.0001 (ANOVA). c Effect of THBS1 on P3 cells transduced with control or CD47-1 shRNAs. Full-length THBS1 was used at a concentration of 10 µg/ml and invasion in collagen I gels was measured after 24 h. The results are expressed as means ± s.d. of three independent experiments each done in 6–8 replicates for each condition. **P < 0.01; ****P < 0.0001; ns, non-significant (ANOVA). d Kaplan–Meier survival curves of mice bearing control or CD47-1 shRNA-transduced P3 tumours (n = 5 mice per group); P-values were calculated with log-rank test; ***P-value < 0.001
Fig. 7
Fig. 7
Transcriptional analysis highlights THBS1 as central regulator of GBM invasion. A network of proteins encoded by genes that are overexpressed in the invasive area of P3 tumours when compared to the core area, or are expressed by the host. Relationships in the network represent known protein–protein interactions. Human genes are represented in purple and mouse genes are colour coded according to their expression (green (2) – red (10); normalised counts in log2 scale)
Fig. 8
Fig. 8
Proposed model for GBM invasion TGFβ1 is expressed in both the core and the invasive areas in GBM. THBS1 is transcriptionally regulated via SMAD3, which binds to regulatory elements in the THBS1 gene. THBS1 will then be released and act on tumour cell invasion and expansion. The interaction with CD47 is critical in this process

References

    1. Louis DN, et al. The 2007 WHO classification of tumours of the central nervous system. Acta Neuropathol. 2007;114:97–109. doi: 10.1007/s00401-007-0243-4. - DOI - PMC - PubMed
    1. Kotliarova S, Fine HA. SnapShot: glioblastoma multiforme. Cancer Cell. 2012;21:710–710 e711. doi: 10.1016/j.ccr.2012.04.031. - DOI - PubMed
    1. Keunen O, et al. Anti-VEGF treatment reduces blood supply and increases tumor cell invasion in glioblastoma. Proc. Natl Acad. Sci. USA. 2011;108:3749–3754. doi: 10.1073/pnas.1014480108. - DOI - PMC - PubMed
    1. Murphy-Ullrich JE, Sage EH. Revisiting the matricellular concept. Matrix Biol. 2014;37:1–14. doi: 10.1016/j.matbio.2014.07.005. - DOI - PMC - PubMed
    1. Friedl P, Alexander S. Cancer invasion and the microenvironment: plasticity and reciprocity. Cell. 2011;147:992–1009. doi: 10.1016/j.cell.2011.11.016. - DOI - PubMed

Publication types

MeSH terms