. 2019 Mar 8;10(1):1135.
doi: 10.1038/s41467-019-08989-2.

Apoptotic tumor cell-derived microRNA-375 uses CD36 to alter the tumor-associated macrophage phenotype

Affiliations

Apoptotic tumor cell-derived microRNA-375 uses CD36 to alter the tumor-associated macrophage phenotype

Ann-Christin Frank et al. Nat Commun. .

Abstract

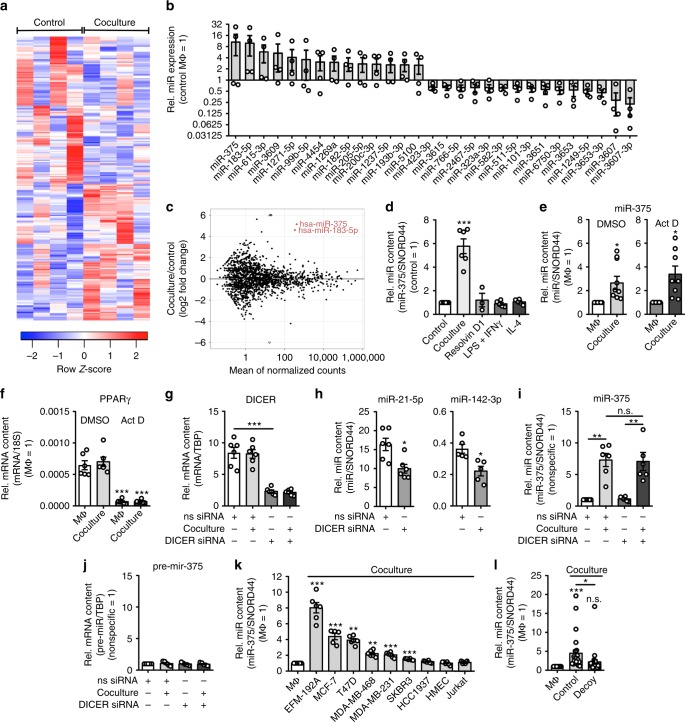
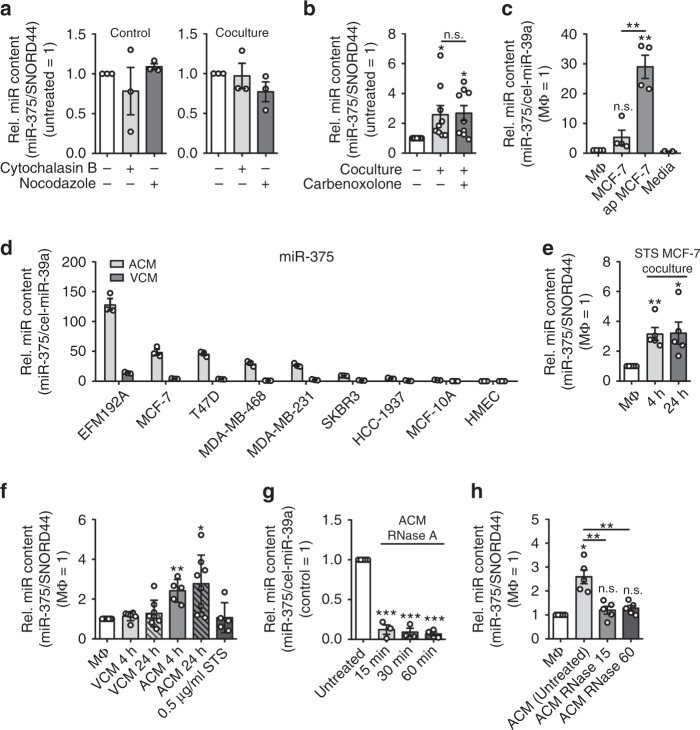
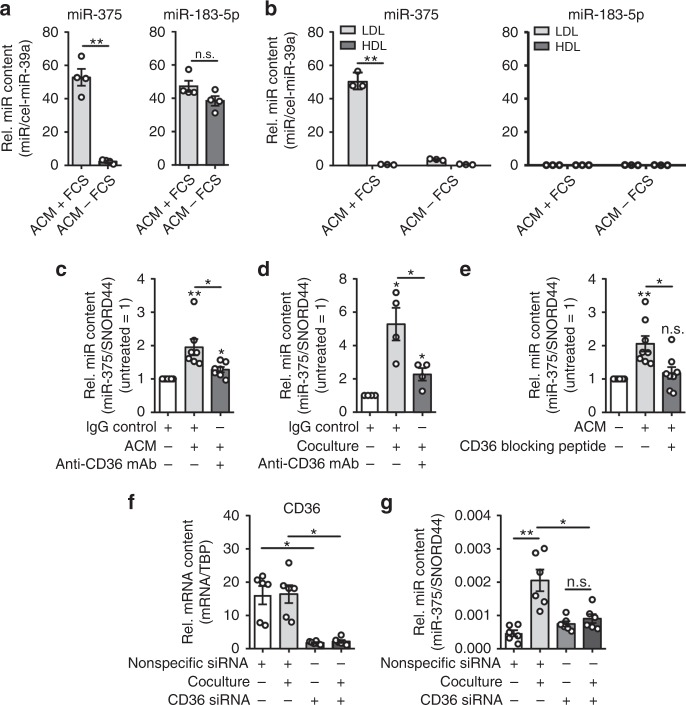
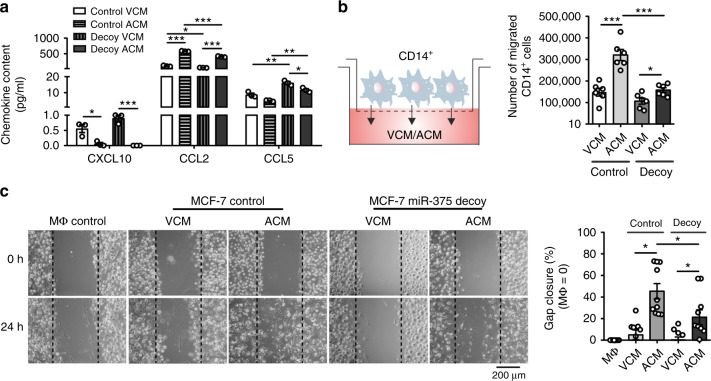
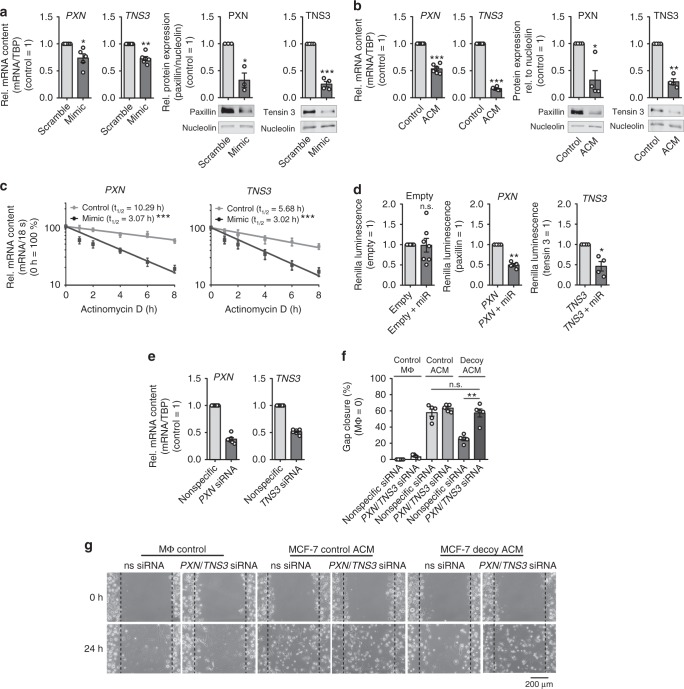
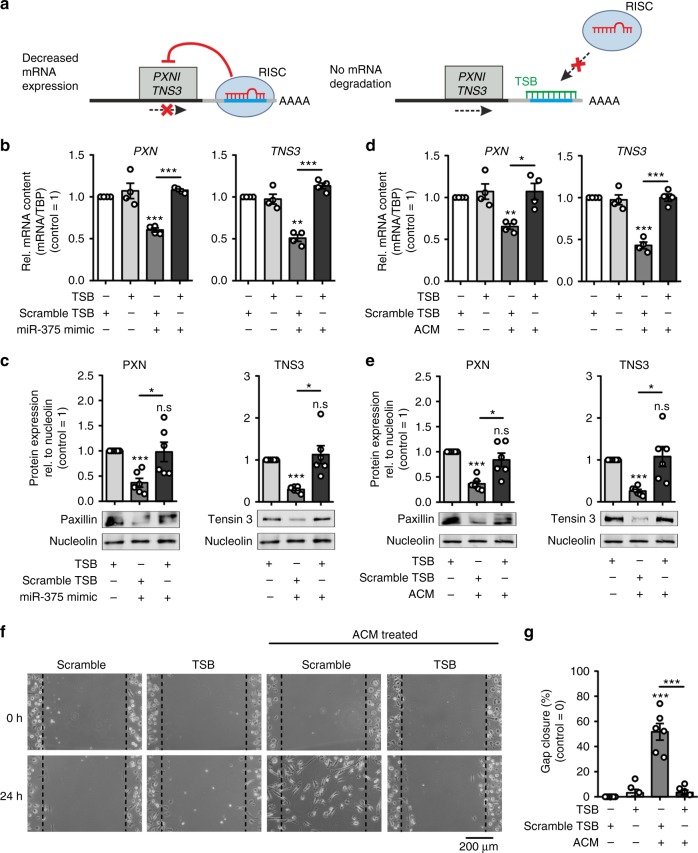
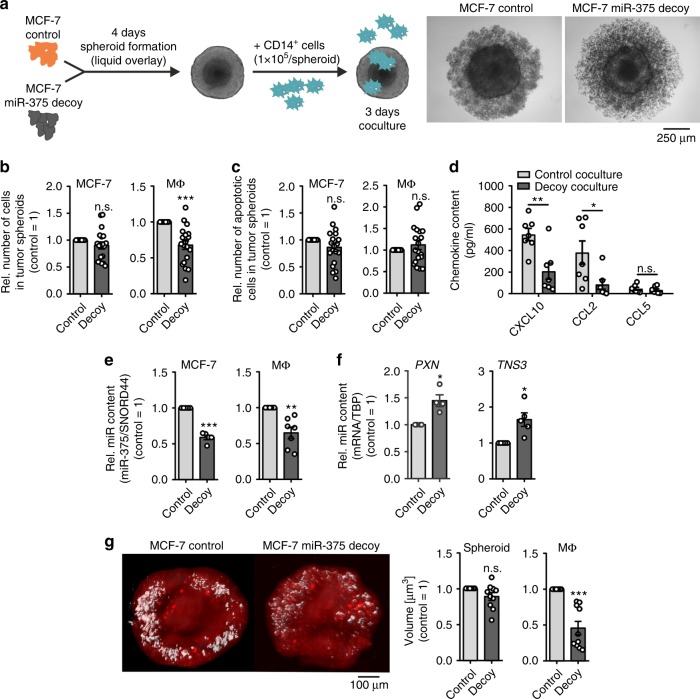
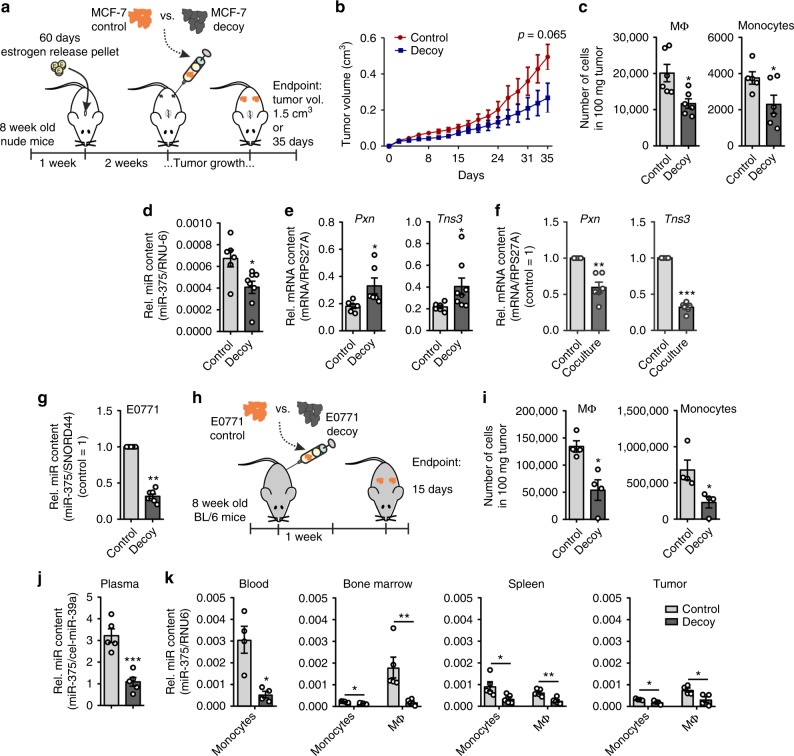
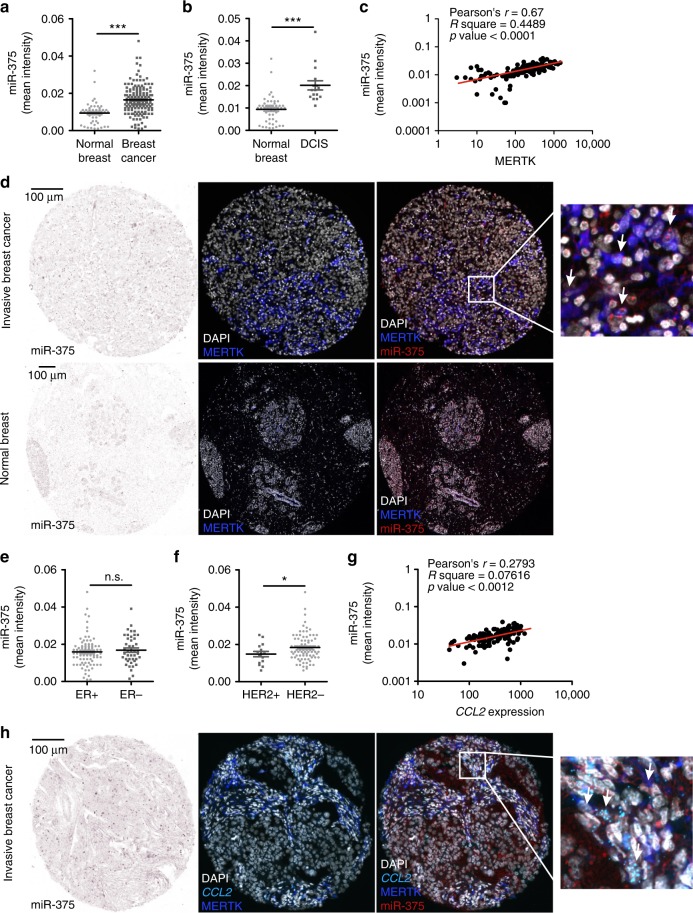
Tumor-immune cell interactions shape the immune cell phenotype, with microRNAs (miRs) being crucial components of this crosstalk. How they are transferred and how they affect their target landscape, especially in tumor-associated macrophages (TAMs), is largely unknown. Here we report that breast cancer cells have a high constitutive expression of miR-375, which is released as a non-exosome entity during apoptosis. Deep sequencing of the miRome pointed to enhanced accumulation of miR-375 in TAMs, facilitated by the uptake of tumor-derived miR-375 via CD36. In macrophages, miR-375 directly targets TNS3 and PXN to enhance macrophage migration and infiltration into tumor spheroids and in tumors of a xenograft mouse model. In tumor cells, miR-375 regulates CCL2 expression to increase recruitment of macrophages. Our study provides evidence for miR transfer from tumor cells to TAMs and identifies miR-375 as a crucial regulator of phagocyte infiltration and the subsequent development of a tumor-promoting microenvironment.


Conflict of interest statement

The authors declare no competing interests.

Figures

Fig. 1
Fig. 1
Coculture with breast cancer cells increases miR-375 in human MΦ. al Human PBMC-derived MΦ were used. a Heatmap of differentially expressed miRs from control and MΦ cocultured with MCF-7 cells (n = 4). b Representative differentially expressed miRs in control MΦ vs. cocultured MΦ and c MA-plot. d MiR-375 abundance was measured in control, 48 h cocultured, polarized (LPS + IFNγ for 24 h, IL-4 for 48 h) and resolution-phase (resolvin D1 for 6 h) MΦ via qPCR, and normalized to untreated MΦ (n ≥ 3). e Primary human MΦ were treated for 3 h with actinomycin D (Act D) or a DMSO control. Cells were washed and cocultured with MCF-7 cells for 24 h. MiR-375 abundance was quantified via qPCR and normalized to MΦ control (n = 8). f PPARgamma mRNA expression was measured as a positive control (n ≥ 5). gj MΦ were transfected with nonspecific control (ns siRNA) or DICER siRNA for 24 h and cocultured with MCF-7 cells for another 48 h (n = 5–6). g DICER mRNA expression in MΦ. h Endogenous miR-21-5p and miR-142-3p were measured by qPCR as a control. i MiR-375 abundance and j pre-miR-375 expression were measured by qPCR in control and cocultured MΦ. k MΦ were cocultured with indicated cell lines for 24 h. MiR-375 levels were measured by qPCR and normalized to MΦ control (n ≥ 5). l MΦ were cocultured with MCF-7 control (empty vector transfected) or decoy (miR-375 decoy transfected) cells for 24 h. MiR-375 expression was measured by qPCR and normalized to MΦ control (n = 27) using different MCF-7 cell passages. Data of b and dI are mean ± SEM and p-values were calculated using two-tailed Student’s t-test (d, f, gk) and one-sample t-test (e, l). *p < 0.05, **p < 0.01, ***p < 0.001; n.s., not significant
Fig. 2
Fig. 2
MΦ uptake of miR-375 as a non-exosome entity. a, b Primary human MΦ were cocultured with MCF-7 cells for 24 h. a One hour before and during the coculture period, MΦ were treated either with vehicle, cytochalasin B, nocodazole, and b carbenoxolone. MiR-375 abundance was quantified via qPCR and normalized to untreated MΦ or untreated coculture MΦ, respectively (n ≥ 3). c MiR-375 was measured by qPCR in the supernatants of MΦ, viable MCF-7 cells (MCF-7), STS-treated apoptotic MCF-7 cells (ap MCF-7), media, and normalized to untreated MΦ. Synthetic cel-miR-39a was used as spike-in control (n ≥ 2). d VCM and ACM of ER+ (EFM-192A, MCF-7, T47D) and ER− (MDA-MB-468, MDA-MB-231, SKBR3, HCC1937) breast carcinoma cells, mammary epithelial cells (MCF-10A), and primary mammary epithelial cells (HMEC) were analyzed for the abundance of miR-375 (n = 3). e MiR-375 level was measured by qPCR in MΦ cocultured with STS-treated apoptotic MCF-7 cells for 4 h. MCF-7 cells were removed from cocultures and MΦ were further cultivated for 20 h (24 h time point). Data are normalized to control MΦ (n = 5). f MΦ were treated with STS as a control, or 1:1 diluted supernatants of viable (VCM) or apoptotic (ACM) MCF-7 cells for 30 min. Cells were washed and further cultured in MΦ media for 4 and 24 h, and miR-375 abundance was measured and normalized to untreated MΦ (n ≥ 5). g ACM was incubated with control or 50 µg/mL RNase A at 37 °C for indicated time. Before RNA isolation, cel-miR-39a was added as a normalization control. MiR-375 abundance was quantified by qPCR and normalized to control ACM (n ≥ 3). h MΦ were incubated for 30 min with either MCF-7 control ACM or RNase A-treated ACM. Cells were washed and cultured for another 24 h in MΦ media. MiR-375 level was determined and normalized to untreated MΦ (n = 5). Data of ah are mean ± SEM and p-values were calculated using one-sample t-test. *p < 0.05, **p < 0.01, ***p < 0.001; n.s., not significant
Fig. 3
Fig. 3
MCF-7 cell-derived miR-375 is taken up by MΦ via CD36. a MCF-7 cell ACM was prepared with (+ FCS) or without (− FCS) FCS, and miR-375 and miR-183-5p abundance was measured by qPCR. Synthetic cel-miR-39a was used as spike-in control for RNA purification efficiency and normalization control (n = 4). b LDL and HDL fractions were separated from ACM (with or without FCS in the media) and analyzed for the abundance of miR-375 and miR-183-5p by qPCR (n = 3). c, d MΦ were pre-incubated with IgG control or anti-CD36 blocking mAb for 1 h and during the whole experiment. c MΦ were treated with ACM for 30 min. Cells were washed and further cultured in MΦ media for 24 h. MiR-375 abundance was measured by qPCR and normalized to untreated control MΦ (n = 7). d MΦ were cocultured with MCF-7 cells for 24 h and miR-375 abundance was measured via qPCR, and normalized to untreated control MΦ (n = 4). e MΦ were treated with MCF-7 ACM alone or together with a CD36-blocking peptide for 30 min. The peptide was added 1 h before ACM treatment. Afterwards, cells were washed and further cultured in MΦ media alone or together with the peptide for 24 h. miR-375 level was measured by qPCR and normalized to untreated control MΦ (n = 8). f, g MΦ were transfected with control (nonspecific siRNA) or CD36 siRNA for 24 h and cocultured with MCF-7 cells for another 24 h. f CD36 mRNA expression and g miR-375 levels were measured by qPCR (n = 6). Data of ag are mean ± SEM and p-values were calculated using two-tailed Student’s t-test (a, b, f, g) and one-sample t-test (ce); *p < 0.05, **p < 0.01, n.s., not significant
Fig. 4
Fig. 4
MiR-375 enhances monocyte and MΦ migration. a MCF-7 control or decoy VCM/ACM was analyzed for chemokine concentrations by CBA (n = 3). b 2 × 106 CD14+ monocytes were added onto transwell inserts and allowed to migrate toward empty vector-transfected (control) or miR-375 decoy-transfected (decoy) MCF-7 VCM/ACM for 2 h. The number of migrated cells in the lower chamber was calculated (n = 6). c Primary human MΦ were treated with MCF-7 control or decoy VCM/ACM for 30 min. Cells were washed and fresh MΦ media was added for 24 h. Scratches were generated with a small pipette tip in a marked area. Pictures were taken at 0 and 24 h, and the cell free area within the scratch was measured using the ImageJ software. Percentage gap closure after 24 h was calculated with respect to gap area at 0 h and normalized to untreated MΦ control (MΦ control = 0%; n = 10). Data of ac are mean ± SEM and p-values were calculated using two-tailed Student’s t-test (a, b) and two-way ANOVA with Bonferroni’s correction (c). *p < 0.05, **p < 0.01, ***p < 0.001
Fig. 5
Fig. 5
PXN and TNS3 are direct targets of miR-375 in human MΦ. a, c MΦ were transfected with synthetic miR-375 mimic or cel-miR-39a control (scramble) for 72 h. a mRNA and protein expression of PXN and TNS3 was determined. Data are normalized to transfection controls for mRNA and nucleolin for protein (n ≥ 3). b Relative PXN and TNS3 mRNA and protein expression in ACM-treated MΦ were normalized to control MΦ or nucleolin, respectively (n ≥ 4). c mRNA stability of PXN and TNS3 was measured. MΦ were treated with actinomycin D for 0–8 h. PXN and TNS3 mRNA contents at the time of adding actinomycin D was set to 100%. PXN and TNS3 mRNA expression in control-transfected MΦ (gray circle) and miR-375-overexpressing MΦ (black square) was measured at indicated time by qPCR (n ≥ 5). mRNA half-life (t1/2) was calculated by exponential regression curve. d MΦ were transfected with 2 µg PXN or TNS3 3′-UTR reporter plasmids or empty control vector with or without synthetic miR-375 mimic for 48 h. Binding of miR-375 to its target genes was analyzed as the ratio of renilla luciferase activity to firefly luciferase activity (n = 4). eg Primary human MΦ were transfected with control or PXN and TNS3 siRNA for 24 h. After 24 h, e MΦ were collected and PXN and TNS3 expression was analyzed by qPCR or f, g treated with MCF-7 control or decoy ACM for 30 min. Cells were washed and fresh MΦ media was added for 24 h. Scratches were generated with a small pipette tip in a marked area. Pictures were taken at 0 and 24 h, and the cell-free area within the scratch was measured for percental gap closure normalized to untreated MΦ control (MΦ control = 0%) using ImageJ software (n ≥ 5). Data of af are mean ± SEM and p-values were calculated using one-sample t-test (a, b, d, e) and two-way ANOVA with Bonferroni’s correction (f). *p < 0.05, **p < 0.01, ***p < 0.001; n.s., not significant
Fig. 6
Fig. 6
MiR-375 target site blockers for PXN and TNS3 activity. a Schematic overview of LNA-enhanced target site blocker (TSB) mode of action. Without TSBs, miR/RISC complex binds to the 3′-UTR of target mRNAs, thereby attenuating mRNA expression. b, c MΦ were transfected with synthetic miR-375 mimic in the presence of scramble TSBs or PXN- and TNS3-specific miR-375 TSBs for 72 h. b PXN and TNS3 mRNA expression was measured by qPCR (n = 4). c Relative protein expression of PXN and TNS3 in MΦ. Expression was normalized to nucleolin (n = 6). dg MΦ were transfected with scramble TSBs or PXN- and TNS3-specific miR-375 TSBs for 24 h. Afterwards, MΦ were treated with MCF-7 ACM for 30 min. Cells were washed and fresh MΦ media was added for another 24 h. d PXN and TNS3 mRNA expression was measured by qPCR (n = 4). e Protein expression of PXN and TNS3 in MΦ relative to nucleolin (n = 6). f Scratches were generated with a small pipette tip in a marked area. Pictures were taken at 0 and 24 h, and the cell-free area within the scratch was measured using ImageJ software. g Percentage gap closure after 24 h was calculated with respect to gap area at 0 h and normalized to scramble TSB transfected MΦ (control = 0%) (n = 6). Data are mean ± SEM and p-values were calculated using one-sample t-test (be) and two-way ANOVA with Bonferroni’s correction (g). *p < 0.05, **p < 0.01, ***p < 0.001, n.s., not significant
Fig. 7
Fig. 7
Tumor-derived miR-375 is required for MΦ infiltration in 3D tumor spheroids. a Schematic picture of the experimental design. Pictures were taken 3 days after coculture and are representative for 19 different experiments. b, c Cocultures were collected and non-infiltrating cells were removed. Single-cell suspensions of infiltrated spheroids were analyzed via polychromatic flow cytometry for b the number of MCF-7 cells and MΦ in tumor spheroids, and c the number of apoptotic cells. Cell numbers were calculated based on counting beads and normalized to control MCF-7 spheroids (n = 19). d Supernatants of cocultures were collected and chemokine concentrations were quantified by CBA (n = 7). e, f Cocultures were collected and MΦ were separated from MCF-7 cells via CD14 microbeads followed by analysis of e miR-375 abundance in both cell fractions and f PXN and TNS3 mRNA expressions in MΦ by qPCR and normalized to control MCF-7 (n ≥ 4). g CD14+ monocytes were stained with eFluor670 just before spheroid infiltration. Cocultures were harvested and imaged by light-sheet microscopy (× 6.3 magnification). Spheroids were analyzed for the volumes of MCF-7 cells (red) and MΦ (white), and normalized to control MCF-7 (n = 10 with more than 3 individual spheroids per group with 10 independent monocyte preparations). Data are mean ± SEM and p-values were calculated using one-sample t-test (b, c, eg) and two-way ANOVA with Bonferroni’s correction (d). *p < 0.05, **p < 0.01, ***p < 0.001; n.s., not significant
Fig. 8
Fig. 8
Tumor-derived miR-375 is taken up by monocytes/MΦ and facilitates their infiltration. ae 1 × 107 MCF-7 control or decoy cells were injected subcutaneously in the right and left flank of female NMRI-Foxn1nu mice, which were pre-treated with 17β-estradiol pellets for 1 week. After 35 days or a maximum tumor volume of 1.5 cm3 tumors were collected for flow cytometry and cell sorting. a Experimental scheme. b The tumor growth was monitored by measuring tumor volume (n = 5-6 per group). c Tumors were analyzed for the number of infiltrating MΦ and monocytes by flow cytometry as the number of cells in 100 mg tumor (n ≥ 5). d, e Infiltrating murine MΦ were sorted out of MCF-7 tumors and analyzed for the miR-375 content d and Pxn and Tns3 expression e by qPCR (n = 6). f C57BL/6 mice bone marrow-derived MΦ were cocultured for 48 h with E0771 murine breast cancer cells and Pxn and Tns3 mRNA expression was analyzed in MΦ (n = 6). g E0771 cells were stably transfected with miR-375 decoy (decoy) or empty vector (control) and miR-375 content was measured by qPCR (n = 7). hk 50,000 E0771 control or decoy cells were injected in mammary gland 3 and 8 of 8-week-old female C57BL/6 mice. After 14 days, blood, bone marrow, spleen, and tumors were collected for flow cytometry and cell sorting. h Experimental scheme. i Single-cell suspensions of tumors were analyzed for the number of infiltrating MΦ and monocytes as the number of cells in 100 mg tumor. RNA from j plasma as well as k monocytes and MΦ from blood, bone marrow, spleen, and tumors were analyzed by qPCR for the abundance of miR-375 (n = 4–5 per group). Data are means ± SEM. P-values of ik were calculated using nonparametric two-tailed Student’s t-test (b), two-tailed Student’s t-test (ce, ik) and one-sample t-test (f, g). *p < 0.05, **p< 0.01, ***p < 0.001
Fig. 9
Fig. 9
miR-375 in human invasive breast carcinoma. Human invasive mammary carcinoma tissue microarrays sections were analyzed for miR-375 abundance and CCL2 mRNA expression by in situ hybridization (light blue), followed by staining of nuclei with DAPI (white) and MERTK protein (blue). Bright-field signal of miR-375 was converted to fluorescence image using Inform 2.4.0 and ImageJ software, to present colocalization of miR-375, MERTK, and CCL2 from two consecutive sections. a Mean signal intensity of miR-375 in human invasive breast cancer (breast cancer) sections compared with normal breast tissue sections is shown (n = 156 breast tumors; n = 49 normal breasts). b Mean intensity of miR-375 in human ductal carcinoma in situ (DCIS) sections compared with normal breast tissue sections is shown (n = 16 DCIS tumors; n = 49 normal breasts). c Correlation between miR-375 mean intensity and MERTK expression in invasive breast tumor sections (n = 155). d Representative pictures of invasive breast cancer section and normal breast with arrowheads in magnification showing miR-375 (red) colocalization with MERTK (blue). e Mean intensity of miR-375 in ER + and ER − invasive breast tumor sections (n = 96 ER + and n = 43 ER − sections). f Mean miR-375 intensity of HER2 + and HER2 − invasive breast tumor sections (n = 16 HER2 + and n = 89 HER2 − sections). g Correlation between miR-375 mean intensity and CCL2 mRNA expression in invasive breast tumor sections (n = 155). h Representative pictures of invasive breast cancer section and normal breast with arrowheads in magnification showing miR-375 (red) colocalization with MERTK (blue) and CCL2 (light blue). Data are mean ± SEM and p-values were calculated using two-tailed Student’s t-test. *p < 0.05, ***p < 0.001, n.s., not significant

Similar articles

Cited by

References

    1. Bingle L, Brown NJ, Lewis CE. The role of tumour-associated macrophages in tumour progression. Implications for new anticancer therapies. J. Pathol. 2002;196:254–265. doi: 10.1002/path.1027. - DOI - PubMed
    1. Mantovani A, Marchesi F, Malesci A, Laghi L, Allavena P. Tumour-associated macrophages as treatment targets in oncology. Nat. Rev. Clin. Oncol. 2017;14:399–416. doi: 10.1038/nrclinonc.2016.217. - DOI - PMC - PubMed
    1. Noy R, Pollard JW. Tumor-associated macrophages. Mech. Ther. Immun. 2014;41:49–61. - PMC - PubMed
    1. Weigert A, Mora J, Sekar D, Syed S, Brüne B. Killing is not enough: how apoptosis hijacks tumor-associated macrophages to promote cancer progression. Adv. Exp. Med. Biol. 2016;930:205–239. doi: 10.1007/978-3-319-39406-0_9. - DOI - PubMed
    1. Pollard JW. Tumour-educated macrophages promote tumour progression and metastasis. Nat. Rev. Cancer. 2004;4:71–78. doi: 10.1038/nrc1256. - DOI - PubMed

Publication types

MeSH terms