. 2019 Mar 8;10(1):1129.
doi: 10.1038/s41467-019-08988-3.

Neurotrophin receptor tyrosine kinases regulated with near-infrared light

Affiliations

Neurotrophin receptor tyrosine kinases regulated with near-infrared light

Anna V Leopold et al. Nat Commun. .

Abstract

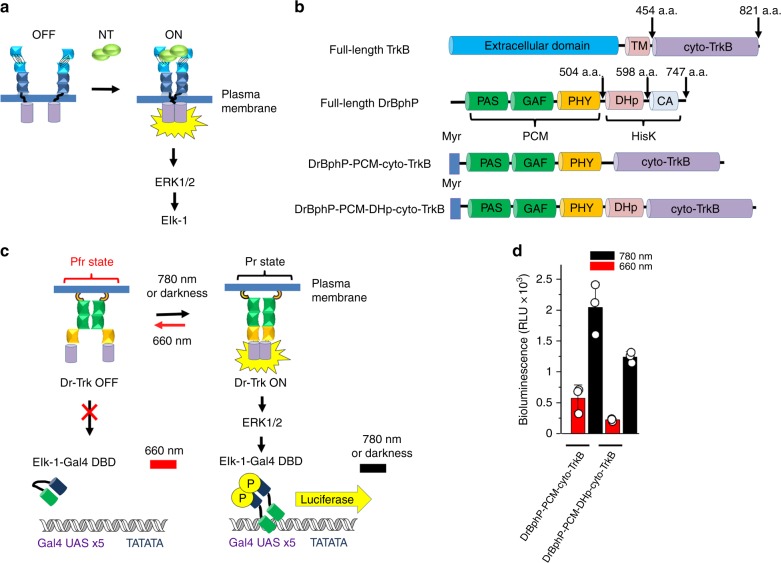
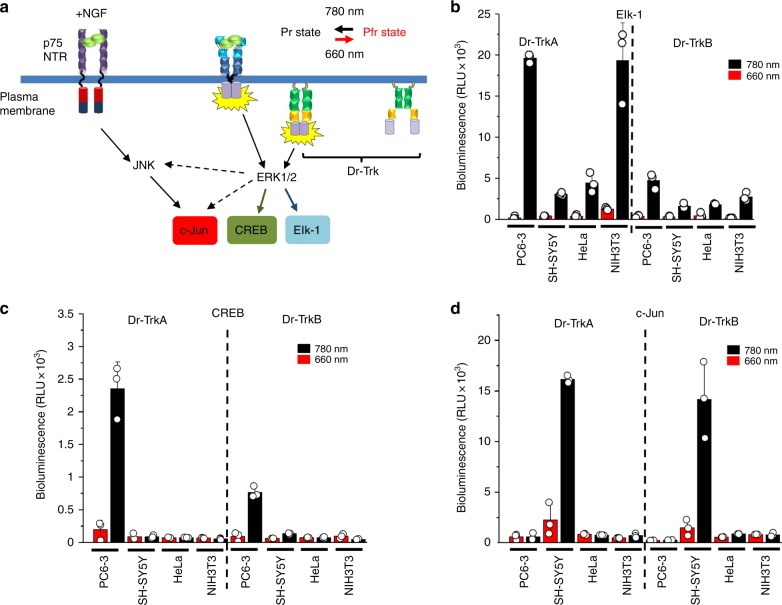
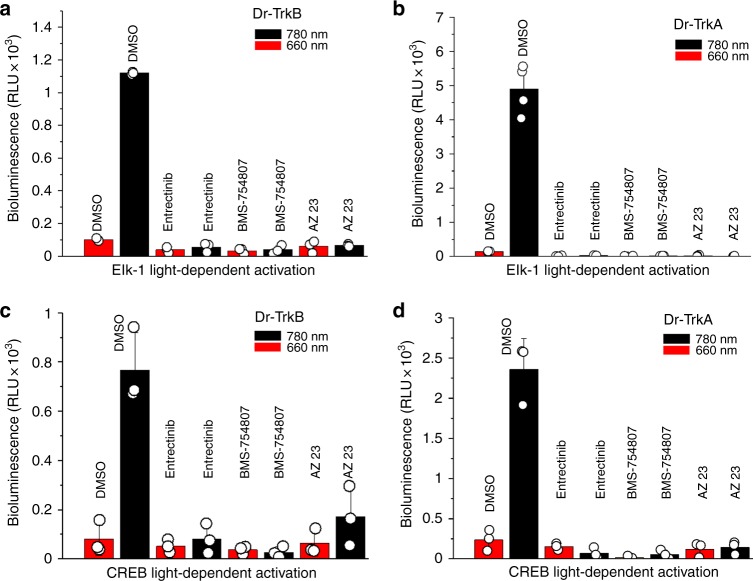
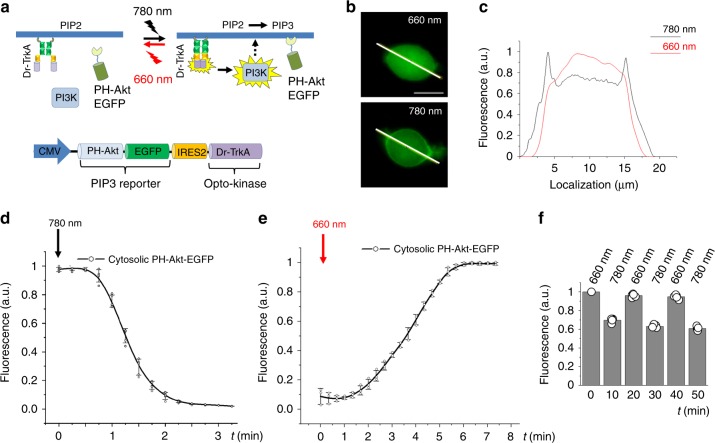
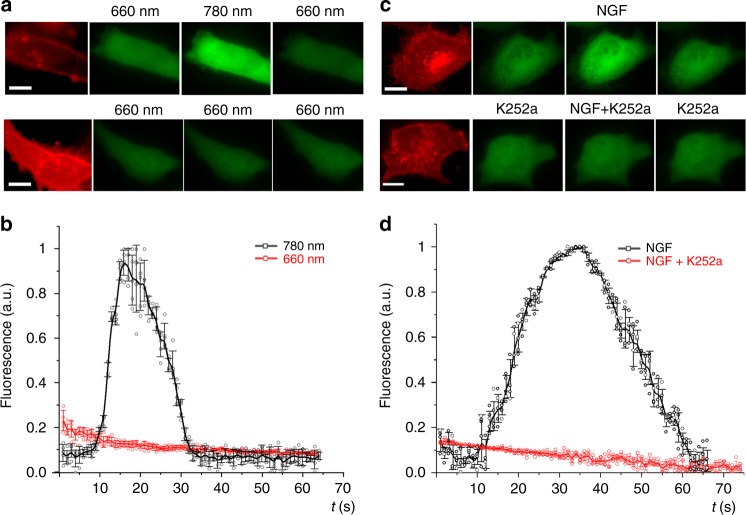
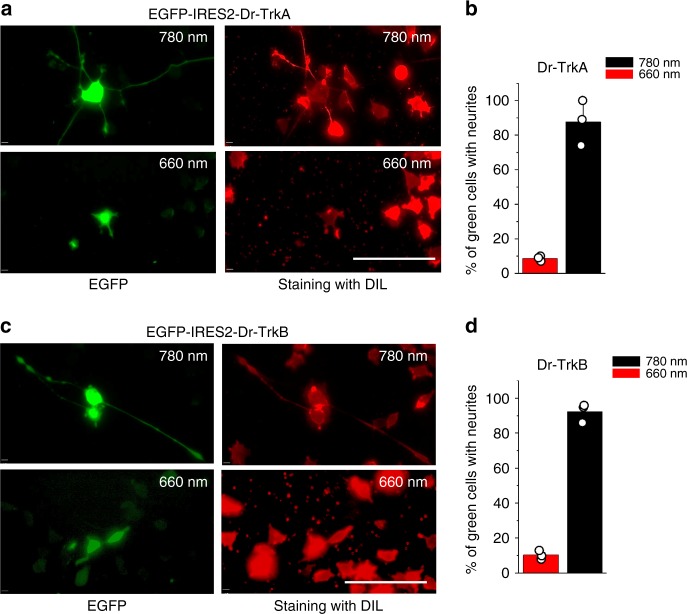
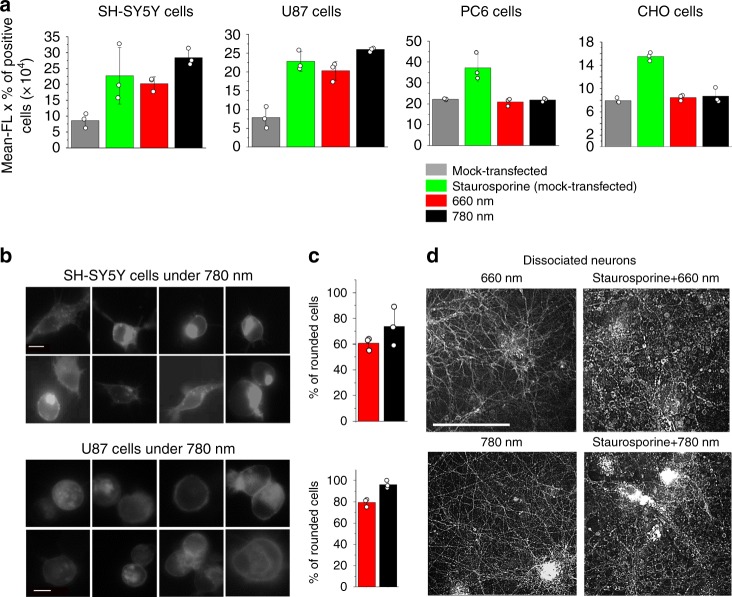
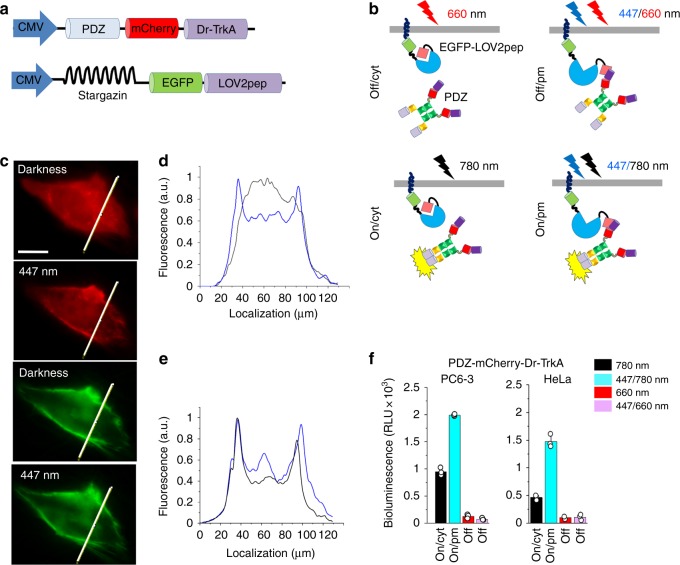
Optical control over the activity of receptor tyrosine kinases (RTKs) provides an efficient way to reversibly and non-invasively map their functions. We combined catalytic domains of Trk (tropomyosin receptor kinase) family of RTKs, naturally activated by neurotrophins, with photosensory core module of DrBphP bacterial phytochrome to develop opto-kinases, termed Dr-TrkA and Dr-TrkB, reversibly switchable on and off with near-infrared and far-red light. We validated Dr-Trk ability to reversibly light-control several RTK pathways, calcium level, and demonstrated that their activation triggers canonical Trk signaling. Dr-TrkA induced apoptosis in neuroblastoma and glioblastoma, but not in other cell types. Absence of spectral crosstalk between Dr-Trks and blue-light-activatable LOV-domain-based translocation system enabled intracellular targeting of Dr-TrkA independently of its activation, additionally modulating Trk signaling. Dr-Trks have several superior characteristics that make them the opto-kinases of choice for regulation of RTK signaling: high activation range, fast and reversible photoswitching, and multiplexing with visible-light-controllable optogenetic tools.


Conflict of interest statement

The authors declare no competing interests.

Figures

Fig. 1
Fig. 1
Design and initial screening of DrBphP-PCM kinase fusions. a Activation of receptor tyrosine kinases (RTKs) by dimerization upon binding of a growth factor ligand. b Schematically depicted structures of the full-length TrkB, DrBphP, and developed for initial screening DrBphP-PCM-cyto-Trk fusion constructs. c Scheme of luciferase assay for kinase activity. The system consists of the reporter plasmid, pFR-Luc, where firefly luciferase expression is controlled with the synthetic promoter, containing 5× tandem repeats of the yeast UAS GAL4 binding sites, and the transactivator plasmid pFA-Elk-1. In the transactivator plasmid, the activation domain of the Elk-1 is fused with the yeast GAL4 DNA binding domain (DBD). Under 780 nm light, DrBphP-PCM-cyto-Trk is active, which results in the activation of the MAPK/ERK pathway. The phosphorylated Elk-1-GAL4-DBD fusion dimerizes, binds to 5× UAS, and activates transcription of firefly luciferase. Under 660 nm light, DrBphP-PCM-cyto-Trk is inactive, MAPK/ERK pathway (mitogen-activated protein kinase/extracellular signal-regulated kinase) is inhibited, and luciferase expression is switched OFF. d Luciferase assay of initial DrBphP-PCM-cyto-Trk constructs in PC6-3 cells. PC6-3 cells were co-transfected with the pCMVd2-DrBphP-PCM-cyto-Trk, pFR-Luc, and pFA-Elk-1 plasmid mixture (1:100:5), and 6 h after transfection, culture medium was replaced with serum-starving one. Cells were grown for additional 30 h under 780 nm or 660 nm light (both 0.5 mW cm−2), lysed, and analyzed for luciferase activity. Error bars represent s.d., n = 3 experiments
Fig. 2
Fig. 2
Light-dependent activation of Elk-1, CREB, and c-Jun in various cell lines. a The scheme of the activation of Elk-1, CREB, and c-Jun transcription factors upon activation of the receptor tyrosine kinases (RTKs) and Dr-Trks. b Luciferase assay for Elk-1-dependent transcription in various cell lines. PC6-3, HeLa, SH-SY5Y, and NIH3T3 cells were plated in 24-well plate and incubated with the pCMVd2-Dr-Trk, pFR-Luc, and pFA-Elk-1 plasmid mixture (mass ratio 1:100:5 for PC6-3 or 1:100:1 for other cell lines) for 6 h. Medium then was replaced with serum-starving one, cells were grown for additional 30 h under 780 nm or 660 nm light (both 0.5 mW cm−2), lysed, and analyzed for luciferase activity. c Luciferase assay for CREB-dependent transcription. The indicated cell lines were co-transfected with the pCMVd2-Dr-Trk, pFR-Luc, and pFA-CREB plasmid mixture (mass ratio 1:100:5 for PC6-3 or 1:100:1 for other cell lines), grown for 30 h under 780 nm or 660 nm light (both 0.5 mW cm−2), lysed, and analyzed for luciferase activity. d Luciferase assay for c-Jun-dependent transcription. Cells were co-transfected with the pCMVd2-Dr-Trk, pFR-Luc, and pFA-c-Jun plasmid mixture (mass ratio 1:100:5 for PC6-3 cells or 1:100:1 for other cell lines), grown as above, and analyzed for luciferase activity. Error bars represent s.d., n = 3 experiments
Fig. 3
Fig. 3
Downregulation of Dr-Trk activity with FR light and kinase inhibitors. a Luciferase assay for Elk-1-dependent transcription in PC6-3 cells co-transfected with pCMVd2-Dr-TrkB, pFR-Luc, and pFA-Elk-1 plasmid mixture (1:100:5) and grown for 30 h under 660 nm or 780 nm light (both 0.5 mW cm−2). The indicated kinase inhibitors (100 nM) or dimethyl sulfoxide (DMSO) solvent (0.1%) were added to the culture medium. b Luciferase assay for Elk-1-dependent transcription in PC6-3 cells co-transfected with pCMVd2-Dr-TrkA, pFR-Luc, and pFA-Elk-1 plasmid mixture and grown under 660 nm or 780 nm light. c Luciferase assay for CREB-dependent transcription in PC6-3 cells co-transfected with pCMVd2-Dr-TrkB, pFR-Luc, and pFA-CREB plasmid and grown under 660 nm or 780 nm light in the presence of kinase inhibitors. d Luciferase assay for CREB-dependent transcription in PC6-3 cells co-transfected with pCMVd2-Dr-TrkA, pFR-Luc, and pFA-CREB plasmid mixture and grown under 660 nm or 780 nm light in the presence of kinase inhibitors. Error bars represent s.d., n = 3 experiments
Fig. 4
Fig. 4
Light-dependent translocation of PH-Akt-EGFP reporter in PC6-3 cells. a Top: Dr-TrkA is inactive in cells kept under 660 nm light. The 780 nm light causes activation of the Dr-TrkA and downstream phosphatidylinositol triphosphate (PIP3) kinase. This results in accumulation of PIP3 in the plasma membrane and recruiting of PH-Akt-EGFP reporter from the cytoplasm. Bottom: Schematic drawing of the bicistronic pPH-Akt-EGFP-IRES2-Dr-TrkA plasmid co-expressing PH-Akt-EGFP and Dr-TrkA. b Top: Epifluorescence image of the PC6-3 cell transfected with the bicistronic plasmid and kept under 660 nm light. Bottom: Epifluorescence image of the PC6-3 cell kept under 780 nm light for 10 min to reach steady-state Akt transition to the plasma membrane. Scale bar, 10 μm. c Steady-state intensity profile of PH-EGFP-Akt fluorescence of the PC6-3 cell kept under 660 nm light (red line) and illuminated by 780 nm light for 10 min (black line). d Relative decrease of cytoplasmic PH-Akt-EGFP fluorescence induced by 780 nm light (0.5 mW cm−2). e Relative increase of cytoplasmic PH-Akt-EGFP fluorescence induced by 660 nm light (0.5 mW cm−2). f Reversible translocation of the PH-Akt-EGFP reporter between the plasma membrane and cytoplasm in response to 780 nm and 660 nm illumination. Error bars represent s.d., n = 3 experiments
Fig. 5
Fig. 5
Activation of calcium signaling by Dr-TrkA. a Images of HeLa cells co-expressing mCherry-Dr-TrkA and GCaMP6m. Upper row: cells under constant 660 nm light (0.5 mW cm−2) were stimulated with 20 s pulse of 780 nm light (0.5 mW cm−2). Bottom row: the same cells under constant 660 nm light (0.5 mW cm−2). Note the decrease of cellular calcium in the last images. Scale bar, 10 μm. b Changes of GCaMP6m fluorescence for Dr-TrkA-expressing cells either stimulated by 780 nm light for 20 s (black line) or kept under 660 nm light (red line). c Images of HeLa cells co-expressing TrkA-DsRed2 and GCaMP6m. Upper row: cells before and after addition of 50 ng ml−1 nerve growth factor (NGF). Bottom row: cells stimulated with NGF in the presence of 100 nM of K252a. Note the decrease of cellular calcium in the last images. Scale bar, 10 μm. d Changes of GCaMP6m fluorescence upon stimulation of the cells with NGF in the absence (black line) or presence of K252a (red line). Error bars represent s.d., n = 3 experiments
Fig. 6
Fig. 6
Light-dependent neurite outgrowth in PC6-3 cells. a Epifluorescence images of PC6-3 cells transfected with the pEGFP-IRES2-Dr-TrkA plasmid kept for 72 h under either 780 nm (upper panels) or 660 nm (lower panels) light. Before imaging, the cells were fixed and stained with a Dil reagent. Fluorescence images were taken in EGFP (left) and Dil (right) channels. b Quantification of cells bearing neurites from the total number of 50 cells transfected with the pEGFP-IRES2-Dr-TrkA plasmid. c Epifluorescence images of PC6-3 cells transfected with pEGFP-IRES2-Dr-TrkB plasmid kept for 72 h under either 780 nm (upper panels) or 660 nm (lower panels) light. Before imaging, cells were fixed and stained with a Dil reagent. Fluorescence images were taken in EGFP (left) and Dil (right) channels. d Quantification of the cells bearing neurites from the total number of 50 cells transfected with the pEGFP-IRES2-Dr-TrkB plasmid. Error bars represent s.d., n = 3 experiments. Scale bar, 100 µm
Fig. 7
Fig. 7
Regulation of apoptosis in neuroblastoma and glioblastoma by Dr-TrkA. a SH-S5Y5, U87, PC6-3, and CHO cells were co-transfected in 48-well plate with 250 ng mixture of the pCMVd2-mCherry-Dr-TrkA and pcDNA3.1 plasmids in the 1:1 mass ratio. The transfected cells were illuminated with either 660 nm or 780 nm light for 6 h, stained with annexin V, and analyzed using flow cytometry. As a positive control, cells transfected with pcDNA3.1 only (mock-transfected cells) were treated with 100 nM staurosporine. b Epifluorescence images of SH-SY5Y and U87 cells transfected with mCherry-Dr-TrkA illuminated with near-infrared (NIR) light, Scale bar, 10 μm. c Quantification of the rounded cells under either 660 nm or 780 nm light. Error bars represent s.d., n = 3 experiments. d Epifluorescence images of cultured rat cortical neurons transduced with adeno-associated virus serotype 9 (AAV9) encoding mCherry-Dr-TrkA. At 24 h after the transduction, neurons were illuminated for 6 h with either 660 nm or 780 nm light. As a positive control, the transduced neurons were treated with 100 nM staurosporine for 6 h. Scale bar, 100 μm. Error bars represent s.d., n = 3 experiments
Fig. 8
Fig. 8
Regulation of Dr-TrkA activity with FR–NIR and localization with blue light. a Scheme of cytoplasmic PDZ-Cherry-TrkA and membrane-anchored stargazin-EGFP-LOV2pep constructs used for targeting of Dr-TrkA to the plasma membrane with blue light. b Translocation of the PDZ-mCherry-Dr-TrkA from the cytoplasm to the plasma membrane upon illumination with blue light and activation of the kinase with 780 nm light. c Top: Representative epifluorescence images of the HeLa cell in mCherry channel co-expressing PDZ-mCherry-TrkA and stargazin-EGFP-LOV2pep before and after 30 s of 447 nm illumination (0.3 mW cm−2). Bottom: Representative epifluorescence images of the same HeLa cell in EGFP channel. Scale bar, 10 μm. d, e The intensity profiles of the HeLa cells co-expressing PDZ-Cherry-TrkA and stargazin-EGFP-LOV2pep constructs kept in darkness (black line) or after 30 s of 447 nm light (0.3 mW cm−2) (blue line) imaged in mCherry channel (d) and EGFP channel (e). f Luciferase assay for Elk-1-dependent transcription in PC6-3 cells co-transfected with pPDZ-Cherry-Dr-TrkA, pStargazin-EGFP-LOV2pep, pFr-Luc, and pFA-Elk-1 plasmids. Cells were kept for 30 h under 780 nm light (0.3 mW cm−2), alternating 30 s pulses of 780 nm light (0.3 mW cm−2) and 447 nm light (0.3 mW cm−2), 660 nm light (0.3 mW cm−2) or alternating 30 s pulses of 660 nm light (0.3 mW cm−2) and 447 nm light (0.3 mW cm−2). After illumination cells were lysed and analyzed for luciferase activity. Error bars represent s.d., n = 3 experiments
Fig. 9
Fig. 9
Light-induced activation of MAPK/ERK pathway in mice. a PC6-3 cells were co-transfected with pCMVd2-Dr-TrkA, pFA-Elk-1, and pFR-RLuc8 plasmids and injected 25 h later in mammary glands of female mice. Mice were kept in transparent cages and illuminated from below with either 660/25 nm or 780/25 nm LED arrays at 3 mW cm−2 for 19 h. Then, animals were injected with a coelenterazine substrate for RLuc8 luciferase through retro-orbital vein and immediately imaged with an IVIS Spectrum instrument. b Quantification of the RLuc8 reporter signals shown in a. Error bars represent s.d., n = 3 experiments

References

    1. Cravatt BF. Kinase chemical genomics--a new rule for the exceptions. Nat. Methods. 2005;2:411–412. - PubMed
    1. Leopold AV, Chernov KG, Verkhusha VV. Optogenetically controlled protein kinases for regulation of cellular signaling. Chem. Soc. Rev. 2018;47:2454–2484. - PMC - PubMed
    1. Chang KY, et al. Light-inducible receptor tyrosine kinases that regulate neurotrophin signalling. Nat. Commun. 2014;5:4057. - PubMed
    1. Grusch M, et al. Spatio-temporally precise activation of engineered receptor tyrosine kinases by light. EMBO J. 2014;33:1713–1726. - PMC - PubMed
    1. Kainrath S, Stadler M, Reichhart E, Distel M, Janovjak H. Green-light-induced inactivation of receptor signaling using cobalamin-binding domains. Angew. Chem. Int. Ed. Engl. 2017;56:4608–4611. - PMC - PubMed

Publication types

MeSH terms