

Forming global estimates of self-performance from local confidence
- PMID: 30850612
- PMCID: PMC6408496
- DOI: 10.1038/s41467-019-09075-3
Forming global estimates of self-performance from local confidence
Abstract
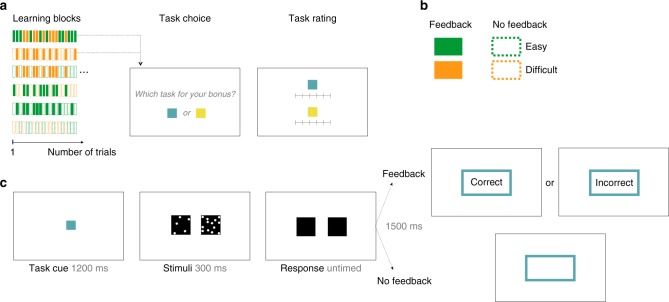
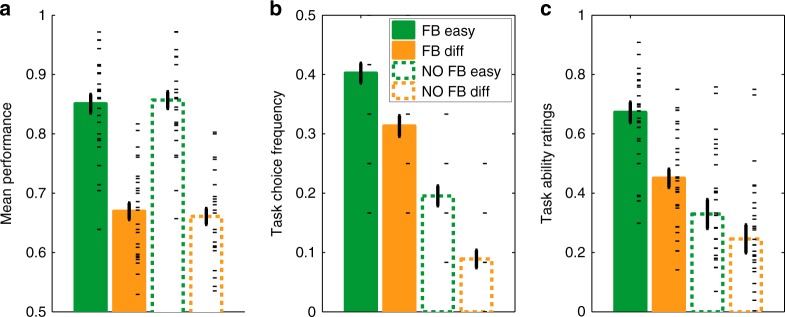
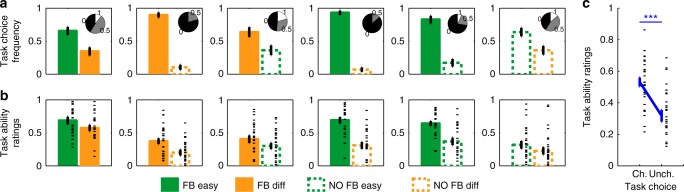
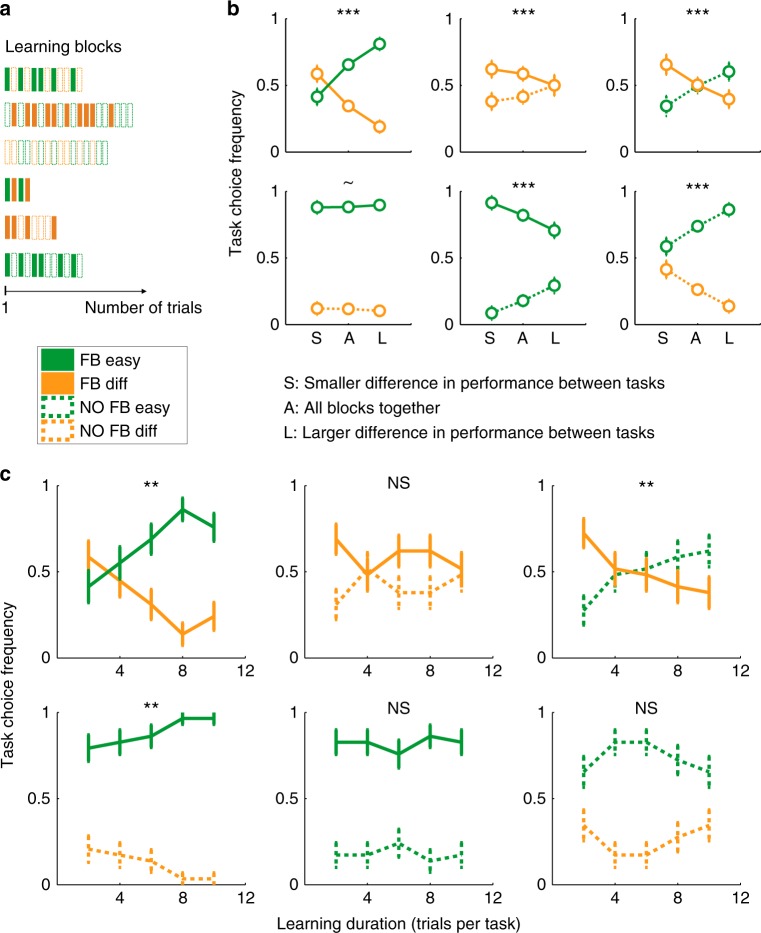
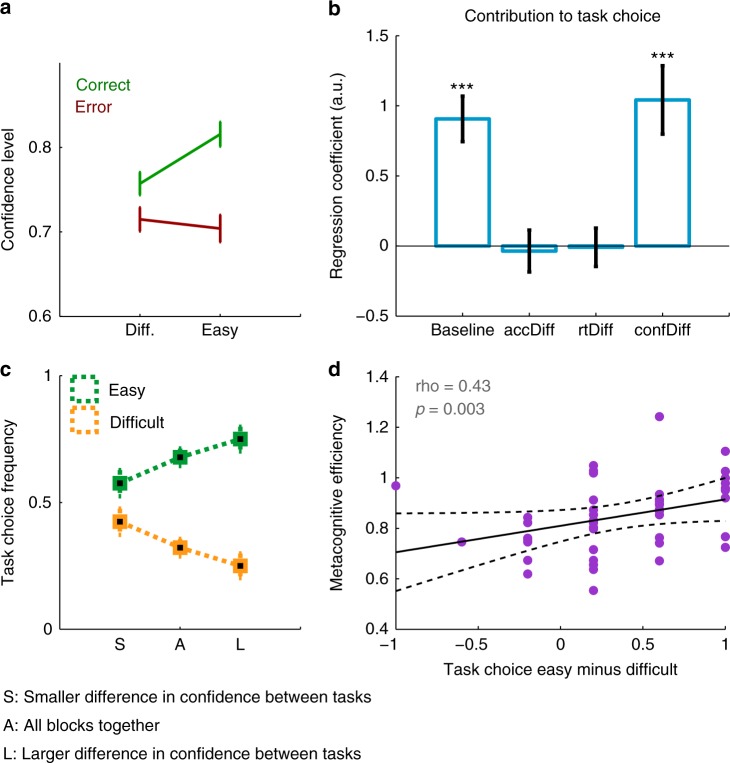
Metacognition, the ability to internally evaluate our own cognitive performance, is particularly useful since many real-life decisions lack immediate feedback. While most previous studies have focused on the construction of confidence at the level of single decisions, little is known about the formation of "global" self-performance estimates (SPEs) aggregated from multiple decisions. Here, we compare the formation of SPEs in the presence and absence of feedback, testing a hypothesis that local decision confidence supports the formation of SPEs when feedback is unavailable. We reveal that humans pervasively underestimate their performance in the absence of feedback, compared to a condition with full feedback, despite objective performance being unaffected. We find that fluctuations in confidence contribute to global SPEs over and above objective accuracy and reaction times. Our findings create a bridge between a computation of local confidence and global SPEs, and support a functional role for confidence in higher-order behavioral control.
Conflict of interest statement
The authors declare no competing interests.
Figures
Similar articles
-
Formation of global self-beliefs in the human brain.Proc Natl Acad Sci U S A. 2020 Nov 3;117(44):27268-27276. doi: 10.1073/pnas.2003094117. Epub 2020 Oct 15. Proc Natl Acad Sci U S A. 2020. PMID: 33060292 Free PMC article.
-
Altering movement parameters disrupts metacognitive accuracy.Conscious Cogn. 2018 Jan;57:33-40. doi: 10.1016/j.concog.2017.11.005. Epub 2017 Nov 21. Conscious Cogn. 2018. PMID: 29169032
-
Sure I'm Sure: Prefrontal Oscillations Support Metacognitive Monitoring of Decision Making.J Neurosci. 2017 Jan 25;37(4):781-789. doi: 10.1523/JNEUROSCI.1612-16.2016. J Neurosci. 2017. PMID: 28123015 Free PMC article.
-
Confidence in Context: Perceived Accuracy of Quantitative Estimates Decreases With Repeated Trials.Psychol Sci. 2020 Aug;31(8):927-943. doi: 10.1177/0956797620921517. Epub 2020 Jul 6. Psychol Sci. 2020. PMID: 32631138
-
Visual Confidence.Annu Rev Vis Sci. 2016 Oct 14;2:459-481. doi: 10.1146/annurev-vision-111815-114630. Epub 2016 Aug 3. Annu Rev Vis Sci. 2016. PMID: 28532359 Review.
Cited by
-
Multitasking costs on metacognition in a triple-task paradigm.Psychon Bull Rev. 2021 Dec;28(6):2075-2084. doi: 10.3758/s13423-021-01967-0. Epub 2021 Jun 25. Psychon Bull Rev. 2021. PMID: 34173189
-
Atypical meta-memory evaluation strategy in schizophrenia patients.Schizophr Res Cogn. 2021 Oct 6;27:100220. doi: 10.1016/j.scog.2021.100220. eCollection 2022 Mar. Schizophr Res Cogn. 2021. PMID: 34646754 Free PMC article.
-
Children's subjective uncertainty-driven sampling behaviour.R Soc Open Sci. 2024 Apr 24;11(4):231283. doi: 10.1098/rsos.231283. eCollection 2024 Apr. R Soc Open Sci. 2024. PMID: 38660597 Free PMC article.
-
Age-related decreases in global metacognition are independent of local metacognition and task performance.Cognition. 2023 Jun;235:105389. doi: 10.1016/j.cognition.2023.105389. Epub 2023 Feb 9. Cognition. 2023. PMID: 36764048 Free PMC article.
-
Overlapping yet dissociable contributions of superiority illusion features to Ponzo illusion strength and metacognitive performance.BMC Psychol. 2024 Mar 1;12(1):108. doi: 10.1186/s40359-024-01625-9. BMC Psychol. 2024. PMID: 38429795 Free PMC article.
References
-
- Elwin E, Juslin P, Olsson H, Enkvist T. Constructivist coding: learning from selective feedback. Psychol. Sci. 2007;18:105–110. - PubMed
-
- Henriksson MP, Elwin E, Juslin P. What is coded into memory in the absence of outcome feedback? J. Exp. Psychol.: Learn., Mem., Cogn. 2010;36:1. - PubMed
-
- Kepecs A, Uchida N, Zariwala HA, Mainen ZF. Neural correlates, computation and behavioural impact of decision confidence. Nature. 2008;455:227–231. - PubMed
Publication types
MeSH terms
Grants and funding
LinkOut - more resources
Full Text Sources
Other Literature Sources
