. 2019 Mar 8;9(1):4004.
doi: 10.1038/s41598-019-40500-1.

Limits of Babinet's principle for solid and hollow plasmonic antennas

Affiliations

Limits of Babinet's principle for solid and hollow plasmonic antennas

M Horák et al. Sci Rep. .

Abstract

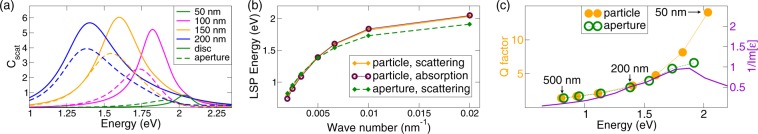
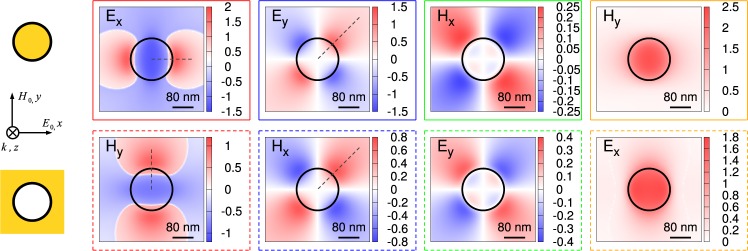
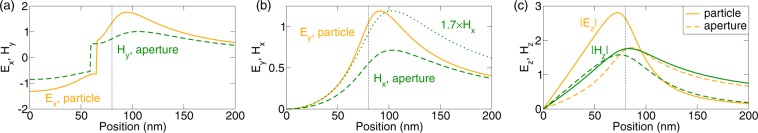
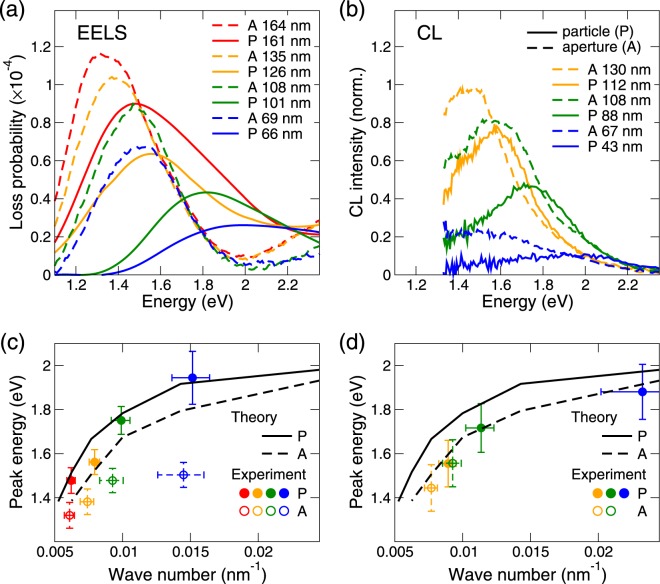
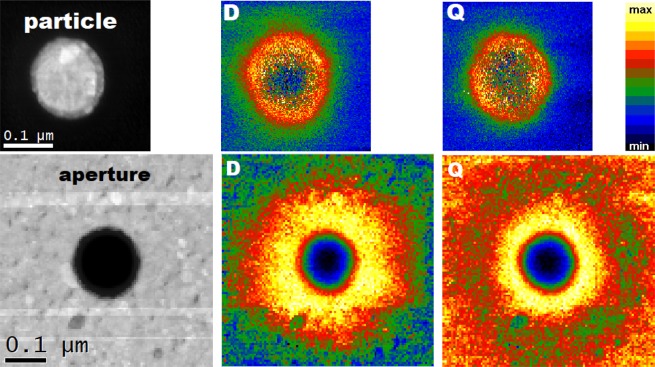
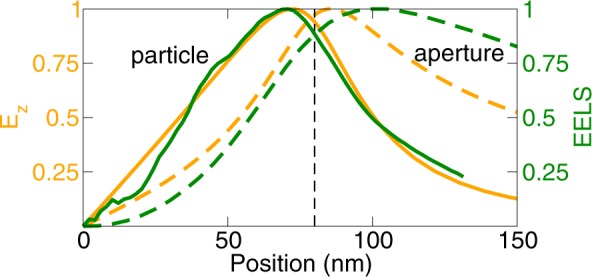
We present an experimental and theoretical study of Babinet's principle of complementarity in plasmonics. We have used spatially-resolved electron energy loss spectroscopy and cathodoluminescence to investigate electromagnetic response of elementary plasmonic antenna: gold discs and complementary disc-shaped apertures in a gold layer. We have also calculated their response to the plane wave illumination. While the qualitative validity of Babinet's principle has been confirmed, quantitative differences have been found related to the energy and quality factor of the resonances and the magnitude of related near fields. In particular, apertures were found to exhibit stronger interaction with the electron beam than solid antennas, which makes them a remarkable alternative of the usual plasmonic-antennas design. We also examine the possibility of magnetic near field imaging based on the Babinet's principle.


Conflict of interest statement

The authors declare no competing interests.

Figures

Figure 1
Figure 1
(a) Calculated scattering cross-section of disc-shaped plasmonic particles (solid lines) and apertures (dashed lines) for several antenna diameters. The values are normalized by the geometric cross-section (i.e., area of the disc). (b) Dispersion relation for LSPR: Peak energy of the calculated scattering (or absorption) cross-section as a function of a wave number represented by a reciprocal diameter. (c) Q factor of individual LSPR in particles (full circles) and apertures (empty circles). The lines are guides to the eye. Arrows indicate specific PA diameters, individual points from high to low energy corresponds to the diameters of 50, 100, 150, 200, 300, 400, and 500 nm. Magenta line represents the reciprocal value of the imaginary part of the dielectric function.
Figure 2
Figure 2
Calculated near electric and magnetic fields of disc-shaped plasmonic particles and apertures. The diameter of PAs was set to 160 nm and PAs were illuminated by x-polarized plane wave with the photon energy corresponding to the dipole LSPR. Field amplitudes are normalized to the incident field and multiplied by the sign of the field phase. Planar cross sections of the in-plane components of electric and magnetic scattered fields at the height of 20 nm above the PAs are shown for the particle (left column) and aperture (right column). Corresponding quantities are indicated by the frame of identical color. Black dashed lines indicate the positions of linear cross sections shown in Fig. 3.
Figure 3
Figure 3
Linear cross-sections of the near field amplitudes (multiplied by the sign of phase) from Fig. 2 at the height of 20 nm above the PAs with the diameter of 160 nm. All quantities are normalized to the incident field. (a) In-plane components Ex in the particle along x and Hy in the aperture along y. Note that the step-like change is resulting from the step-like change of the sign of the phase, while both the amplitude and phase of the field vary smoothly. (b) In-plane components Ey in the particle and Hx in the aperture along xy diagonal. Hx normalized to the same amplitude as Ey (i.e., multiplied by 1.7) is shown by dotted green line. (c) Out-of-plane components Ez and Hz. Solid (dashed) lines represent particles (apertures), orange (green) color corresponds to the electric (magnetic) field. Black dashed lines denote the PA boundary.
Figure 4
Figure 4
(a,b) ADF-STEM images of plasmonic antennas involved in the study: (a) particle with the diameter of 101 nm, (b) aperture with the diameter of 108 nm. White (dark) color corresponds to gold (substrate). The cyan circles show experimentally determined PA diameters, the numbers indicate the value of the diameter. (c) Height profiles of PAs from (a,b) obtained from EELS images.
Figure 5
Figure 5
Processing of experimental EEL spectra. (a) Raw EEL spectrum recorded for a disc PA with a diameter of 161 nm. The spectrum is decomposed into a zero-loss peak and background (red area), and LSP-related response (green area). (b) Normalized LSP-related EEL spectrum (green area) compared with the calculated EEL spectrum (black dashed line) convolved with a Gaussian (full width at half maximum 0.23 eV) (red dashed line). The calculated spectra have been multiplied by a factor of 1.13 to facilitate the comparison. (c) Normalized LSP-related EEL spectrum (green area) decomposed into individual Gaussian peaks corresponding to the dipole mode (D, red line) and multimodal peak (MA, dark-red line). The sum of both Gaussians is shown by black solid line.
Figure 6
Figure 6
(a,b) Experimental EEL (a) and CL (b) spectra excited near the edge of the PA: particles (solid lines) and apertures (dashed lines). Specific colors correspond to similar diameters. (c,d) Dispersion relation for the dipole LSPR: calculated EEL peak energies for discs (solid line) and apertures (dashed line), data from EELS (c) and CL (d) from the top panels for the dipole LSPR in discs (filled circles) and apertures (empty circles), specific colors indicating particular spectra. We note that we use calculated EEL peak energies to represent LSPR energies in both panels. The difference between calculated CL and EEL peak energies is below 0.02 eV (1%) for discs and we anticipate similar error for apertures, where we did not perform CL calculations as they would be numerically too demanding.
Figure 7
Figure 7
ADF-STEM images of a particle (diameter 161 nm, top) and an aperture (diameter 164 nm, bottom). Spatial maps of the loss probability for a dipole (D) and quadrupole (Q) mode.
Figure 8
Figure 8
Radial distribution of the loss probability at the energy of the dipole LSP peak for a particle with a diameter of 161 nm (green solid line) and an aperture with a diameter of 164 nm (green dashed line). Experimental values are compared with the calculated results of near electric field Ez taken from Fig. 3(c) (orange lines). All quantities are normalized to unity and the diameters are scaled to 160 nm to allow a direct comparison of spatial profiles. Dashed line denotes the radius of the PA.

References

    1. Novotny L, van Hulst N. Antennas for light. Nat. Photonics. 2011;5:83. doi: 10.1038/nphoton.2010.237. - DOI
    1. Schuller JA, et al. Plasmonics for extreme light concentration and manipulation. Nat. Mater. 2010;9:193. doi: 10.1038/nmat2630. - DOI - PubMed
    1. Benz F, et al. Single-molecule optomechanics in “picocavities”. Sci. 2016;354:726–729. doi: 10.1126/science.aah5243. - DOI - PubMed
    1. Kelly KL, Coronado E, Zhao LL, Schatz GC. The optical properties of metal nanoparticles: The influence of size, shape, and dielectric environment. The J. Phys. Chem. B. 2003;107:668–677. doi: 10.1021/jp026731y. - DOI
    1. Anderson MS. Locally enhanced Raman spectroscopy with an atomic force microscope. Appl. Phys. Lett. 2000;76:3130–3132. doi: 10.1063/1.126546. - DOI