. 2019 Nov;26(11):2447-2463.
doi: 10.1038/s41418-019-0312-y. Epub 2019 Mar 8.

Gut microbiota-stimulated cathepsin K secretion mediates TLR4-dependent M2 macrophage polarization and promotes tumor metastasis in colorectal cancer

Affiliations

Gut microbiota-stimulated cathepsin K secretion mediates TLR4-dependent M2 macrophage polarization and promotes tumor metastasis in colorectal cancer

Rui Li et al. Cell Death Differ. 2019 Nov.

Abstract

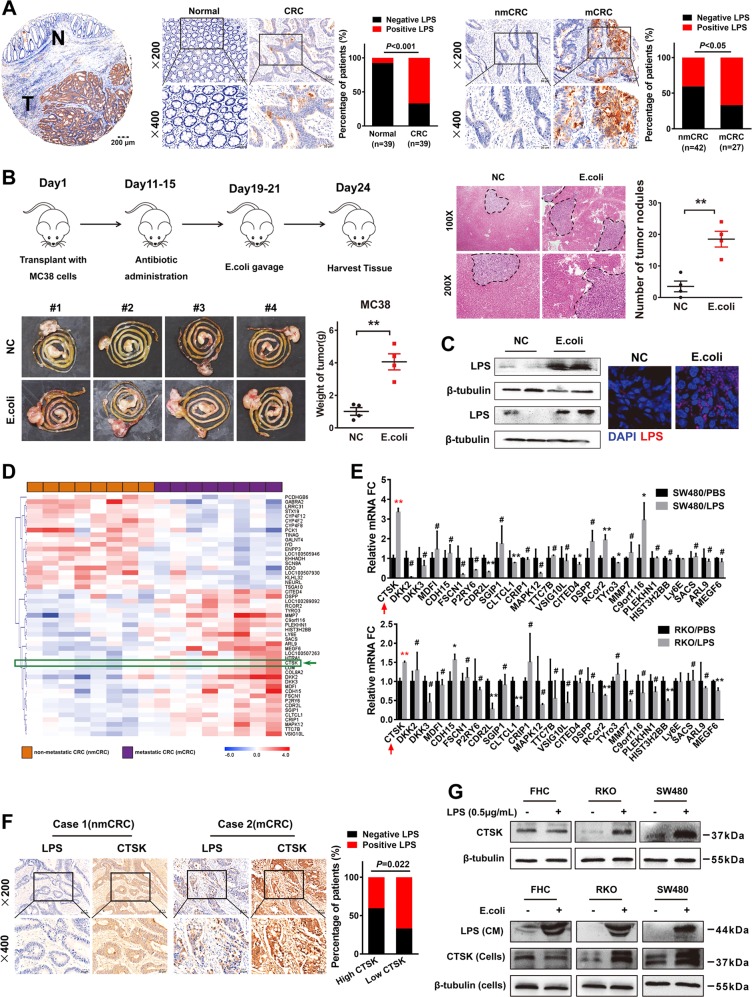
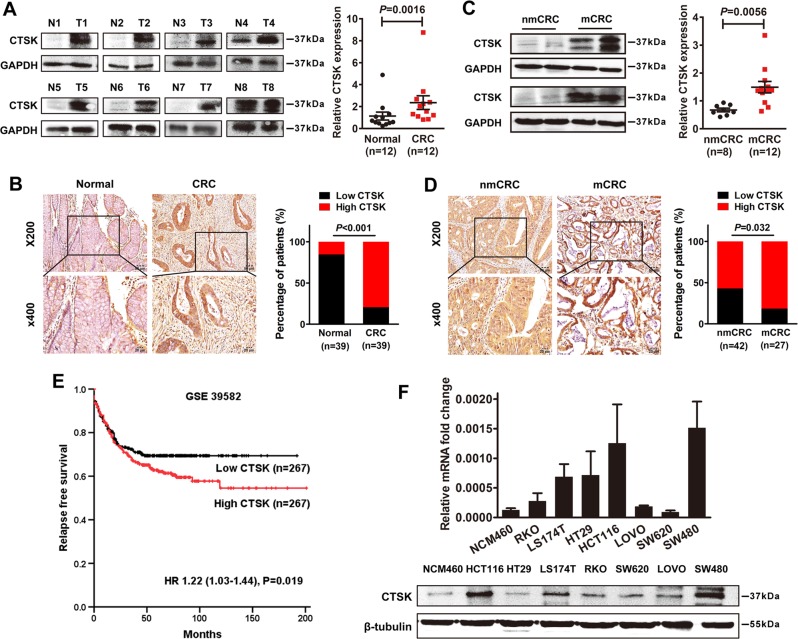
Metastasis is a complex process that requires the interaction between tumor cells and their microenvironment. As an important regulator of intestinal microenvironment, gut microbiota plays a significant role in the initiation and progression of colorectal cancer (CRC), but the underlying mechanisms remain elusive. In this study, a metastasis-related secretory protein cathepsin K (CTSK) was identified as a vital mediator between the imbalance of intestinal microbiota and CRC metastasis. We implanted MC38 cells into the cecal mesentry of antibiotic-treated mice with intragastrically administration of E. coli to mimic gut microbiota imbalance. The bigger primary tumors and more liver metastatic foci were detected in the E. coli group accompanied with high LPS secretion and CTSK overexpression compared with that in the control group. CTSK contributes to the aggressive phenotype of CRC cells both in vitro and in vivo. Silencing CTSK or administration of Odanacatib, a CTSK-specific inhibitor, totally abolished the CTSK-enhanced migration and motility of CRC cells. Interestingly, the tumor-secreted CTSK could bind to toll-like receptor 4 (TLR4) to stimulate the M2 polarization of tumor-associated macrophages (TAMs) via an mTOR-dependent pathway. Recombinant CTSK could neither stimulate CRC growth and metastasis, nor induce M2 macrophage polarization in TRL4-/- mice. Meanwhile, CTSK could stimulate the secretion of cytokines by M2 TAMs including IL10 and IL17, which, in turn, promote the invasion and metastasis of CRC cells through NFκB pathway. Clinically, overexpression of CTSK in human CRC tissues is always accompanied with high M2 TAMs in the stroma, and correlated with CRC metastasis and poor prognosis. Our current research identified CTSK as a mediator between the imbalance of gut microbiota and CRC metastasis. More importantly, we illustrated a CTSK-mediated-positive feedback loop between CRC cells and TAMs during metastasis, prompting CTSK as a novel predictive biomarker and feasible therapeutic target for CRC.


Conflict of interest statement

The authors declare that they have no conflict of interest.

Figures

Fig. 1
Fig. 1
Imbalance of intestinal microbiota is associated with high CTSK expression and advanced progression of colorectal cancer. a Left panel: Immunohistochemistry (IHC) analysis of lipopolysaccharides (LPS) in colorectal cancer (CRC) tissues and adjacent non-tumor tissues. Right panel: IHC analysis of LPS in CRC tissues w/o metastasis. b Upper left panel: Sketch map shows the orthotopic implantation of MC38 cells in antibiotic-treated mice w/o intragastrical administration of E. coli. Upper right panel: HE staining shows the hepatic metastasis foci in antibiotic-treated mice w/o intragastrical administration of E. coli. The scatter diagram on the right represents the number of tumor nodules. Lower panel: The primary tumor developed by implantation of MC38 cells in antibiotic-treated mice w/o intragastrical administration of E. coli. c LPS expression in the primary tumors developed by implantation of MC38 cells in antibiotic-treated mice w/o intragastrical administration of E. coli. d Heat map depicting the differentially expressed genes in eight pairs of human non-metastatic and metastatic CRC tissues. Red and blue indicate high and low expression of genes. e Real-time PCR analysis shows the expression of differentially expressed genes in response to LPS treatment in SW480 and RKO cell lines. f Representative images of IHC staining analyses of CTSK and LPS in non-metastatic and metastatic CRC tissues. g Upper panel: Western blot analysis of CTSK in FHC, SW480 and RKO cell lines in response to LPS treatment. Lower panel: Western blot analysis of LPS releasing and CTSK in FHC, SW480, and RKO cells pretreated with E. coli
Fig. 2
Fig. 2
Overexpression of CTSK is associated with advanced progression and poor prognosis of colorectal cancer. a Western blot analysis of CTSK in colorectal cancer (CRC) tissues (T) and adjacent non-tumor tissues (N). The scatter chart in the right shows the relative CTSK expression in normal and CRC tissues (normalized to GAPDH, P = 0.0016). b Representative images of immunohistochemistry (IHC) staining analysis of CTSK expression in CRC tissues and adjacent non-tumor tissues. The bar chart in the right represents the percentage of high and low CTSK expression cases in normal and CRC tissues. c Western blot analysis of CTSK in non-metastatic (nmCRC) and metastatic (mCRC) colon cancer tissues. The scatter chart in the right shows the relative CTSK expression in nmCRC and mCRC tissues (normalized to GAPDH, P = 0.0056). d IHC analysis of CTSK expression in non-metastatic and metastatic CRC tissues. The bar chart in the right represents the percentage of high and low CTSK expression cases in nmCRC and mCRC tissues. e Kaplan–Meier survival curves and univariate analyses (log-rank) for CRC patients with distinct expression levels of CTSK. f Western blot analysis was used to detect the expression of CTSK in CRC cell lines
Fig. 3
Fig. 3
Exogenous CTSK contributes to aggressive phenotypes of colorectal cancer (CRC) cells both in vitro and in vivo. a SW480 tumor cells were injected subcutaneously into the back of nude mice to evaluate tumor growth. Representative figure of tumors formed is shown. b The shNC and shCTSK-SW480 cells were injected into nude mice through the tail vein to evaluate the lung homing potential of cells. The number of metastatic lung nodules in individual mice was counted under the microscope. The magnification areas indicated metastatic nodes in the lung. The asterisk (*) indicates P < 0.05. c The CTL and CTSK overexpression RKO cells were injected subcutaneously into the back of nude mice to evaluate tumor growth with or without ODN (3.606 mg kg−1 per week) treatment. Representative figure of subcutaneous tumors are shown. d The Ctrl and CTSK overexpression RKO cells were injected into nude mice through the tail vein to evaluate the lung homing potential of cells with or without ODN (3.606 mg kg−1 per week) treatment. The number of metastatic lung nodules in individual mice was counted under the microscope. The magnification areas indicated metastatic nodes in the lung. The asterisk (*) indicates P < 0.05. e Western blot analysis shows the expression of CTSK in conditioned media (CM) of CRC cell lines. f Western blot analysis was used to detect the secretion of CTSK in conditioned media (CM) of CRC cell lines
Fig. 4
Fig. 4
Tumor-secreted CTSK contributes to colorectal cancer (CRC) cell migration via inducing the M2 polarization of macrophages. a Schematic diagram shows a co-culture system of macrophage-like U937 cells and CRC cells. Bar charts shows the invasion and migration ability of CRC cells with or without the existence of macrophage-like U937 cells. The asterisk (*) indicates P < 0.05. The double asterisk (**) indicates P < 0.01. b Left panel: IF assay was used to visualize the increase of CD206 in macrophage-like U937 and THP-1 cells treated with rCTSK(0.1  µg/ml) or IL4/IL13(0.1  µg/ml). Right panel: Western blot analysis were used to detect the expression of CD68 and CD206 in macrophage-like U937 and THP-1 cells treated with recombinant protein CTSK(0.1  µg/ml) or IL4/IL13(0.1  µg/ml). c Flow cytometry shows the number of CD163+ U937 cells induced by CTSK and IL4/IL13. d IF assay was used to visualize the expression of CD206 in peritoneal macrophages treated with rCTSK (0.1 µg/ml) or IL4/IL13 (0.1 µg/ml). e Flow cytometry analysis shows the effects of rCTSK and IL4/IL13 on the M2 polarization of peritoneal macrophages. f Upper panel: Flow cytometry analysis shows the effect of lipopolysaccharide (LPS) and CTSK on the polarization of tumor-associated macrophages (TAMs). Lower panel: Flow cytometry analysis shows that LPS could only stimulate M2 Polarization of TAMs with the existence of CRC cells. g IF assay was used to visualize the increase of CD206 in macrophage-like U937 cells treated with LPS or the conditioned media of SW480 cells with or without the existence of E. coli
Fig. 5
Fig. 5
Colorectal cancer (CRC)-secreted CTSK activates mTOR pathway via interaction with macrophage membrane receptor Toll-like receptor 4 (TLR4). a Western blot analysis detected the expression of TLR4/MyD88p-AKT/mTOR pathway members (phosphorylated AKT at Ser473, p-mTOR, p-4E, TLR4, MyD88) in macrophage-like cells w/o the treatment of rCTSK and IL4/IL13. b Western blot analysis of p-AKT/mTOR pathway members, TLR4 and MyD88 in M2 type macrophage-like cells with or without the treatment of rCTSK and Rapamycin (100 nmol). c IF assay analysis of the expression of CD68 and CD206 in IL4/IL13 induced M2 type macrophage-like cells w/o treatment of rCTSK and Rapamycin. d Western blot analysis detected the expression of TLR4/MyD88p-AKT/mTOR pathway members in peritoneal macrophages w/o the treatment of rCTSK and IL4/IL13. e Upper panel: Validation of endogenous interaction between CTSK and TLR4 in indicated cells. Lower panel: IF assay analysis of the co-localization of CTSK with TLR4 in macrophage-like cells. f IF assay shows the decreased co-localization of CTSK and TLR4 in macrophage-like cells after silencing TLR4
Fig. 6
Fig. 6
TLR4 pathway is essential for CTSK-induced M2 polarization of macrophages and colorectal cancer (CRC) cell migration. a IF assay represents the decreased co-localization of CTSK and TLR4 in rCTSK activated macrophage-like cells after administration of TLR4 antibody. b Western blot analysis detected the expression of TLR4-AKT/mTOR pathway members in rCTSK stimulated U937 macrophage-like cells after the treatment of TLR4 antibody. c Flow cytometry analysis shows the number of CD163 in macrophage-like cells in indicated cells. d The primary tumor developed by implantation of MC38 cells in WT and TLR4−/− mice w/o intraperitoneal injection of rCTSK. Scatter diagram on the right represents the weight of tumors. e HE staining shows the hepatic metastasis foci in in WT and TLR4−/− mice w/o intraperitoneal injection of rCTSK. f IF assay analysis of the expression of F4/80 and CD206 in peritoneal macrophages larvaged from WT and TLR4−/− mice w/o treatment of rCTSK
Fig. 7
Fig. 7
Colorectal cancer (CRC)-secreted CTSK-induced cytokines secretion promotes CRC cells invasion and metastasis via NF-κB signaling pathway. a Human Cytokine Antibody Array was applied to detect the changes of inflammatory factors in conditioned media (CM) of macrophage-like cells treated with recombinant protein CTSK. The asterisk (*) indicates P < 0.05. The double asterisk (**) indicates P < 0.01. b Real-time PCR analysis shows the expression of cytokine receptors in CTSK overexpression or silencing CRC cells. c The number of invading cells in transwell assay with the treatment of different cytokines was counted under a microscope in five randomly selected fields. d IF assay was used to visualize the nucleus translocation of p-NFκb with the treatment of IL10 or IL17. e Western blot analysis of NFκb pathway members in nuclear and cytoplasm of CRC cells treated with IL10 or IL17. f The bar chart shows the number of invaded cells in transwell assay with or without the treatment of BAY11-7082. g The bar chart shows the invasion and migration of CRC cells in the co-culture system with the treatment of CTSK antibody, TLR4 antibody, BAY11-7082, and Rapamycin
Fig. 8
Fig. 8
Overexpression of CTSK is correlated with high abundance of M2 tumor-associated macrophages (TAMs) in colorectal cancer (CRC) tissues. a IF assay analysis of the correlation between CD206 and CTSK in colon cancer tissues. b Immunohistochemistry (IHC) analysis of the correlation between CD163 and CTSK in colon cancer tissues. The asterisk (*) indicates P < 0.05. The double asterisk (**) indicates P < 0.01. c The sketch map of the regulation and mechanism of CTSK-mediated CRC metastasis

References

    1. De Rosa M, Pace U, Rega D, Costabile V, Duraturo F, Izzo P, et al. Genetics, diagnosis and management of colorectal cancer (Review) Oncol Rep. 2015;34:1087–96. doi: 10.3892/or.2015.4108. - DOI - PMC - PubMed
    1. Joyce JA, Fearon DT. T cell exclusion, immune privilege, and the tumor microenvironment. Science. 2015;348:74–80. doi: 10.1126/science.aaa6204. - DOI - PubMed
    1. Chung L, Orberg ET, Geis AL, Chan JL, Fu K, et al. Bacteroides fragilis toxin coordinates a pro-carcinogenic inflammatory cascade via targeting of colonic epithelial cells. Cell Host Microbe. 2018;23:421. doi: 10.1016/j.chom.2018.02.004. - DOI - PMC - PubMed
    1. Dejea CM, Fathi P, Craig JM, Boleij A, Taddese R, Geis AL, et al. Patients with familial adenomatous polyposis harbor colonic biofilms containing tumorigenic bacteria. Science. 2018;359:592–7. doi: 10.1126/science.aah3648. - DOI - PMC - PubMed
    1. Routy B, Le Chatelier E, Derosa L, Duong CPM, Alou MT, Daillere R, et al. Gut microbiome influences efficacy of PD-1-based immunotherapy against epithelial tumors. Science. 2018;359:91–7. doi: 10.1126/science.aan3706. - DOI - PubMed

MeSH terms