. 2019 Oct 1;35(19):3752-3760.
doi: 10.1093/bioinformatics/btz160.

Interoperable and scalable data analysis with microservices: applications in metabolomics

Affiliations

Interoperable and scalable data analysis with microservices: applications in metabolomics

Payam Emami Khoonsari et al. Bioinformatics. .

Abstract

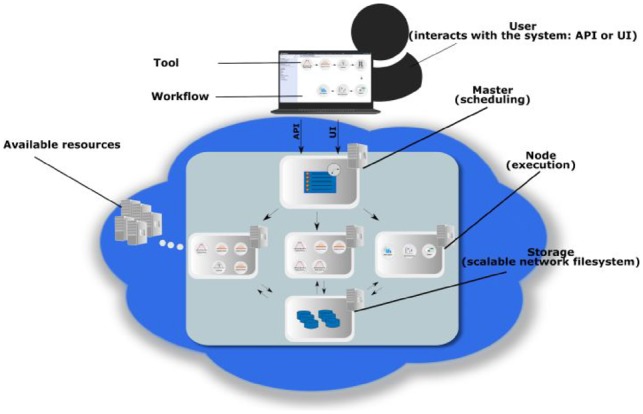
Motivation: Developing a robust and performant data analysis workflow that integrates all necessary components whilst still being able to scale over multiple compute nodes is a challenging task. We introduce a generic method based on the microservice architecture, where software tools are encapsulated as Docker containers that can be connected into scientific workflows and executed using the Kubernetes container orchestrator.

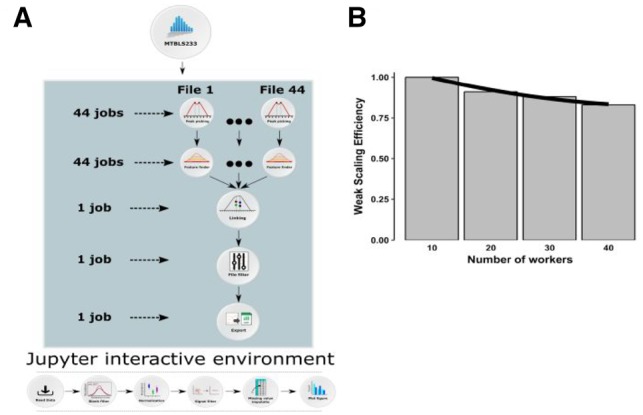
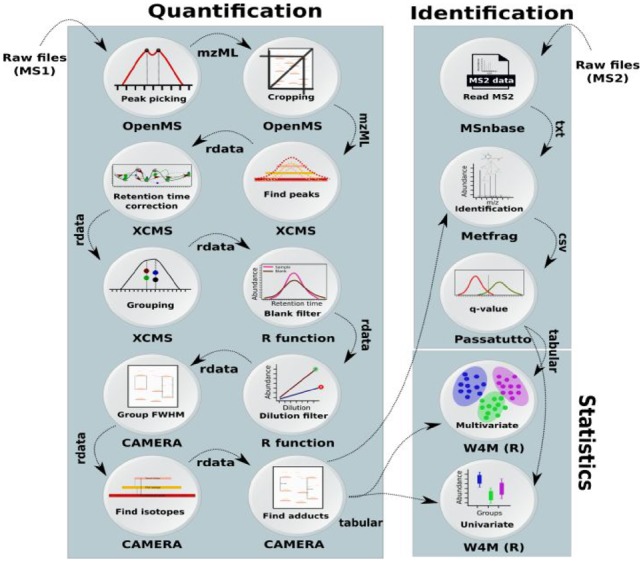
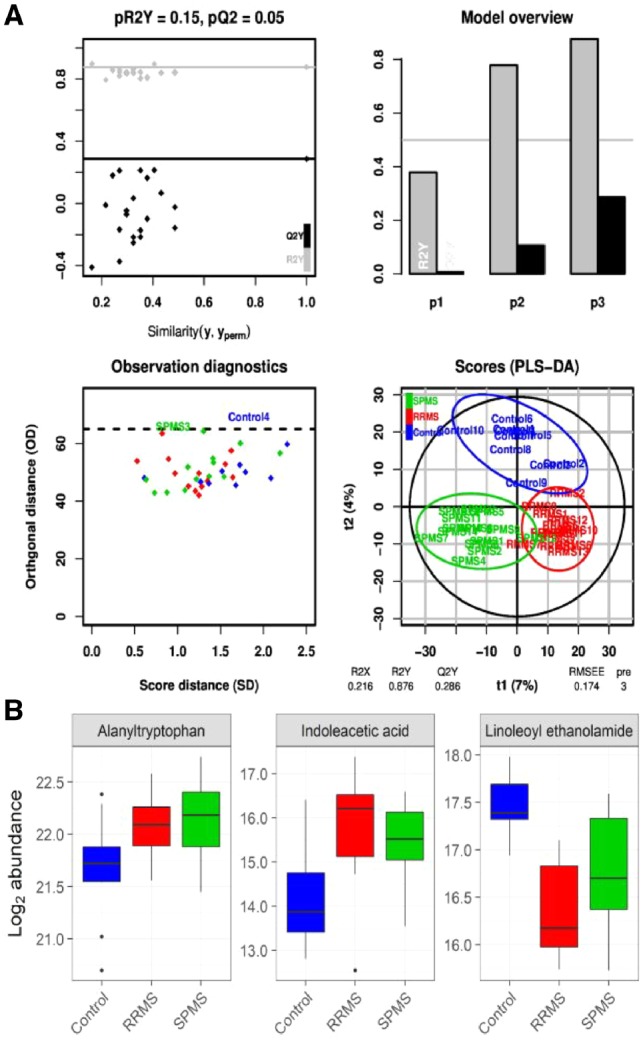
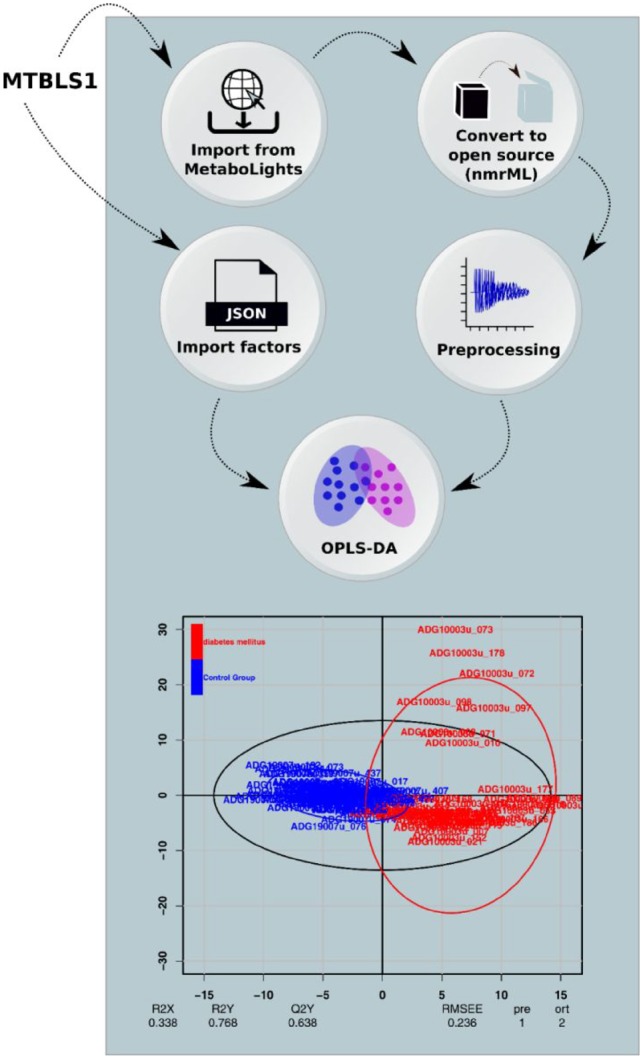
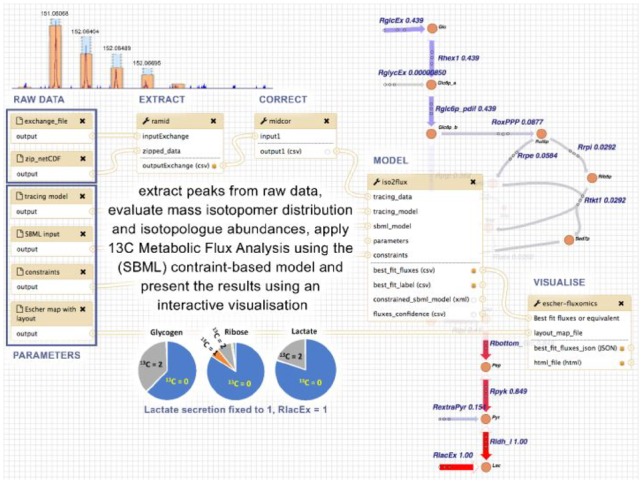
Results: We developed a Virtual Research Environment (VRE) which facilitates rapid integration of new tools and developing scalable and interoperable workflows for performing metabolomics data analysis. The environment can be launched on-demand on cloud resources and desktop computers. IT-expertise requirements on the user side are kept to a minimum, and workflows can be re-used effortlessly by any novice user. We validate our method in the field of metabolomics on two mass spectrometry, one nuclear magnetic resonance spectroscopy and one fluxomics study. We showed that the method scales dynamically with increasing availability of computational resources. We demonstrated that the method facilitates interoperability using integration of the major software suites resulting in a turn-key workflow encompassing all steps for mass-spectrometry-based metabolomics including preprocessing, statistics and identification. Microservices is a generic methodology that can serve any scientific discipline and opens up for new types of large-scale integrative science.

Availability and implementation: The PhenoMeNal consortium maintains a web portal (https://portal.phenomenal-h2020.eu) providing a GUI for launching the Virtual Research Environment. The GitHub repository https://github.com/phnmnl/ hosts the source code of all projects.

Supplementary information: Supplementary data are available at Bioinformatics online.


Figures

Fig. 1.
Fig. 1.
Overview of the components in a microservices-based framework. Complex applications are divided into smaller, focused and well-defined (micro-) services. These services are independently deployable and can communicate with each other, which allows to couple them into complex task pipelines, i.e. data processing workflows. The user can interact with the framework programmatically via an Application Program Interface (API) or via a graphical user interface (GUI) to construct or run workflows of different services, which are executed independently. Multiple instances of services can be launched to execute tasks in parallel, which effectively can be used to scale analysis over multiple compute nodes. When run in an elastic cloud environment, virtual resources can be added or removed depending on the computational requirements
Fig. 2.
Fig. 2.
Diagram of scalability-testing on a metabolomics dataset (MetaboLights ID: MTBLS233) in Demonstrator 1 to illustrate the scalability of a microservice approach. A) The preprocessing workflow is composed of 5 OpenMS tasks that were run in parallel over the 12 groups in the dataset using the Luigi workflow system. The first two tasks, peak picking (528 tasks) and feature finding (528 tasks), are trivially parallelizable, hence they were run concurrently for each sample. The subsequent feature linking task needs to process all of the samples in a group at the same time, therefore 12 of these tasks were run in parallel. In order to maximize the parallelism, each feature linker container (microservice) was run on 2 CPUs. Feature linking produces a single file for each group, that can be processed independently by the last two tasks: file filter (12 tasks) and text exporter (12 tasks), resulting in total of 1092 tasks. The downstream analysis consisted of 6 tasks that were carried out in a Jupyter Notebook. Briefly, the output of preprocessing steps was imported into R and the unstable signals were filtered out. The missing values were imputed and the resulting number of features were plotted. B) The weak scaling efficiency plot for Demonstrator 1. Given the full MTBLS233 dataset, the preprocessing was run on 40 Luigi workers. Then for 1/4, 2/4, 3/4 of MTBLS233, the analysis was run again on 10, 20 and 30 workers respectively. For each run, we measured the processing time T10, T20, T30 and T40, and we computed the WSEn = T10/Tn for n = 10, 20, 30, 40. The WSE plot shows scalability up to 40 CPUs, where we achieved ∼88% scaling efficiency. The running time for the full dataset (a total of 1092 tasks) on 40 workers was ∼4 hours
Fig. 3.
Fig. 3.
Overview of the workflow used to process multiple-sclerosis samples in Demonstrator 2, where a workflow was composed of the microservices using the Galaxy system. The data was centroided and limited to a specific mass over charge (m/z) range using OpenMS tools. The mass traces quantification and retention time correction was done via XCMS (Smith et al., 2006). Unstable signals were filtered out based on the blank and dilution series samples using an in-house function (implemented in R). Annotation of the peaks was performed using CAMERA (Kuhl et al., 2012). To perform the metabolite identification, the tandem spectra from the MS/MS samples in mzML format were extracted using MSnbase and passed to MetFrag. The MetFrag scores were converted to q-values using Passatutto software. The result of identification and quantification were used in ‘Multivariate’ and ‘Univariate’ containers from Workflow4Metabolomics (Giacomoni et al., 2015) to perform Partial Least Squares Discriminant Analysis (PLS-DA)
Fig. 4.
Fig. 4.
The results from analysis of multiple sclerosis data in Demonstrator 2, presenting new scientifically useful biomedical knowledge. A) The PLS-DA results suggest that the metabolite distribution in the RRMS and SPMS samples are different to controls. B) Three metabolites were identified as differentially regulated between multiple sclerosis subtypes and control samples, namely Alanyltryptophan and Indoleacetic acid with higher and Linoleoyl ethanolamide with lower abundance in both RRMS and SPMS compared to controls. Abbr., RRMS: relapsing-remitting multiple sclerosis, SPMS: secondary progressive multiple sclerosis
Fig. 5.
Fig. 5.
Overview of the NMR workflow in Demonstrator 3. The raw NMR data and experimental metadata (ISATab) was automatically imported from the Metabolights database and converted to open source nmrML format. The preprocessing was performed using the rnmr1d package part of nmrprocflow tools. All study factors were imported from MetaboLights and were fed to the multivariate node to perform an OPLS-DA
Fig. 6.
Fig. 6.
Overview of the workflow for fluxomics, with Ramid, Midcor, Iso2Flux and Escher-fluxomics tools supporting subsequent steps of the analysis. The example refers to HUVEC cells incubated in the presence of [1,2-13C2]glucose and label (13C) propagation to glycogen, RNA ribose and lactate measured by mass spectrometry. Ramid reads the raw netCDF files, corrects baseline and extracts the peak intensities. The resulting peak intensities are corrected (natural abundance, overlapping peaks) by Midcor, which provides isotopologue abundances. Isotopologue abundances, together with a model description (SBML model, tracing data, constraints), are used by Iso2Flux to provide flux distributions through glycolysis and pentose-phosphate pathways, which are shown as numerical values associated to a metabolic scheme of the model by the Escher-fluxomics tool

Similar articles

  • PhenoMeNal: processing and analysis of metabolomics data in the cloud.
    Peters K, Bradbury J, Bergmann S, Capuccini M, Cascante M, de Atauri P, Ebbels TMD, Foguet C, Glen R, Gonzalez-Beltran A, Günther UL, Handakas E, Hankemeier T, Haug K, Herman S, Holub P, Izzo M, Jacob D, Johnson D, Jourdan F, Kale N, Karaman I, Khalili B, Emami Khonsari P, Kultima K, Lampa S, Larsson A, Ludwig C, Moreno P, Neumann S, Novella JA, O'Donovan C, Pearce JTM, Peluso A, Piras ME, Pireddu L, Reed MAC, Rocca-Serra P, Roger P, Rosato A, Rueedi R, Ruttkies C, Sadawi N, Salek RM, Sansone SA, Selivanov V, Spjuth O, Schober D, Thévenot EA, Tomasoni M, van Rijswijk M, van Vliet M, Viant MR, Weber RJM, Zanetti G, Steinbeck C. Peters K, et al. Gigascience. 2019 Feb 1;8(2):giy149. doi: 10.1093/gigascience/giy149. Gigascience. 2019. PMID: 30535405 Free PMC article.
  • Container-based bioinformatics with Pachyderm.
    Novella JA, Emami Khoonsari P, Herman S, Whitenack D, Capuccini M, Burman J, Kultima K, Spjuth O. Novella JA, et al. Bioinformatics. 2019 Mar 1;35(5):839-846. doi: 10.1093/bioinformatics/bty699. Bioinformatics. 2019. PMID: 30101309 Free PMC article.
  • Scalable Data Analysis in Proteomics and Metabolomics Using BioContainers and Workflows Engines.
    Perez-Riverol Y, Moreno P. Perez-Riverol Y, et al. Proteomics. 2020 May;20(9):e1900147. doi: 10.1002/pmic.201900147. Epub 2019 Dec 18. Proteomics. 2020. PMID: 31657527 Free PMC article. Review.
  • Workflow4Metabolomics (W4M): A User-Friendly Metabolomics Platform for Analysis of Mass Spectrometry and Nuclear Magnetic Resonance Data.
    Delporte C, Tremblay-Franco M, Guitton Y, Canlet C, Weber RJM, Hecht H, Price EJ, Klánová J, Joly C, Dalle C, Saint-Vanne J, Thévenot E, Schmitz I, Chéreau S, Dechaumet S, Diémé B, Giacomoni F, Le Corguillé G, Pétéra M, Souard F. Delporte C, et al. Curr Protoc. 2025 Feb;5(2):e70095. doi: 10.1002/cpz1.70095. Curr Protoc. 2025. PMID: 39951023
  • The metaRbolomics Toolbox in Bioconductor and beyond.
    Stanstrup J, Broeckling CD, Helmus R, Hoffmann N, Mathé E, Naake T, Nicolotti L, Peters K, Rainer J, Salek RM, Schulze T, Schymanski EL, Stravs MA, Thévenot EA, Treutler H, Weber RJM, Willighagen E, Witting M, Neumann S. Stanstrup J, et al. Metabolites. 2019 Sep 23;9(10):200. doi: 10.3390/metabo9100200. Metabolites. 2019. PMID: 31548506 Free PMC article. Review.

Cited by

References

    1. Allan R.N. (2009) Virtual Research Environments: From Portals to Science Gateways. ChandosŁ Publishing, Oxford, UK.
    1. Amirkhani A. et al. (2005) Interferon-beta affects the tryptophan metabolism in multiple sclerosis patients. Eur. J. Neurol., 12, 625–631. - PubMed
    1. Atkinson M. et al. (2017) Scientific workflows: past, present and future. Future Gener. Comput. Syst., 75, 216–227.
    1. Baker D., Pryce G. (2008) The endocannabinoid system and multiple sclerosis. Curr. Pharm. Des., 14, 2326–2336. - PubMed
    1. Berger B. et al. (2013) Computational solutions for omics data. Nat. Rev. Genet., 14, 333–346. - PMC - PubMed

Publication types