. 2019 May 1;36(5):1086-1100.
doi: 10.1093/molbev/msz049.

Bayesian Detection of Convergent Rate Changes of Conserved Noncoding Elements on Phylogenetic Trees

Affiliations

Bayesian Detection of Convergent Rate Changes of Conserved Noncoding Elements on Phylogenetic Trees

Zhirui Hu et al. Mol Biol Evol. .

Abstract

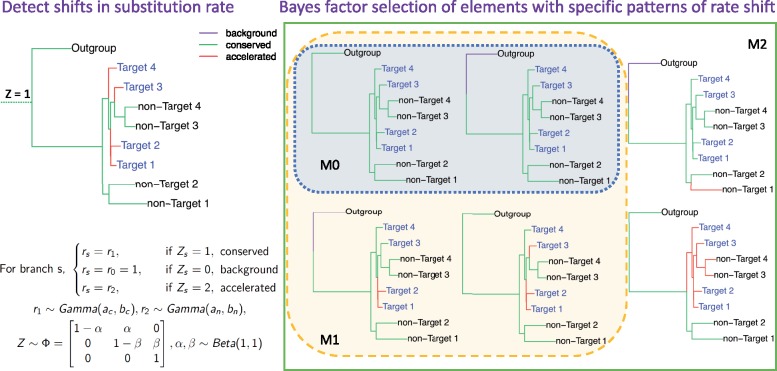
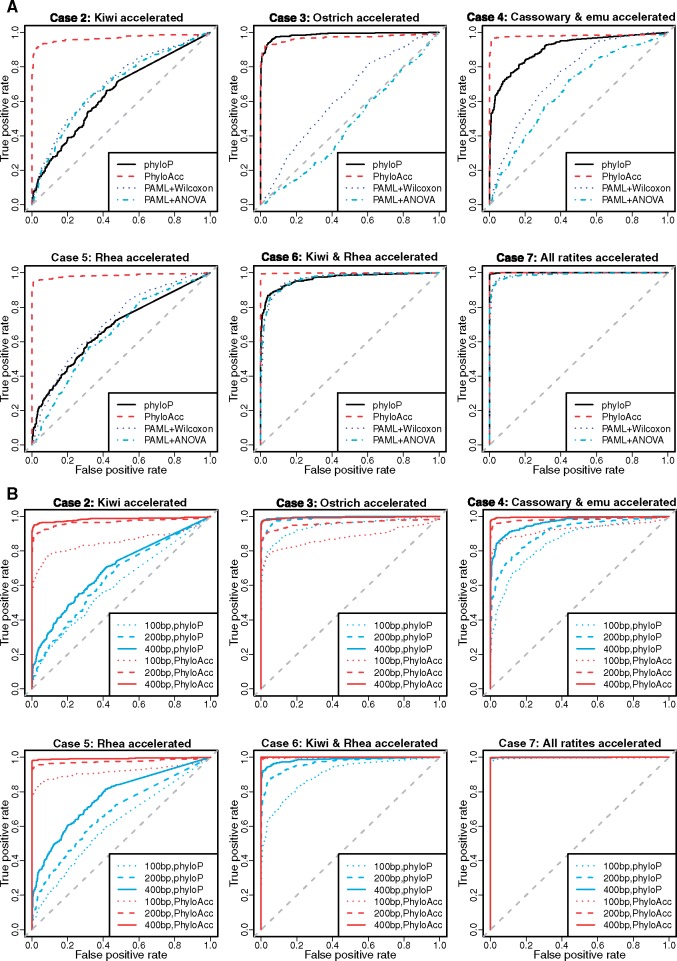
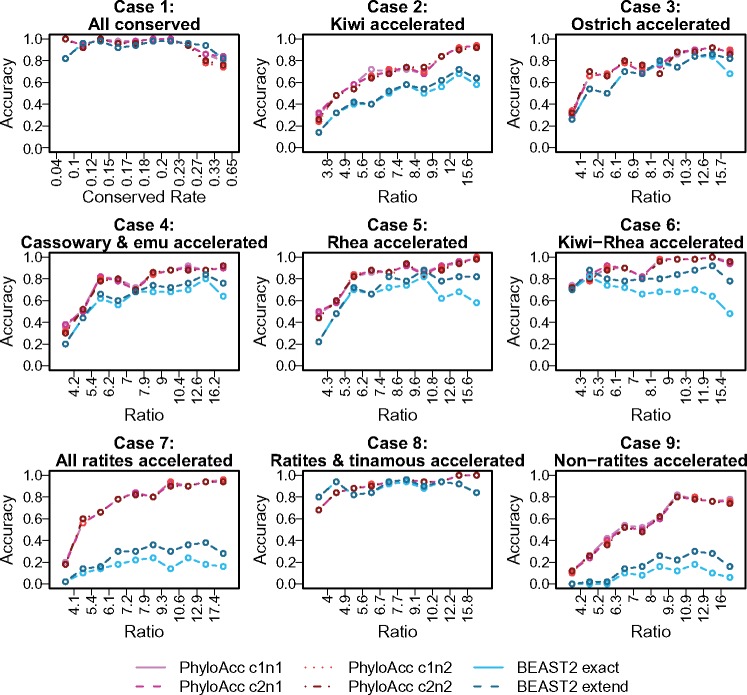
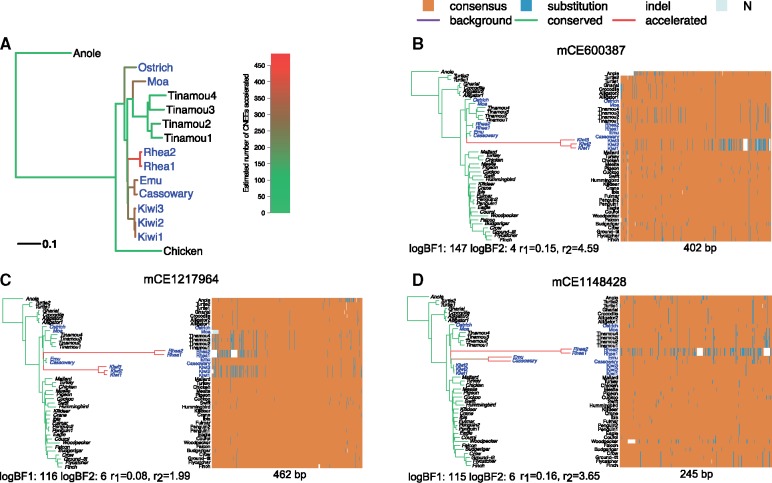
Conservation of DNA sequence over evolutionary time is a strong indicator of function, and gain or loss of sequence conservation can be used to infer changes in function across a phylogeny. Changes in evolutionary rates on particular lineages in a phylogeny can indicate shared functional shifts, and thus can be used to detect genomic correlates of phenotypic convergence. However, existing methods do not allow easy detection of patterns of rate variation, which causes challenges for detecting convergent rate shifts or other complex evolutionary scenarios. Here we introduce PhyloAcc, a new Bayesian method to model substitution rate changes in conserved elements across a phylogeny. The method assumes several categories of substitution rate for each branch on the phylogenetic tree, estimates substitution rates per category, and detects changes of substitution rate as the posterior probability of a category switch. Simulations show that PhyloAcc can detect genomic regions with rate shifts in multiple target species better than previous methods and has a higher accuracy of reconstructing complex patterns of substitution rate changes than prevalent Bayesian relaxed clock models. We demonstrate the utility of PhyloAcc in two classic examples of convergent phenotypes: loss of flight in birds and the transition to marine life in mammals. In each case, our approach reveals numerous examples of conserved nonexonic elements with accelerations specific to the phenotypically convergent lineages. Our method is widely applicable to any set of conserved elements where multiple rate changes are expected on a phylogeny.

Keywords: Bayesian model; comparative genomics; convergence; mammal; phylogenetics.


Figures

<sc>Fig</sc>. 1.
Fig. 1.
Illustration of the use of PhyloAcc to detect multiple accelerations and test hypotheses using Bayes factors. The left panel shows the Bayesian phylogenetic model; right panel shows some examples of acceleration patterns in three nested models: null (M0), lineage-specific (M1), and full model (M2), respectively. Our method can recover shifts of substitution rate such as the top-left figure and select target-accelerated elements fitted by M1 (not M0). In the trees, target species are shown as blue; branch lengths represent the background substitution rates and branch colors indicate the latent states of substitution rate for a given element.
<sc>Fig</sc>. 2.
Fig. 2.
Simulated results on the avian topology. (A) ROC curves for PhyloAcc, phyloP and PAML+Wilcoxon, PAML+phylANOVA in different ratite acceleration cases. (B) ROC curves for PhyloAcc and phyloP in different ratite acceleration cases and different lengths of elements. We treated elements with each acceleration pattern (cases 2–7 separately) as positive and all conserved elements (case 1) as negative, and compared sensitivity and specificity of PhyloAcc to others.
<sc>Fig</sc>. 3.
Fig. 3.
Comparison of accuracy recovering substitution rate shift patterns between BEAST2 and PhyloAcc in each simulation case. In each case, we ordered and categorized the simulated elements into ten equal-sized groups according to the ratio between substation rates of accelerated and conserved states (the quantiles of r2/r1 in each group are shown in supplementary fig. S8A, Supplementary Material online). X axis shows the boundary of the ratio in each group; red curves are the accuracy of PhyloAcc (using different priors on substitution rates) and blue curves are of BEAST2. c1 and c2 are Gamma(5, 0.04) and Gamma(1, 0.2), respectively, narrow and wide prior for conserved rate; n1 and n2 are Gamma(10, 0.2) and Gamma(4, 0.5), respectively, narrow and wide prior for accelerated rate. “cXnX” means a combination of them. “BEAST2 exact” shows the accuracy recovering the true pattern, whereas “BEAST2 extend” shows the accuracy allowing “loss-regain” pattern (see main text).
<sc>Fig</sc>. 4.
Fig. 4.
(A) Number of accelerated elements per branch among ratite-specific accelerated CNEEs. Phylogeny for avian data set (only a subset of species are shown for illustration). Palaeognaths consist of the flightless ratites and volant tinamous. Ratites are shown in blue. Branch lengths represent the background substitution rates. The gradient of the color indicates the expected number of elements being accelerated under the full model on that branch among 786 ratite-specific accelerated CNEEs. (B–D) Examples of ratite-accelerated CNEEs. For each element, the shift pattern of substitution rates under the full model is shown on the left represented by a phylogenetic tree with branch lengths proportional to the posterior mean of the substitution rate and colored by the posterior mean of Z (green is the conserved, red is the accelerated, and purple is the background state). Longer and redder branch indicates acceleration occurred at a higher rate or earlier on the branch, whereas shorter and greener one means later on the branch or no acceleration. Below the tree shows two log-BFs and conserved (r1)/accelerated rate (r2). In the sequence alignment heatmap on the right, each column is one position, each row is a species, and the element length is shown below. For each position, the majority nucleotide (T, C, G, A) among all species is labeled as “consensus” and colored as orange; others are labeled as “substitution” and colored as blue; unknown sequence is labeled as “N” and colored as gray; indels are shown as white space.
<sc>Fig</sc>. 5.
Fig. 5.
(A, B) Examples of marine mammal-accelerated CNEEs. For each element, the shift pattern of substitution rates under the full model is shown on the left represented by a phylogenetic tree with branch lengths proportional to the posterior mean of the substitution rate and colored by the posterior mean of Z Color scheme of tree and alignment, and statistics below each tree, are as in Fig. 4. Enriched GO terms (C) and mammalian phenotypes (D) of genes near marine-accelerated CNEEs. Only the top 20 terms are shown (all of them with FDR <0.01).

Similar articles

Cited by

References

    1. Angelis K, dos Reis M.. 2015. The impact of ancestral population size and incomplete lineage sorting on Bayesian estimation of species divergence times. Curr Zool. 61(5): 874–885.
    1. Baker AJ, Haddrath O, McPherson JD, Cloutier A.. 2014. Genomic support for a moa-tinamou clade and adaptive morphological convergence in flightless ratites. Mol Biol Evol. 31(7): 1686–1696. - PubMed
    1. Bejerano G, Pheasant M, Makunin I, Stephen S, Kent WJ, Mattick JS, Haussler D.. 2004. Ultraconserved elements in the human genome. Science 304(5675): 1321–1325. - PubMed
    1. Berger MJ, Wenger AM, Guturu H, Bejerano G.. 2018. Independent erosion of conserved transcription factor binding sites points to shared hindlimb, vision and external testes loss in different mammals. Nucleic Acids Res. 46(18): 9299–9308. doi:10.1093/nar/gky741. - PMC - PubMed
    1. Blanchette M, Kent WJ, Riemer C, Elnitski L, Smith AFA, Roskin KM, Baertsch R, Rosenbloom K, Clawson H, Green ED.. 2004. Aligning multiple genomic sequences with the threaded blockset aligner. Genome Res. 14(4): 708–715. - PMC - PubMed

Publication types