. 2019 May;85(5):630-643.
doi: 10.1002/ana.25465. Epub 2019 Mar 28.

Divergent patterns of TDP-43 and tau pathologies in primary progressive aphasia

Affiliations

Divergent patterns of TDP-43 and tau pathologies in primary progressive aphasia

Lucia A A Giannini et al. Ann Neurol. 2019 May.

Abstract

Objective: To measure postmortem burden of frontotemporal lobar degeneration (FTLD) with TDP-43 (FTLD-TDP) or tau (FTLD-Tau) proteinopathy across hemispheres in primary progressive aphasia (PPA) using digital histopathology and to identify clinicopathological correlates of these distinct proteinopathies.

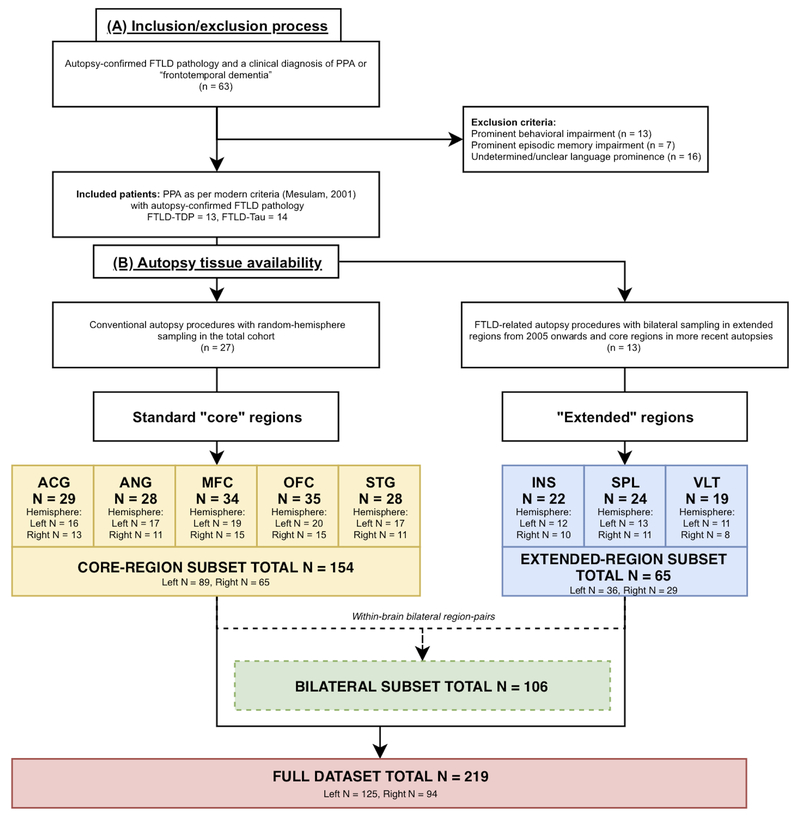
Methods: In an autopsy cohort of PPA (FTLD-TDP = 13, FTLD-Tau = 14), we analyzed laterality and regional distribution of postmortem pathology, quantified using a validated digital histopathological approach, in available brain tissue from up to 8 cortical regions bilaterally. We related digital pathology to antemortem structural neuroimaging and specific clinical language features.

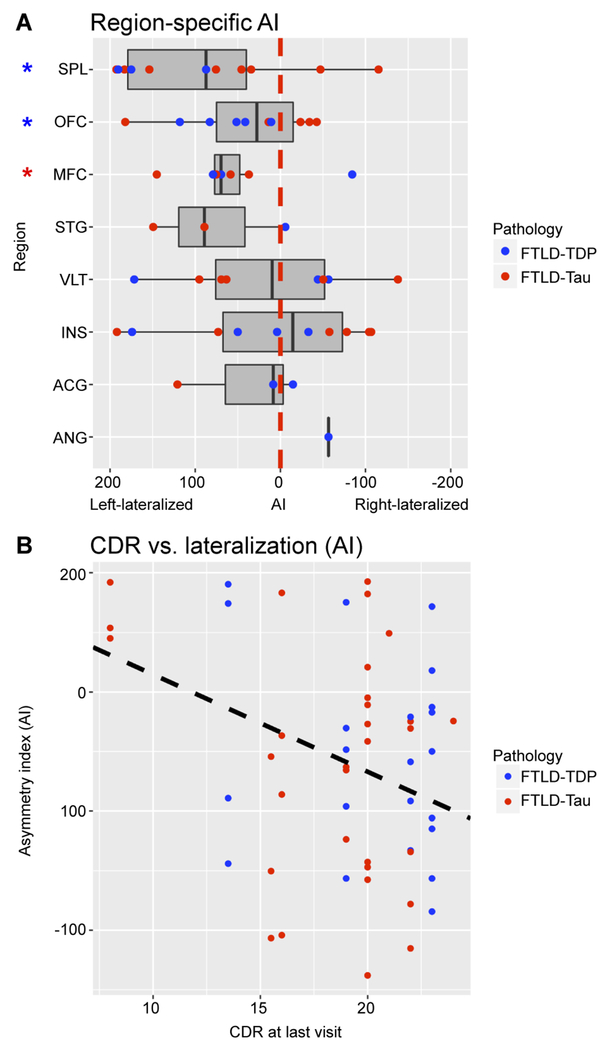
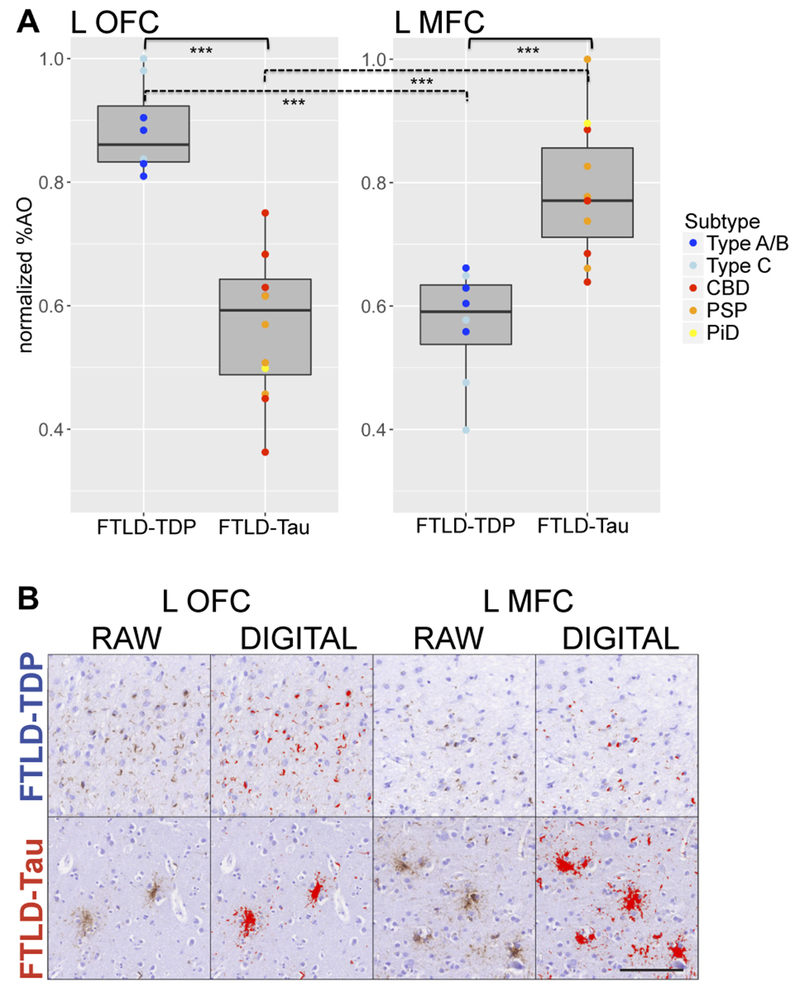
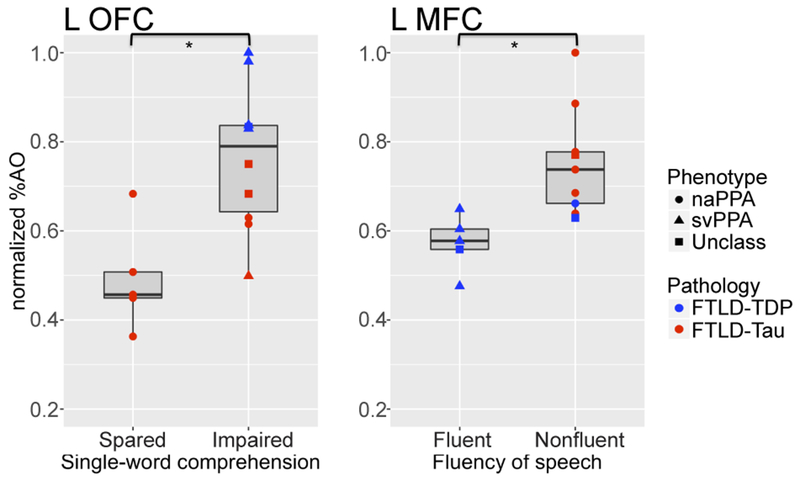
Results: Postmortem cortical pathology was left-lateralized in both FTLD-TDP (beta = -0.15, standard error [SE] = 0.05, p = 0.007) and FTLD-Tau (beta = -0.09, SE = 0.04, p = 0.015), but the degree of lateralization decreased with greater overall dementia severity before death (beta = -8.18, SE = 3.22, p = 0.015). Among 5 core pathology regions sampled, we found greatest pathology in left orbitofrontal cortex (OFC) in FTLD-TDP, which was greater than in FTLD-Tau (F = 47.07, df = 1,17, p < 0.001), and in left midfrontal cortex (MFC) in FTLD-Tau, which was greater than in FTLD-TDP (F = 19.34, df = 1,16, p < 0.001). Postmortem pathology was inversely associated with antemortem magnetic resonance imaging cortical thickness (beta = -0.04, SE = 0.01, p = 0.007) in regions matching autopsy sampling. Irrespective of PPA syndromic variant, single-word comprehension impairment was associated with greater left OFC pathology (t = -3.72, df = 10.72, p = 0.004) and nonfluent speech with greater left MFC pathology (t = -3.62, df = 12.00, p = 0.004) among the 5 core pathology regions.

Interpretation: In PPA, FTLD-TDP and FTLD-Tau have divergent anatomic distributions of left-lateralized postmortem pathology that relate to antemortem structural imaging and distinct language deficits. Although other brain regions may be implicated in neural networks supporting these complex language measures, our observations may eventually help to improve antemortem diagnosis of neuropathology in PPA. Ann Neurol 2019;85:630-643.


Conflict of interest statement

Potential Conflicts of Interest

Nothing to report.

Figures

Figure 1.
Figure 1.. Flow-chart depicting patient inclusion/exclusion and pathology data availability
Flow-chart shows (A) our inclusion/exclusion process and (B) the final availability of autopsy tissue. A: Of all patients with autopsy-confirmed FTLD pathology and a clinical diagnosis of PPA or “frontotemporal dementia” (n = 63) for those evaluated prior to modern criteria, we excluded those who did not qualify as PPA because of prominent behavioral (n = 13) or episodic memory (n = 7) impairments, or insufficient evidence to verify prominence of language impairment at onset (n = 16). Our final cohort consisted of 27 patients, of whom 13 patients with FTLD-TDP and 14 patients with FTLD-Tau. B: Available autopsy tissue included five standard “core” regions (i.e. ACG, ANG, MFC, OFC, STG), i.e. regions that were sampled at autopsy in the total cohort following conventional autopsy procedures with random hemisphere sampling (i.e. core-region subset). Additionally, our lab recently expanded pathology protocols to improve the neuropathological characterization of patients with FTLD, by collecting tissue from both hemispheres in three “extended” regions (i.e. INS, SPL, VLT) in 13 recent PPA brains (i.e. extended-region subset), and more recently implemented bilateral sampling in core regions as well. In total, we collected 219 tissue samples (i.e. full dataset), comprising tissue from core (N = 154) and extended regions (N = 65), and including the subset of bilateral data with 106 matched left-right tissue samples (i.e. bilateral subset). Legend: ACG = anterior cingulate gyrus; ANG = angular gyrus; FTLD = frontotemporal lobar degeneration; FTLD-Tau = frontotemporal lobar degeneration with inclusions of the tau protein; FTLD-TDP = frontotemporal lobar degeneration with inclusions of the transactive response DNA-binding protein 43; INS = anterior insular cortex; MFC = mid-frontal cortex; n = number of patients; N = number of slides; OFC = orbitofrontal cortex; PPA = primary progressive aphasia; SPL = superior parietal lobule; STG = superior temporal gyrus; VLT = ventrolateral temporal cortex.
Figure 2.
Figure 2.. Region-specific lateralization of cortical disease and association with clinical dementia severity
A: Box-plots depict asymmetry index (AI) values calculated in available bilaterally sampled region-pairs. An AI greater than zero (on the left side of the red dotted line) indicates left lateralization of pathology burden. Overall we find left lateralization of cortical pathology in both FTLD-TDP and FTLD-Tau, but individual and regional patient data may have variable degree of hemispheric laterality. In FTLD-TDP, OFC and SPL are significantly left-lateralized (i.e. asymmetry index > 0; p < 0.05); in FTLD-Tau, MFC is significantly left-lateralized (p < 0.05). In the figure, blue asterisks indicate significant findings in FTLD-TDP, whereas the red asterisk indicates a significant finding in FTLD-Tau. B: Scatterplot shows an inverse linear relationship between clinical dementia severity proximal to autopsy and degree of lateralization (i.e. AI) across all bilaterally sampled regions (beta = −8.18, SE = 3.22, p = 0.015). Data were analyzed using LME analysis to account for interdependency of multiple measurements from the same individuals. Legend: ACG = anterior cingulate gyrus; AI = asymmetry index; ANG = angular gyrus; CDR = Clinical Dementia Rating including FTD subfields; FTLD-Tau = frontotemporal lobar degeneration with inclusions of the tau protein; FTLD-TDP = frontotemporal lobar degeneration with inclusions of the transactive response DNA-binding protein 43; INS = anterior insular cortex; MFC = mid-frontal cortex; OFC = orbitofrontal cortex; PPA = primary progressive aphasia; SPL = superior parietal lobule; STG = superior temporal gyrus; VLT = ventrolateral temporal cortex.
Figure 3.
Figure 3.. Regional distribution of pathology in five standard core regions in FTLD-TDP and FTLD-Tau in left and right hemispheres
Heat-map portrays regional distribution of cortical pathology in left and right hemispheres in FTLD-TDP (blue) and FTLD-Tau (red). Here we display regional least-square means of normalized %AO from LME within-group regional analysis in five standard core regions. A: In the left hemisphere, we found greatest core-region pathology in left OFC in FTLD-TDP and left MFC in FTLD-Tau. B: In the right hemisphere, we found similar findings of greatest core-region pathology in right OFC in FTLD-TDP and right MFC in FTLD-Tau. Regions of greatest core-region pathology in each hemisphere are marked with an asterisk (*). Legend: ACG = anterior cingulate gyrus; ANG = angular gyrus; FTLD-Tau = frontotemporal lobar degeneration with inclusions of the tau protein; FTLD-TDP = frontotemporal lobar degeneration with inclusions of the transactive response DNA-binding protein 43; MFC = mid-frontal cortex; normalized %AO = percentage area occupied by pathology after normalization [0;1]; OFC = orbitofrontal cortex; STG = superior temporal gyrus.
Figure 4.
Figure 4.. Regional comparisons of cortical neuropathological burden in greatest core-region pathology regions
A: Boxplots portray direct within-group and between-group comparisons of cortical pathology (i.e. normalized %AO) in greatest core-region pathology regions. Within FTLD-TDP, left OFC had greater pathology than left MFC (p < 0.001), whereas within FTLD-Tau, left MFC had greater pathology than left OFC (p < 0.001). Between pathologies, FTLD-TDP had greater pathology in left OFC than FTLD-Tau (mean FTLD-TDP = 0.88 ± 0.07; mean FTLD-Tau = 0.57 ± 0.11; F = 47.07, df = 1,17, p < 0.001), whereas FTLD-Tau had greater pathology in left MFC than FTLD-TDP (mean FTLD-TDP = 0.57 ± 0.09; mean FTLD-Tau = 0.79 ± 0.11; F = 19.34, df = 1,16, p < 0.001). Sub-analyses showed consistent results across pathology subtypes. Here, digital pathology measurements are color-coded by pathology subtypes. Significant findings with p < 0.001 are marked with three asterisks (***). B: Images show pathology burden in left OFC and left MFC comparatively in a case of FTLD-TDP type A with a GRN mutation and clinical svPPA and in a case of FTLD-Tau PSP with naPPA (scale bar = 100 μm). We include both raw images with immunohistochemical staining of TDP-43 (rat monoclonal TAR5P-1D3, p409/410; Ascenion) and tau (AT8; Millipore), as well as digital images with thresholding parameters for digital detection of TDP-43 and tau inclusions. While the FTLD-TDP case has relatively high burden of TDP-43 inclusions in OFC and relatively low burden in MFC, the FTLD-Tau case has relatively low burden of tau inclusions in OFC and relatively high burden in MFC. Legend: CBD = corticobasal degeneration; FTLD-Tau = frontotemporal lobar degeneration with inclusions of the tau protein; FTLD-TDP = frontotemporal lobar degeneration with inclusions of the transactive response DNA-binding protein 43; L = left; MFC = mid-frontal cortex; normalized %AO = percentage area occupied by pathology after normalization [0;1]; OFC = orbitofrontal cortex; PiD = Pick’s disease; PSP = progressive supranuclear palsy; Type A/B, Type C = FTLD-TDP subtypes.
Figure 5.
Figure 5.. MRI cortical thinning is reflective of cortical neuropathological burden at autopsy
A: Scatterplot portrays a significant negative relationship between pathology burden (i.e. normalized %AO) and cortical thickness z-scores from antemortem MRI in regions matching autopsy sampling across pathology groups (beta = −0.04, SE = 0.01, p = 0.007). The fit line represents the linear association between cortical thickness z-scores (x-axis) and normalized %AO (y-axis) in corresponding regions, and has been derived in a linear mixed effects model accounting for multiple measurements from the same patient as well as one covariate (i.e. time from scan to autopsy), which may confound the linear association between the two measurements. Data points are color-coded by pathology (i.e. FTLD-TDP = blue, FTLD-Tau = red). B: Heat-map shows relative MRI cortical thinning in left-hemisphere ROIs matching five standard core regions sampled at autopsy in FTLD-TDP and FTLD-Tau. Regions are color-coded by relative severity of cortical thinning as compared to healthy controls (scale bars = z-scores) within pathology groups. Group means are obtained from 11 patients (5 FTLD-TDP, 6 FTLD-Tau) with available antemortem structural MRI. Among these core ROIs, FTLD-TDP has greatest core-region atrophy in left OFC (mean = −3.78 ± 2.25), while FTLD-Tau has greatest core-region atrophy in left MFC (mean = −2.10 ± 1.53), validating our postmortem findings. Regions of greatest core-region atrophy are marked with an asterisk (*). Legend: FTLD-Tau = frontotemporal lobar degeneration with inclusions of the tau protein; FTLD-TDP = frontotemporal lobar degeneration with inclusions of the transactive response DNA-binding protein 43; normalized %AO = percentage area occupied by pathology after normalization [0;1].
Figure 6.
Figure 6.. Clinicopathological associations of left-hemisphere greatest core-region pathology regions with clinical language features
Boxplots show correlations of cortical pathology burden (i.e. normalized %AO) in greatest core-region pathology regions with clinical language features. Data points are color-coded by pathology group (i.e. FTLD-TDP = blue, FTLD-Tau = red) and shape-coded by clinical phenotype (i.e. circle = naPPA, triangle = svPPA, square = unclassifiable with mixed features). Irrespective of PPA clinical variant, patients with single-word comprehension impairment in late disease (i.e. >3 years after onset) had more severe cortical disease in left OFC than patients with sparing of this language function (t = −3.72, df = 10.72, p = 0.004); patients with nonfluent speech in early disease (i.e. 0-3 years after onset) had more severe cortical disease in left MFC than patients with fluent speech (t = −3.62, df = 12.00, p = 0.004). Statistical significance (p < 0.05) is indicated with an asterisk (*). Legend: FTLD-Tau = frontotemporal lobar degeneration with inclusions of the tau protein; FTLD-TDP = frontotemporal lobar degeneration with inclusions of the transactive response DNA-binding protein 43; MFC = mid-frontal cortex; naPPA = nonfluent/agrammatic variant of primary progressive aphasia; normalized %AO = percentage area occupied by pathology after normalization [0;1]; OFC = orbitofrontal cortex; svPPA = semantic variant of primary progressive aphasia; Unclass = unclassifiable primary progressive aphasia with concurrent nonfluent/agrammatic and semantic features.

Similar articles

Cited by

References

    1. Mesulam MM. Primary progressive aphasia. Ann. Neurol 2001;49(4):425–432. - PubMed
    1. Grossman M. Primary progressive aphasia: clinicopathological correlations. Nat. Rev 2010;6(2):88–97. - PMC - PubMed
    1. Mesulam MM, Weintraub S, Rogalski EJ, et al. Asymmetry and heterogeneity of Alzheimer’s and frontotemporal pathology in primary progressive aphasia. Brain 2014;137(4):1176–1192. - PMC - PubMed
    1. Giannini LAA, Irwin DJ, Mcmillan CT, et al. Clinical marker for Alzheimer disease pathology in logopenic primary progressive aphasia. Neurology 2017;88(24):2276–2284. - PMC - PubMed
    1. Spinelli EG, Mandelli ML, Miller ZA, et al. Typical and atypical pathology in primary progressive aphasia variants. Ann. Neurol 2017;81(3):430–443. - PMC - PubMed

Publication types