. 2019 Jun 7:470:20-29.
doi: 10.1016/j.jtbi.2019.03.004. Epub 2019 Mar 6.

Increased infection severity in downstream cities in infectious disease transmission and tourists surveillance analysis

Affiliations

Increased infection severity in downstream cities in infectious disease transmission and tourists surveillance analysis

Nan Zhang et al. J Theor Biol. .

Abstract

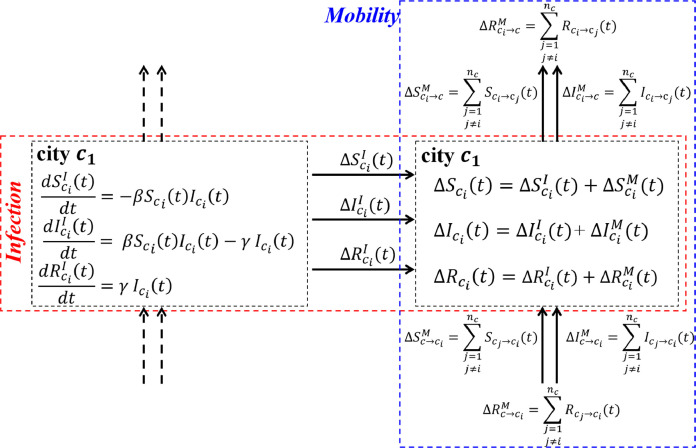
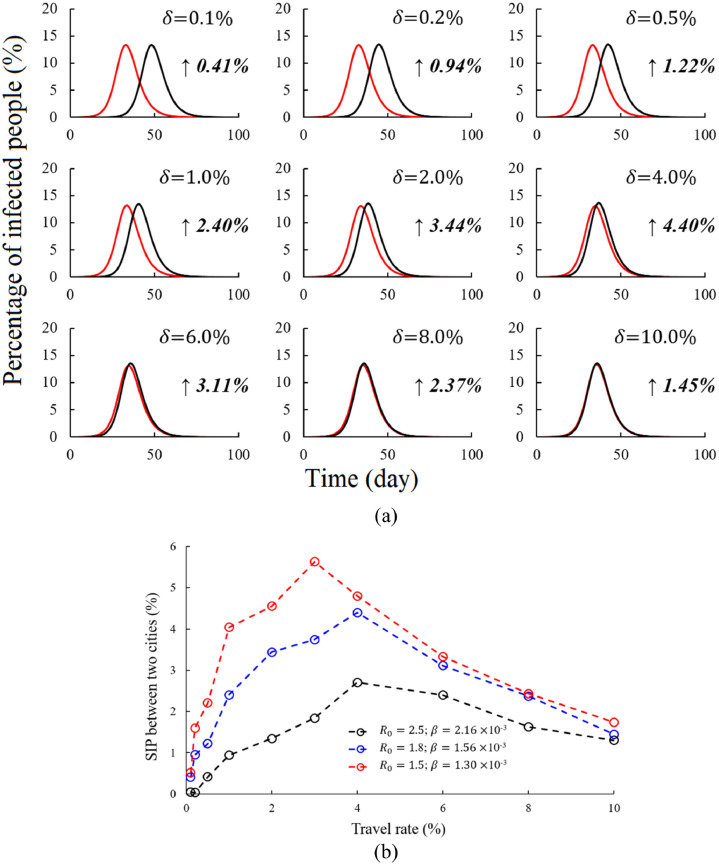
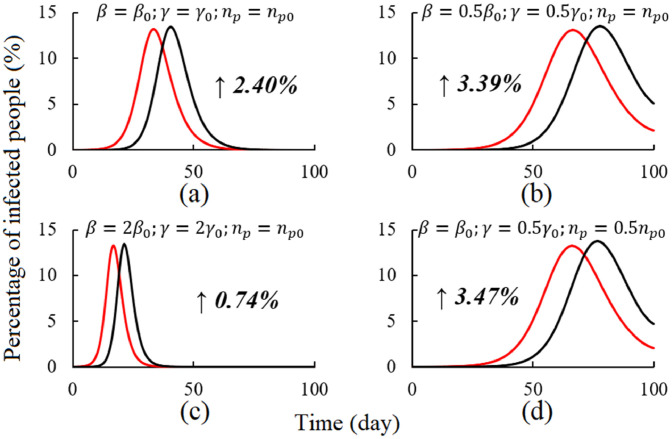
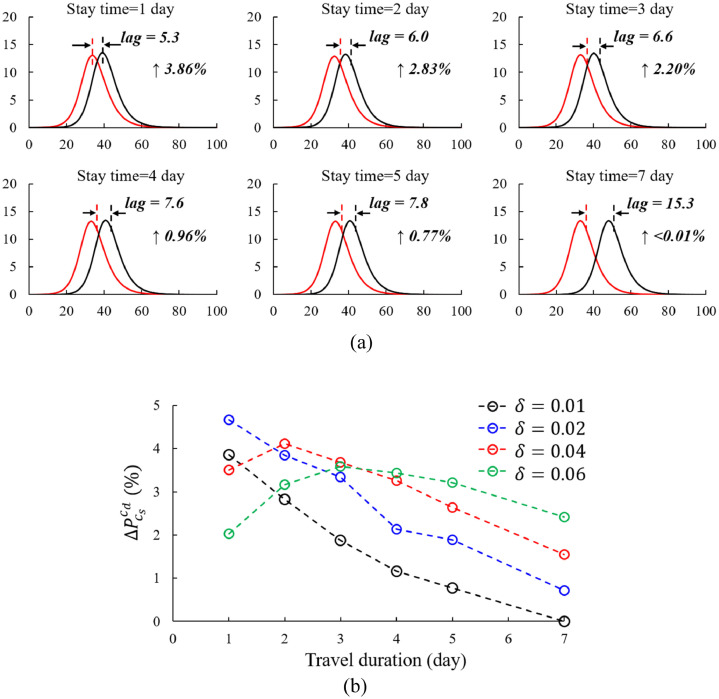
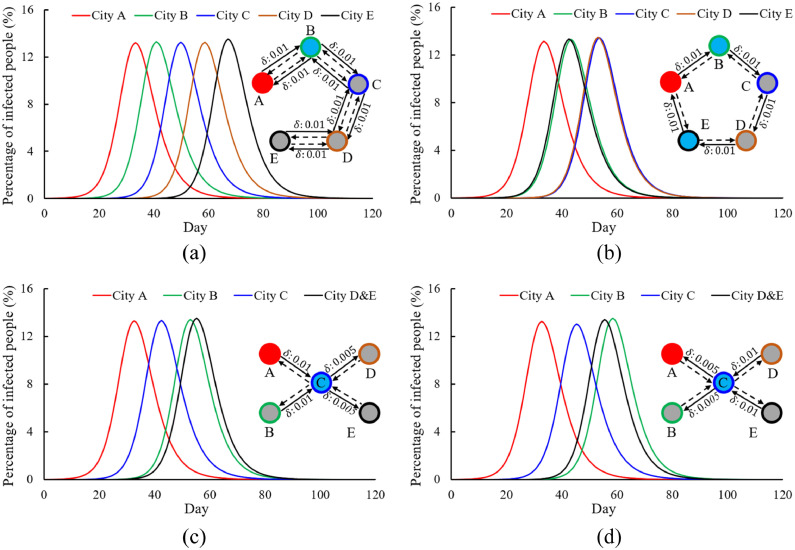
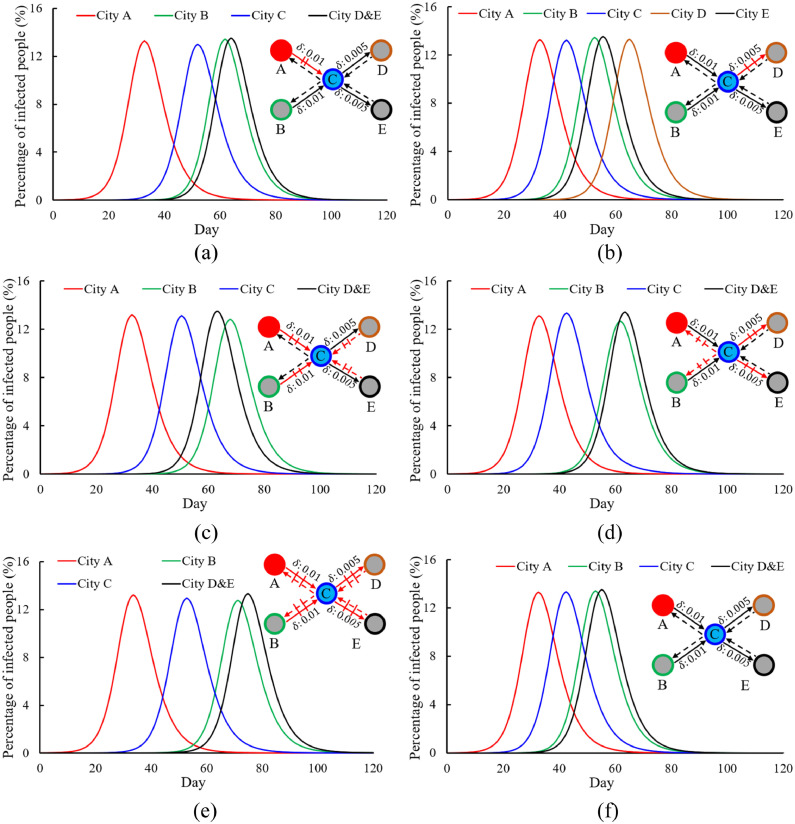
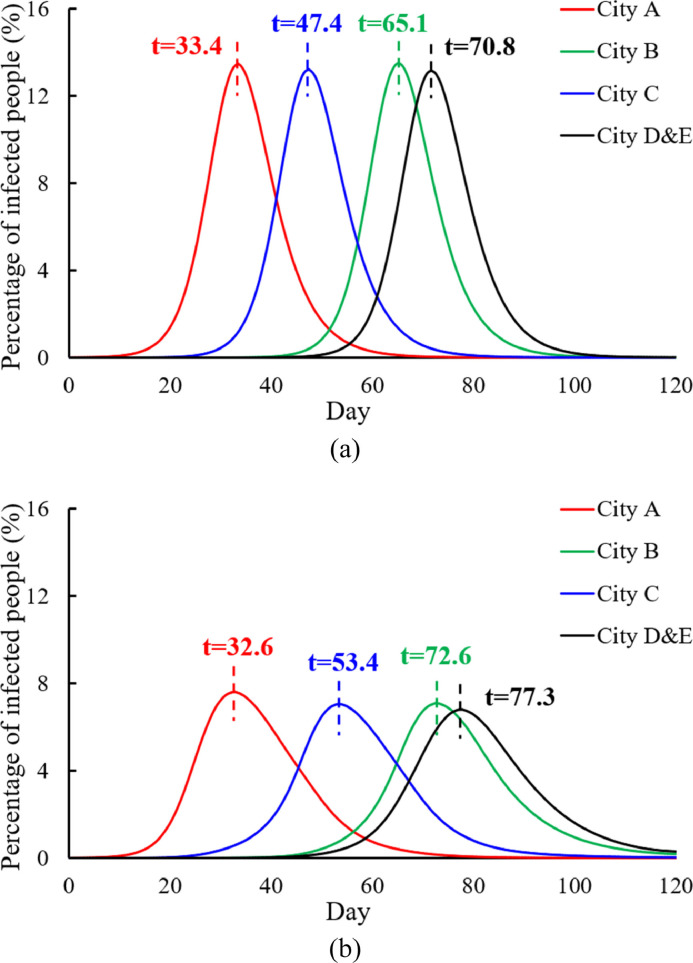
Infectious disease severely threatens human life. Human mobility and travel patterns influence the spread of infection between cities and countries. We find that the infection severity in downstream cities during outbreaks is related to transmission rate, recovery rate, travel rate, travel duration and the average number of person-to-person contacts per day. The peak value of the infected population in downstream cities is slightly higher than that in source cities. However, as the number of cities increases, the severity increase percentage during outbreaks between end and source cities is constant. The surveillance of important nodes connecting cities, such as airports and train stations, can help delay the occurrence time of infection outbreaks. The city-entry surveillance of hub cities is not only useful to these cities, but also to cities that are strongly connected (i.e., have a high travel rate) to them. The city-exit surveillance of hub cities contributes to other downstream cities, but only slightly to itself. Surveillance conducted in hub cities is highly efficient in controlling infection transmission. Only strengthening the individual immunity of frequent travellers is not efficient for infection control. However, reducing the number of person-to-person contacts per day effectively limits the spread of infection.

Keywords: City; Human mobility; Infectious disease transmission; SIR model; Severity increase percentage; Travel pattern.


Figures

Fig. 1.
Fig. 1
Multi-city travel SIR model. *Sci(t), Ici(t) and Rci(t) represent, respectively, the number of susceptible (S), infected (I) and recovered (R) people in city i at time t; β is the transmission rate; γ is the recovery rate; ΔSciI(t), ΔIciI(t) and ΔRciI(t) represent, respectively, the variations in S, I and R caused by infection in city i at time t; ΔSciM(t), ΔIciM(t) and ΔRciM(t) represent, respectively, the variations in S, I and R caused by human mobility at time t; nc is the total number of cities; jij=1ncScjci(t), jij=1ncIcjci(t) and jij=1ncRcjci(t) represent, respectively, the S, I and R inflows from other cities to city i at time t; and jij=1ncScicj(t), jij=1ncIcicj(t) and jij=1ncRcicj(t) represent, respectively, the S, I and R outflows from city i to other cities at time t.
Fig. 2.
Fig. 2
Infectious disease transmission at different travel rates. (a) R0=1.8. The red line depicts the source city and the black line depicts the downstream city; the x-axis shows the time (day); the y-axis shows the percentage of infected people; and the number on the right side of the figure is the value of ΔPcscd. (b) Different values of R0 (1.5, 1.8 and 2.5)*. * With different values of R0, np and γ remain constant and only β changes.
Fig. 3.
Fig. 3
Infectious disease transmission at different transmission rate (β), recovery rates (γ) and average number of person-to-person contacts per day (np) under R0=1.8. (a) β=β0, γ=γ0and np=np0. (b) β=0.5β0, γ=0.5γ0and np=np0. (c) β=2β0, γ=2γ0and np=np0. (d) β=β0, γ=0.5γ0and np=0.5np0. The red line depicts the source city and the black line depicts the downstream city; the x-axis shows the time (day); the y-axis shows the percentage of infected people; and the number on the right side of the figure is the value of ΔPcscd. *β0, γ0 and np0 are the defaults (β0=1.56×10³, γ0=4.17×10² and np0=400, respectively). Detailed information is provided in Section 2.2.
Fig. 4.
Fig. 4
Infectious disease transmission with different travel durations (tT) under (a) δ=1% and (b) δ=16%.
Fig. 5.
Fig. 5
Impacts of the travel patterns between five cities on infectious disease transmission. The red round border represents source city A. The green, blue, brown and black round borders represent cities B, C, D and E, respectively. The black solid lines represent the flow of tourists from their home cities to other cities and the black dashed lines represent the flow of tourists returning from other cities to their home cities. The red solid circles represent the source city, the sky blue solid circles represent the first downstream cities that are directly linked to the source city and the grey circles represent the second or higher-level downstream cities that are indirectly linked to the source city. (a) Unidirectional travel (A→B→C→D→E). (b) Circular travel (A→B→C→D→E→A). (c) A/BCD/E*. (d) D/ECA/B. * When cities D and E have the same infectious disease transmission characteristics, the black curves are used to show the average value of infected people in cities D and E.
Fig. 6.
Fig. 6
Infectious disease transmission between five cities under a specific travel pattern (A/BCD/E)*1 with different surveillance strategies (surveillance rate⁎2 = 90%). The black solid lines represent the flow of tourists from their home cities to other cities and the black dashed lines represent the flow of tourists returning from other cities to their home cities. The red solid/dashed lines show the monitored route. (a) Source city A exit surveillance. (b) Second downstream city D entry surveillance. (c) Hub city C entry surveillance. (d) Hub city C exit surveillance. (e) Both hub city C entry and exit surveillance. (f) No surveillance. *1δAC=δBC=1%; δCD=δCE=0.5%. ⁎2 A 90% surveillance rate means that 90% of infected tourists are monitored when they move between cities. These people are isolated in hospitals and then leave from the hospital upon recovery.
Fig. 7.
Fig. 7
Dynamic intervention strategies under the travel pattern A/BCD/E. (a) Travel rate control*1. (b) Person-to-person contact control⁎2. *1 The travel rate changes with the severity of infectious disease and agrees with δ(t)=0.010.1×Ic,max(t)Nc(t), where Ic, max is the maximum number of infected people in one city out of all cities at time t, Nc is the current population in the city that has the maximum number of infected people at time t and δ(t) is the travel rate at time t. The travel rate monotonically linearly decreases from 1% to 0% when the percentage of the infected population in the most severely affected city increases from 0% to 10%. When Ic,max(t)Nc(t)>0.1, no people travel (δ(t)=0). ⁎2 The average number of person-to-person contacts per day (np) changes with the severity of infectious disease and agrees with np(t)=np×[0.29Ic,max(t)Nc(t)]0.28, 0.01Ic,max(t)Nc(t)0.15, where np is the default number of person-to-person contacts per day (400 in this study). When more than 1% of people are infected in a city, the contact behaviour between people is limited. nP is halved when more than 15% of people are infected in the most severely affected city. nP monotonically linearly decreases from np to np/2 when Ic,max(t)Nc(t) increases from 0.01 to 0.15.

Similar articles

Cited by

References

    1. Balcan D., Hu H., Goncalves B. Seasonal transmission potential and activity peaks of the new influenza A (H1N1): a Monte Carlo likelihood analysis based on human mobility. BMC Med. 2009;7(1):45. - PMC - PubMed
    1. Barmak D.H., Dorso C.O., Otero M. Modelling dengue epidemic spreading with human mobility. Physica A. 2016;447:129–140.
    1. Centers for Disease Control and Prevention (CDC) Update: swine influenza A (H1N1) infections – California and Texas, April 2009. MMWR. 2009;58(16):435. 2009, PMID: 19407739. - PubMed
    1. Centers for Disease Control and Prevention (CDC) 2010. H1N1 flu (Swine Flu): past situation updates.
    2. (Accessed April 2018). Available from https://www.cdc.gov/h1n1flu/updates/.

    1. Charu V., Zeger S., Gog J. Human mobility and the spatial transmission of influenza in the United States. PLoS Comput. Biol. 2017;13(2) - PMC - PubMed

Publication types