. 2019 May 15:192:178-194.
doi: 10.1016/j.neuroimage.2019.03.001. Epub 2019 Mar 6.

Predictive model of spread of Parkinson's pathology using network diffusion

Affiliations

Predictive model of spread of Parkinson's pathology using network diffusion

S Pandya et al. Neuroimage. .

Abstract

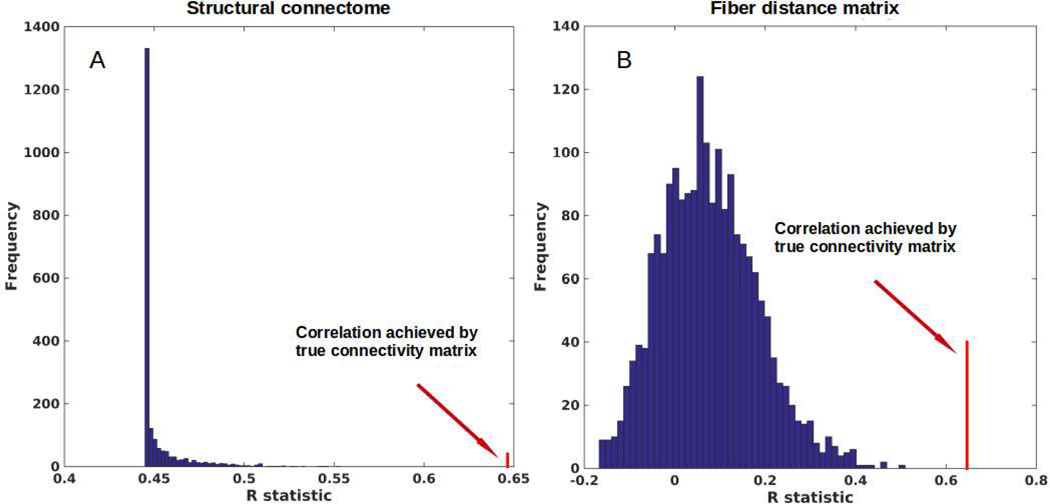
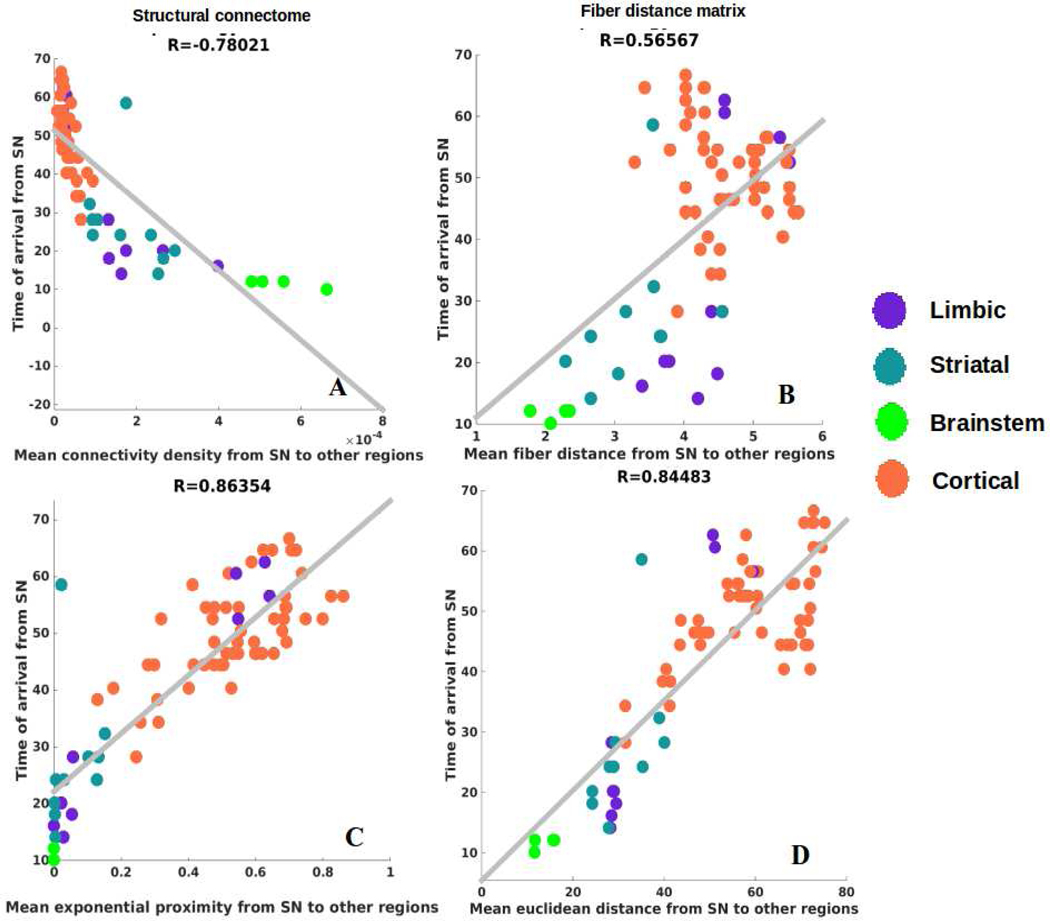
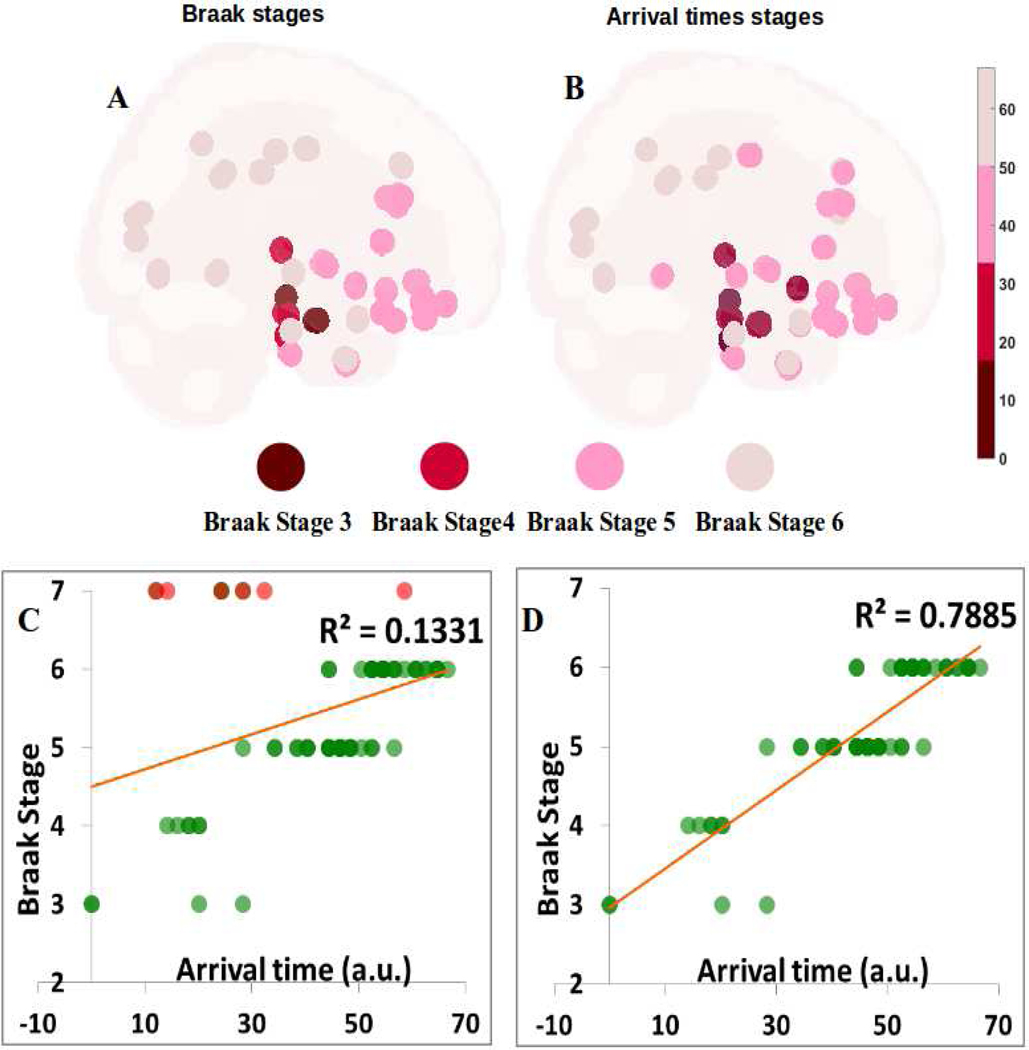
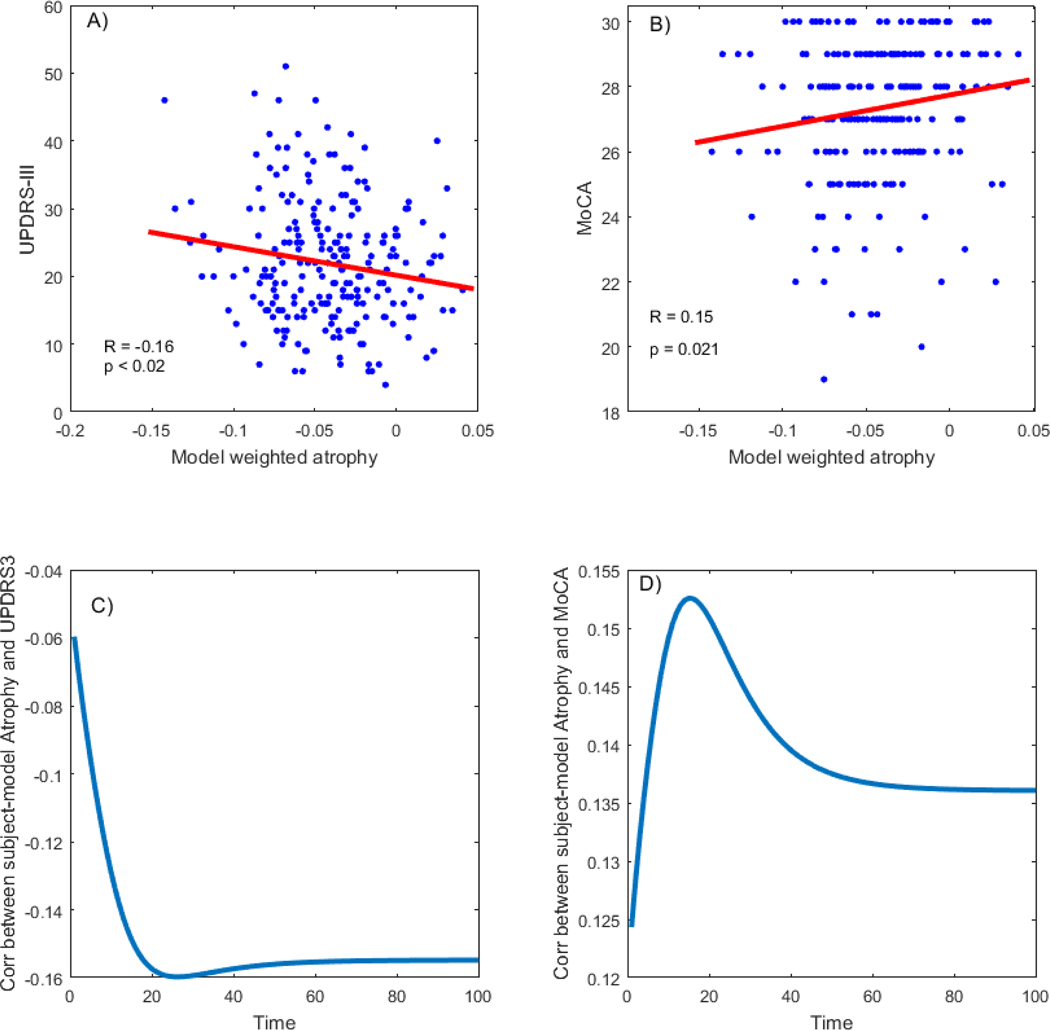
Growing evidence suggests that a "prion-like" mechanism underlies the pathogenesis of many neurodegenerative disorders, including Parkinson's disease (PD). We extend and tailor previously developed quantitative and predictive network diffusion model (NDM) to PD, by specifically modeling the trans-neuronal spread of alpha-synuclein outward from the substantia nigra (SN). The model demonstrated the spatial and temporal patterns of PD from neuropathological and neuroimaging studies and was statistically validated using MRI deformation of 232 Parkinson's patients. After repeated seeding simulations, the SN was found to be the most likely seed region, supporting its unique lynchpin role in Parkinson's pathology spread. Other alternative spread models were also evaluated for comparison, specifically, random spread and distance-based spread; the latter tests for Braak's original caudorostral transmission theory. We showed that the distance-based spread model is not as well supported as the connectivity-based model. Intriguingly, the temporal sequencing of affected regions predicted by the model was in close agreement with Braak stages III-VI, providing what we consider a "computational Braak" staging system. Finally, we investigated whether the regional expression patterns of implicated genes contribute to regional atrophy. Despite robust evidence for genetic factors in PD pathogenesis, NDM outperformed regional genetic expression predictors, suggesting that network processes are far stronger mediators of regional vulnerability than innate or cell-autonomous factors. This is the first finding yet of the ramification of prion-like pathology propagation in Parkinson's, as gleaned from in vivo human imaging data. The NDM is potentially a promising robust and clinically useful tool for diagnosis, prognosis and staging of PD.

Keywords: Network diffusion; Parkinson's disease; Prions; Substantia nigra; Synuclein.


Figures

Figure 1:
Figure 1:. Spatial distribution of PD atrophy.
Measured regional PD atrophy are depicted by “glass brain” visualization, with spheres placed at the centroid of each brain region, and their diameter proportional to effect size.
Figure 2:
Figure 2:. Correlations of PD atrophy with network and non-network metrics.
Scatter plot of mean connectivity, fiber distance, and Euclidian distance from SN versus empirical PD atrophy. Dots are color coded by lobe – supratentorial = purple and brainstem = green.
Figure 3:
Figure 3:. Results for repeated seeding analysis.
Each region was seeded in turn and network diffusion model was played out for all time points. Pearson’s R was recorded at each time point between the model and PD atrophy vector. As the diffusion time increases, more and more of the pathogenic agent escapes the seed region and enters the rest of the network. A: The point of maximum correlation with measured atrophy using structural connectome was recorded with glassbrains of measured R shown inset B: Maximum correlation strength for bilaterally seeded ROIs. The maximum correlations are achieved by seeding the substantia nigra. The fact that SN achieves the best performance in almost all these seeding experiments provides a level of validation of the ND model, since nigral origin is a universal hallmark of classic Parkinson’s disease. C: ND model seeded at bilateral regions using structural connectome indicates that the SN (shown by red curve) is the most plausible candidate for Parkinson’s disease seeding – it has the highest peak R, and the characteristic intermediate peak indicative of true pathology spread. D: ND model seeded at the bilateral SN using fiber distance connectivity matrix yields the best R curve of all, indicating that it is the most plausible seed region for Parkinson’s disease spread.
Figure 4:
Figure 4:. A: ND prediction from bilaterally seeded SN at tmax = 19.
Glassbrains of network diffusion model seeded at the bilateral SN at tmax = 19 shows spatial evolution of Parkinson’s from SN to connected striatal areas, especially RN and STN shown in green, and limbic areas like amygdala, hippocampus, and thalamus shown in purple. The next regions to be affected includecaudoputamen, accumbens and globus pallidus shown in cyan. Finally, the NDM predicts spread to wider cortices, especially inferotemporal and middle temporal regions as shown in coral. B: Spatiotemporal evolution of model Parkinson’s pathology. Evolution of SN-seeded network diffusion exhibits the classic striatal and limbic areas as early affected regions, followed by somewhat slower diffusion into the caudate and inferotemporal gyrus. This temporal sequencing predicted by the model is a close match with Parkinson’s progression, assuming that spread into limbic regions, typically in dementia with Lewy bodies and PD with dementia, are part of the same continuum as classic Parkinson’s.
Figure 5:
Figure 5:. Scrambled networks and PD atrophy.
A: Histogram of correlation strength between ND model and PD data over 2000 shuffled networks. B: Histogram of correlation strength between ND model and 2000 shuffled PD data over using unshuffled structural connectome. The true connectome was shuffled by symmetrically permuting its rows and columns randomly, and the ND model was evaluated for each shuffled network after bilateral SN seeding. The best R achieved by each model was recorded and entered into the histogram. The null models are distributed well below the true model, indicating that the latter is highly unlikely to arise by chance (p < 0.05).
Figure 6:
Figure 6:. Association between pathology arrival time, connectivity and distance from SN to other regions.
A: Arrival time vs connectivity from SN to other regions. The curve appears to describe an exponential decay of arrival with increase in connectivity from SN. B,D: Linear association between arrival time and distances from SN. C: Linear association between arrival time and exp(−connectivity). The slight improvement in R from panel A to panel C suggests that the exponential decay assumption has merit.
Figure 7:
Figure 7:. Braak staging and Arrival time predicting the Braak staging of Lewy pathology in PD from SN-seeding.
A: The Braak stage from 3–6 for each of the 78 non-cerebellar, non-brainstem structures available in our atlas. We can see that Stage 3 which is indicated by dark red starts with SN and amygdala, to Stage 4 with blood red spheres showing temporal mesocortical involment, and finally to Stage 5 and 6 showing most of the neocortex. Color sphere represents stage 4–6 of the Braak’s staging. B: Comparison of the Braak stage against NDM’s arrival time. We can see that arrival time can also predict the classic Braak stages of Lewy pathology as it involves many structures which are known to be sites of PD pathology. Color sphere represents time of arrival through stage 4–6 of the Braak’s staging. Scale represents time of arrival range, ranging from 0–67. C, D: Correlations between Braak and NDM arrival time with (C) and without (D) the striatum and RN with SN seeding. Correlation in (C) shows the striatal areas in red are clear outliers and by removing them we obtain a better correlation (R2 = 0.79, p < 1e-6) between NDM arrival time and Braak stages.
Figure 8:
Figure 8:. Discrepancies between PD regional atrophy, Braak staging and the proposed “computational Braak” staging based on the NDM.
A: Glass-brain rendering of the residuals of a linear fit between empirical regional atrophy and Braak stages. Spheres are color coded by residual value – negative in green (empirical atrophy is less than that predicted by Braak) and positive in red. Only the top most discrepant regions are shown. Braak staging shows a systematic bias, under-estimating the cell loss seen in the striatum and brainstem. B: Residuals of a linear fit between Braak stages and the NDM-predicted arrival time from the SN. Negative residuals are shown in green (empirical Braak is less than that predicted by NDM arrival time) and positive in red. Clearly, the proposed computational Braak staging via NDM arrival time under-estimates empirical Braak stage in the striatum, where NDM predicts early stage in the striatum whereas Braak reported little early synuclein in the striatum. A comparison with panel A suggests that the discrepancy between NDM arrival time and Braak in the striatum is reflective of the discrepancy between striatal atrophy and its Braak stage (panel A). Hence the proposed computational Braak staging may be considered a more relevant staging system for PD-related atrophy.
Figure 9:
Figure 9:. Network diffusion is a more important predictor of atrophy than genetic expression profiles.
(A) Cross-validated L1 regularized regression coefficients as a function of tuning parameter λ for a model containing both SN and amygdala NDM predictors; and expression profiles for genes implicated in trans-synaptic alpha-synuclein transfer. Both NDM predictors, and expression profiles of LAG3 and NRXN1 have non-zero coefficients at minimum model MSE, indicating that these are important predictive variables. (C) Regression coefficients for a model containing both NDM predictors and expression profiles for genes from other functional classes. Both NDM predictors, and expression profiles of BST1, STK39, LRRK2 and PARK7 have non-zero coefficients at minimum model MSE. Both NDM predictors are the only variables retained at very high values of λ in both models. (B, D) Ten-fold cross validated mean squared error curves for the corresponding models in A and C, respectively.
Figure 10:
Figure 10:. PD atrophy on individual subjects with NDM.
A: Histogram of maximum R achieved from all ROIs seeded bilaterally from each individual subjects. Single Rmax is obtained from 232 individuals from all bilaterally seeded ROIs. Rmax is well distributed with mean Rmax ~ 0.41 demonstrating that NDM can reproduce PD atrophy in most of the subjects. B: Maximum R achieved from four major regions (limbic = purple, striatal = cyan, midbrain = green, and cortex = coral) from individual subjects. Rmax values were attained for each of these regions from 232 individual subjects. We can see that for most of the subjects’ maximum R was achieved from the midbrain (yellow bars) compared to other regions. C: Count of number of times a specific ROI was identified with maximum R. We can see that midbrain regions (–39) were identified with maximum R multiple times than other regions. Red nucleus (RN) occurred the most followed by substantia nigra (SN) and subthalamic nucleus (STN).
Figure 11:
Figure 11:. Association between PD-related deformation score and disease severity,
A: PD-related deformation is significantly correlated with motor related disease severity (r = −0.16, p<0.02). The higher the model weighted atrophy in the brain (more negative score), the higher the disease severity score B: PD-related deformation is significantly correlated with cognitive related disease severity (r = 0.15, p=0.021). The higher the model weighted atrophy in the brain, the lower the cognitive score. C: Correlation between UPDRS-III and model-weighted atrophy over time D: Correlation between MoCA and model-weighted atrophy over time.

Similar articles

Cited by

References

    1. Poewe WH, Wenning GK. The natural history of Parkinson’s disease. Ann Neurol. 2006;44(3 Suppl 1):VII2–I6. - PubMed
    1. Jellinger KA. Alpha-synuclein pathology in Parkinson’s and Alzheimer’s disease brain: incidence and topographic distribution--a pilot study. Acta Neuropathol [Internet] 2003. September [cited 2013 Apr 15];106(3):191–201. Available from: http://www.ncbi.nlm.nih.gov/pubmed/12845452 - PubMed
    1. Braak H, Del Tredici K, Rüb U, de Vos RAI, Jansen Steur ENH, Braak E. Staging of brain pathology related to sporadic Parkinson’s disease. Neurobiol Aging [Internet] 2003. [cited 2012 Nov 13];24(2):197–211. Available from: http://www.ncbi.nlm.nih.gov/pubmed/12498954 - PubMed
    1. Del Tredici K, Braak H. Review: Sporadic Parkinson’s disease: development and distribution of α-synuclein pathology. Neuropathol Appl Neurobiol [Internet] 2016. February;42(1):33–50. Available from: http://doi.wiley.com/10.1111/nan.12298 - DOI - PubMed
    1. Luk KC, Kehm V, Carroll J, Zhang B, O’Brien P, Trojanowski JQ, et al. Pathological-Synuclein Transmission Initiates Parkinson-like Neurodegeneration in Nontransgenic Mice. Science (80- ) [Internet] 2012. November 15 [cited 2012 Nov 15];338(6109):949–53. Available from: http://www.sciencemag.org/cgi/doi/10.1126/science.1227157 - DOI - PMC - PubMed

Publication types

MeSH terms

Substances