. 2019 Apr;21(4):363-375.
doi: 10.1016/j.neo.2019.01.007. Epub 2019 Mar 7.

Blocking Mitotic Exit of Ovarian Cancer Cells by Pharmaceutical Inhibition of the Anaphase-Promoting Complex Reduces Chromosomal Instability

Affiliations

Blocking Mitotic Exit of Ovarian Cancer Cells by Pharmaceutical Inhibition of the Anaphase-Promoting Complex Reduces Chromosomal Instability

Monika Raab et al. Neoplasia. 2019 Apr.

Abstract

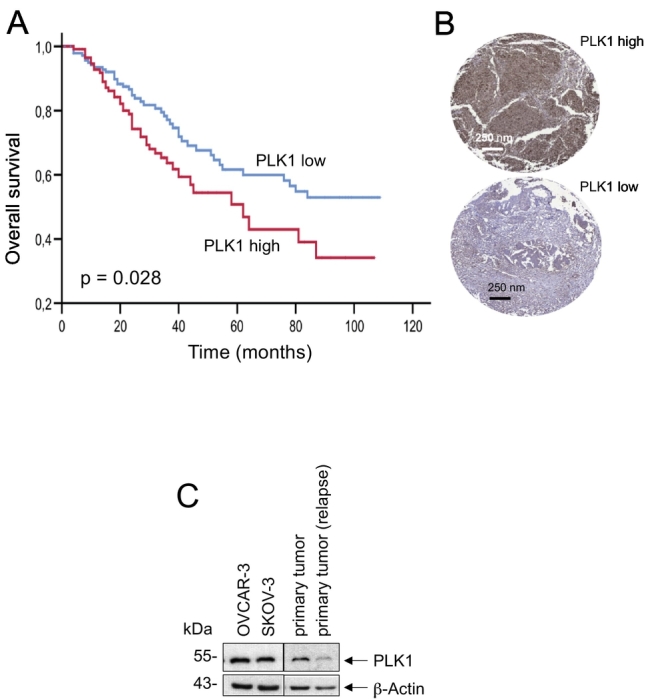
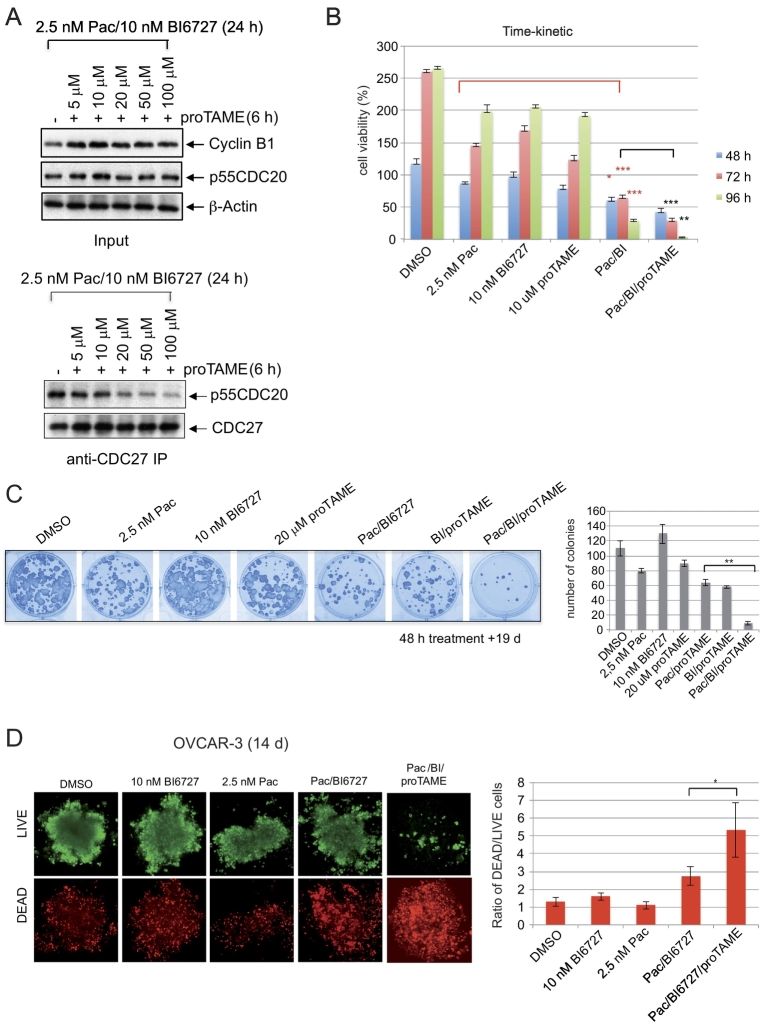
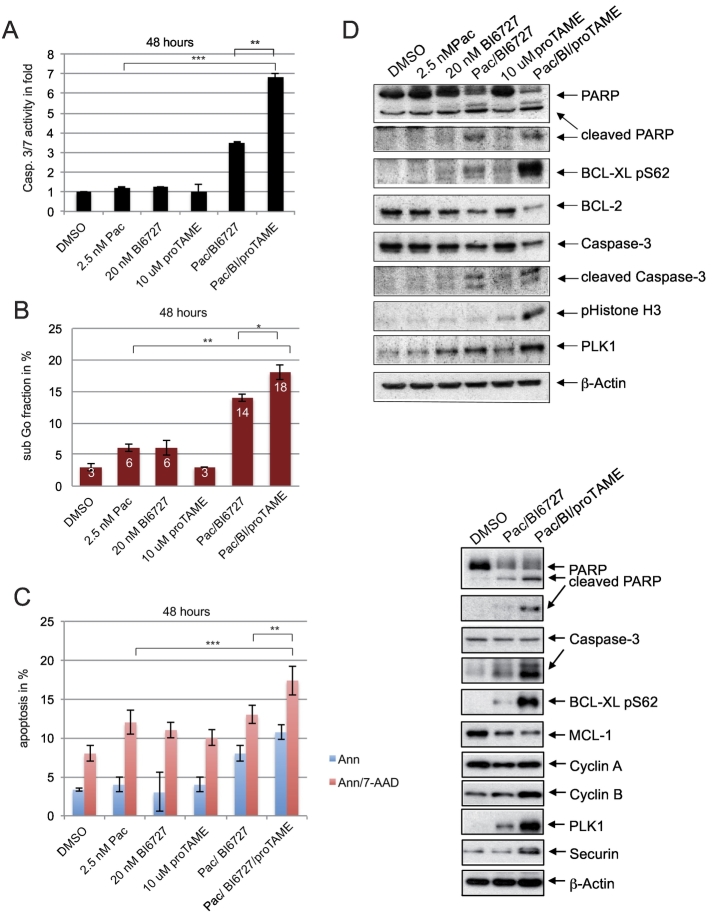
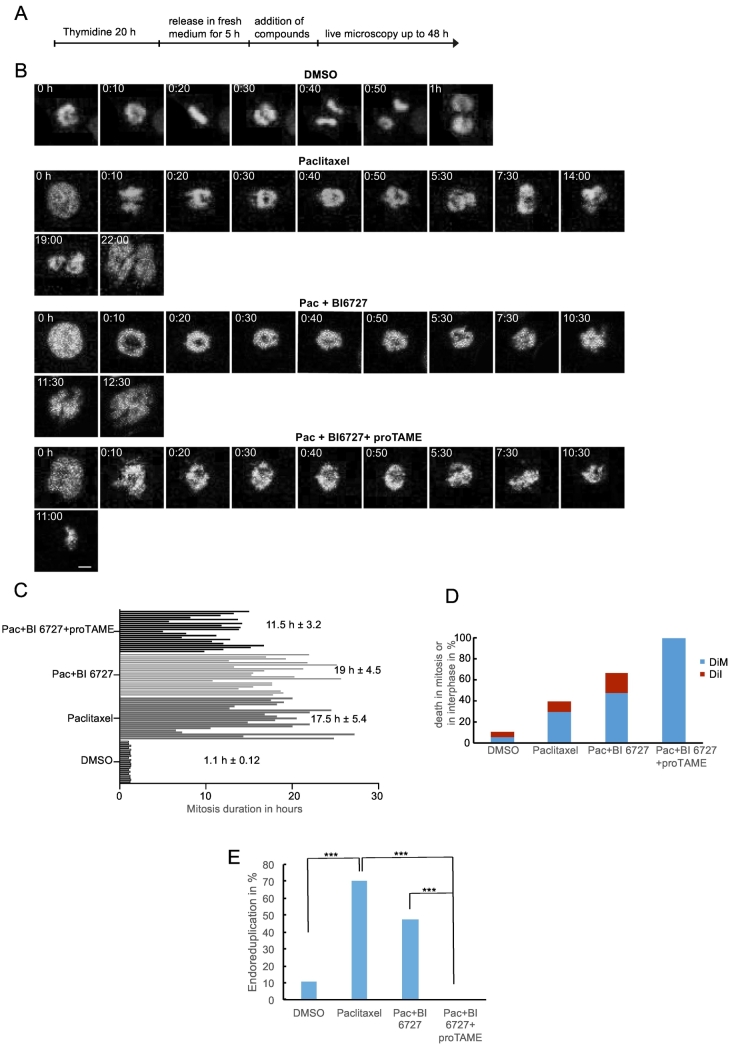
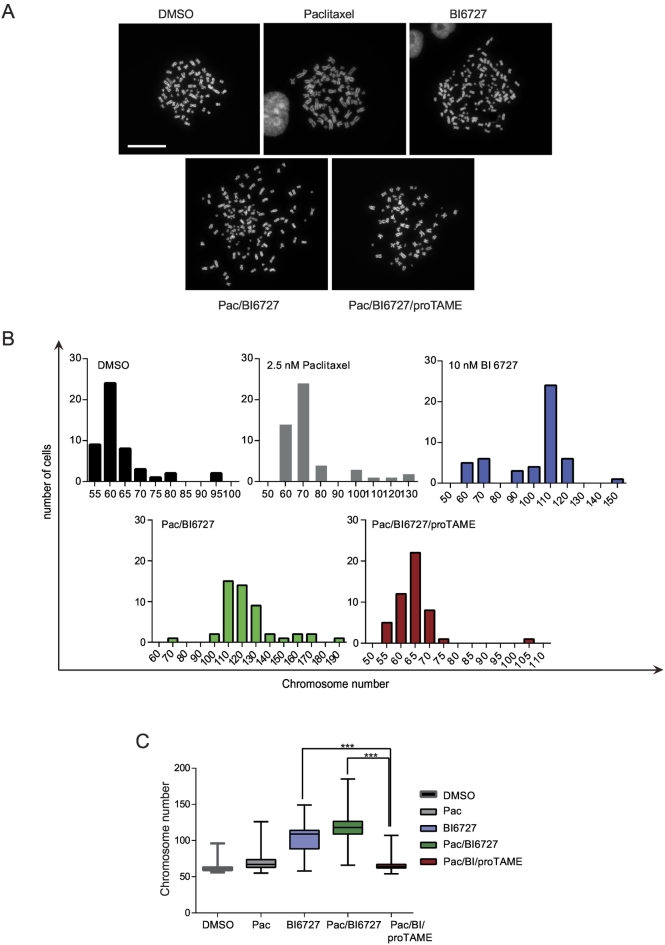
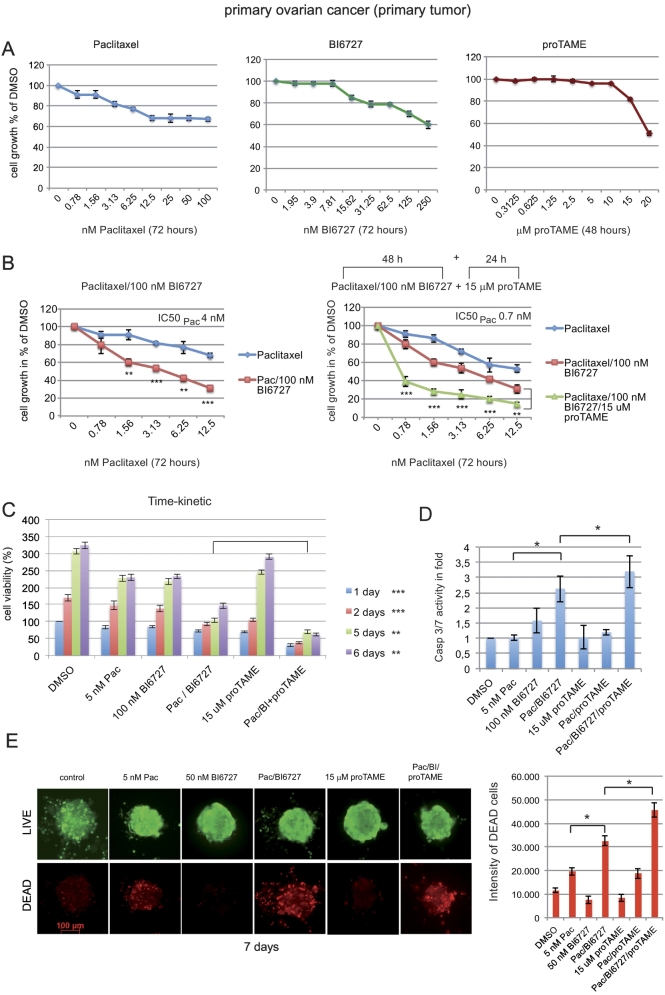
Paclitaxel is a frontline drug for the treatment of epithelial ovarian cancer (EOC). However, following paclitaxel-platinum based chemotherapy, tumor recurrence occurs in most ovarian cancer patients. Chromosomal instability (CIN) is a hallmark of cancer and represents genetic variation fueling tumor adaptation to cytotoxic effects of anticancer drugs. In this study, our Kaplan-Meier analysis including 263 ovarian cancer patients (stages I/II) revealed that high Polo-like kinase (PLK) 1 expression correlates with bad prognosis. To evaluate the role of PLK1 as potential cancer target within a combinatorial trial, we induced strong mitotic arrest in ovarian cancer cell lines by synergistically co-targeting microtubules (paclitaxel) and PLK1 (BI6727) followed by pharmaceutical inhibition of the Anaphase-Promoting Complex (APC/C) using proTAME. In short- and long-term experiments, this triple treatment strongly activated apoptosis in cell lines and primary ovarian cells derived from cancer patients. Mechanistically, BI6727/paclitaxel/proTAME stabilize Cyclin B1 and trigger mitotic arrest, which initiates mitochondrial apoptosis by inactivation of antiapoptotic BCL-2 family proteins, followed by activation of caspase-dependent effector pathways. This triple treatment prevented endoreduplication and reduced CIN, two mechanisms that are associated with aggressive tumors and the acquisition of drug resistance. This "two-punch strategy" (strong mitotic arrest followed by blocking mitotic exit) has important implications for developing paclitaxel-based combinatorial treatments in ovarian cancer.


Figures

Figure 1
Figure 1
Kaplan-Meier analysis of ovarian cancer patients in stages I/II and examination of PLK1 expression. (A) Overall survival in 263 patients with ovarian cancer stage I and II disease according to PLK1 expression based on immunohistochemical evaluation of tumor resection specimens. (B) Representative examples of ovarian carcinoma with a low (WS ≤ 6) and high (WS> 6) detection of PLK1 in tumor cells. Original magnification × 10, scale bars 250 μm. (B) Whole cell lysates of OVCAR-3, SKOV-3, and primary ovarian cancer cells were analyzed for PLK1 expression. Endogenous levels of PLK1 and β-Actin were determined by immunoblotting.
Figure 2
Figure 2
Combinatorial treatment of mitotic OVCAR-3 cells with the APC/C inhibitor proTAME induces a long-lasting inhibition of cell growth. (A) OVCAR-3 cells were treated for 24 hours with paclitaxel and BI6727 followed by a 6-hour treatment with proTAME. Whole cell lysates were used for co-immunoprecipitation experiments with CDC27 antibodies followed by western blotting using antibodies (lower panel) for CDC20 and (upper panel) for Cyclin B1, CDC27, and β-Actin. (B) OVCAR-3 cells were treated for up to 96 hours with 2.5 nM paclitaxel (Pac), 10 nM BI6727, 10 μM proTAME, 2.5 nM Pac/10 nM BI6727, or 2.5 nM Pac/10 nM BI6727/10 μM proTAME for the determination of cell viability (*P ≤ .05; **P ≤ .01; ***P ≤ .001). (C) Coomassie-stained regrown colonies of OVCAR-3 cells treated with 2.5 nM paclitaxel, 10 nM BI6727, 20 μM proTAME, or combinations thereof. The number of colonies was determined after 21 days. Numbers were statistically significant by two-tailed Student's t test (**P ≤ .01). Each bar graph represents the mean value ± SEM (n=3). (D) OVCAR-3 cells were grown as 3D culture over 14 days and treated with 10 nM BI6727, 2.5 nM Pac, and/or 20 μM proTAME. Cells were stained using the LIVE/DEAD viability/cytotoxicity kit, and ratios of viable/dead cells were calculated. Measurements were statistically significant by two-tailed Student's t test (*P ≤ .05). Each bar graph represents the mean value ± SEM (n=3).
Figure 3
Figure 3
Induction of apoptosis in ovarian cancer cells following drug treatment. (A) OVCAR-3 cells were incubated with 2.5 nM paclitaxel, 20 nM BI6727, 10 μM proTAME, or combinations thereof. Caspase-3/7 activity in whole cell lysates was measured 48 hours posttreatment using the Caspase-Glo 3/7 Assay. Each bar graph represents the mean value ± SEM (n=3). Apoptosis was validated (B) by measuring the sub G0/G1 fractions or (C) by PE Annexin V staining. Measurements were statistically significant by two-tailed Student's t test (*P ≤ .05; **P ≤ .01, ***P ≤ .001). Each bar graph represents the mean value ± SEM (n=3). (D ,upper and lower panel) Whole cell lysates of OVCAR-3 cells were analyzed evaluating marker proteins for mitochondrial-mediated apoptosis. Endogenous levels of PARP, cleaved PARP, BCL-XL pS62, BCL-2, Caspase-3, cleaved-Caspase-3, pHistone H3, PLK1, Cyclin B1, MCL-1, Cyclin A, Securin, and β-Actin were determined by immunoblotting.
Figure 4
Figure 4
Combinatorial treatment of mitotic OVCAR-3 cells with proTAME promotes death in mitosis and blocks endoreduplication. (A) Treatment schedule for time-lapse microscopy. Cells were first incubated with 2 mM thymidine to arrest them in the S-phase. After releasing the cells in fresh medium for 5 hours, drugs were added to cells and time-lapse microscopy was started up to 48 hours. (B) Representative time-lapse of OVCAR-3 cells expressing mcherry-H2B treated as in (A) with 1 nM paclitaxel, 1 nM paclitaxel/10 nM BI6727, or 1 nM paclitaxel/10 nM BI6727/10 μM proTAME (from t = 0 hour to t = 48 hours). Scale bar: 10 μm. (C) Duration of mitosis in OVCAR-3 cells treated with 1 nM paclitaxel, 1 nM paclitaxel/10 nM BI6727, or 1 nM paclitaxel/10 nM BI6727/10 μM proTAME was assessed by time-lapse microscopy. Mitotic duration of each cell in the different treatment groups (n=40) is quantitated in the bar graph. (D) Rate of cells exhibiting death in mitosis (DiM) or death in interphase (DiI) observed in the different treatment groups in percentage. (E) Endoreduplication rate observed in the different treatment groups in percentage (***P ≤ .001).
Figure 5
Figure 5
Analysis of chromosomal aberrations in drug-treated ovarian cancer cells. (A) Following the incubation with single (2.5 nM paclitaxel, 10 nM BI6727, 10 μM proTAME), double, or triple agents for 48 hours and subsequent release into fresh medium for 14 days, metaphase spreads of treated OVCAR-3 cells were prepared, and the chromosomes were stained with Hoechst. Scale bar: 20 μm (B) The histogram plotting of the distribution of chromosome numbers at day 14 is shown. (C) Quantification of the number of chromosomes in 500 OVCAR-3 cells incubated in the presence of different agents for 48 hours. Measurements were statistically significant by two-tailed Student's t test (***P < .001). Each bar graph represents the mean value ± SEM (n=3).
Figure 6
Figure 6
Blocking mitotic exit sensitizes ovarian cancer patient-derived primary cells to paclitaxel. (A) Primary tumor cells were treated with increasing concentrations of paclitaxel, BI6727, or proTAME or combinations. (B) The cell viability was determined after 72 hours or (C) over a period of 6 days using the Cell Titer-Blue Cell Viability Assay. (D) After treatment for 48 hours Caspase 3/7 activity was measured using the Caspase-Glo 3/7 assay. (E) 3D cultures grown out of primary tumor cells were treated (5 nM paclitaxel, 50 nM BI6727, 15 μM proTAME, or combinations thereof), cells were stained, and fluorescence intensities of dead cells were determined. Measurements were statistically significant by two-tailed Student's t test (*P ≤ .05). Each bar graph represents the mean value ± SEM (n=3).

Similar articles

Cited by

References

    1. Karnezis AN, Cho KR, Gilks CB, Pearce CL, Huntsman DG. The disparate origins of ovarian cancers: pathogenesis and prevention strategies. Nat Rev Cancer. 2017;17:65–74. - PubMed
    1. Yang Q, Yang Y, Zhou N, Tang K, Lau WB, Lau B, Wang W, Xu L, Yang Z, Huang S. Epigenetics in ovarian cancer: premise, properties, and perspectives. Mol Cancer. 2018;17:109. - PMC - PubMed
    1. Montero A, Fossella F, Hortobagyi G, Valero V. Docetaxel for treatment of solid tumours: a systematic review of clinical data. Lancet Oncol. 2005;6:229–239. - PubMed
    1. Bolis G, Scarfone G, Raspagliesi F, Mangili G, Danese S, Scollo P, Lo Russo D, Villa A, Aimone PD, Scambia G. Paclitaxel/carboplatin versus topotecan/paclitaxel/carboplatin in patients with FIGO suboptimally resected stage III-IV epithelial ovarian cancer a multicenter, randomized study. Eur J Cancer. 2010;46:2905–2912. - PubMed
    1. du Bois A, Luck HJ, Meier W, Adams HP, Mobus V, Costa S, Bauknecht T, Richter B, Warm M, Schroder W. A randomized clinical trial of cisplatin/paclitaxel versus carboplatin/paclitaxel as first-line treatment of ovarian cancer. J Natl Cancer Inst. 2003;95:1320–1329. - PubMed

Publication types

MeSH terms