

Measuring population ageing: an analysis of the Global Burden of Disease Study 2017
- PMID: 30851869
- PMCID: PMC6472541
- DOI: 10.1016/S2468-2667(19)30019-2
Measuring population ageing: an analysis of the Global Burden of Disease Study 2017
Abstract
Background: Traditional metrics for population health ageing tend not to differentiate between extending life expectancy and adding healthy years. A population ageing metric that reflects both longevity and health status, incorporates a comprehensive range of diseases, and allows for comparisons across countries and time is required to understand the progression of ageing and to inform policies.
Methods: Using the Global Burden of Diseases, Injuries, and Risk Factors Study 2017, we developed a metric that reflects age-related morbidity and mortality at the population level. First, we identified a set of age-related diseases, defined as diseases with incidence rates among the adult population increasing quadratically with age, and measured their age-related burden, defined as the sum of disability-adjusted life-years (DALYs) of these diseases among adults. Second, we estimated age-standardised age-related health burden across 195 countries between 1990 and 2017. Using global average 65-year-olds as the reference population, we calculated the equivalent age in terms of age-related disease burden for all countries. Third, we analysed how the changes in age-related burden during the study period relate to different factors with a decomposition analysis. Finally, we describe how countries with similar levels of overall age-related burden experience different onsets of ageing. We represent the uncertainty of our estimates by calculating uncertainty intervals (UI) from 1000 draw-level estimates for each disease, country, year, and age.
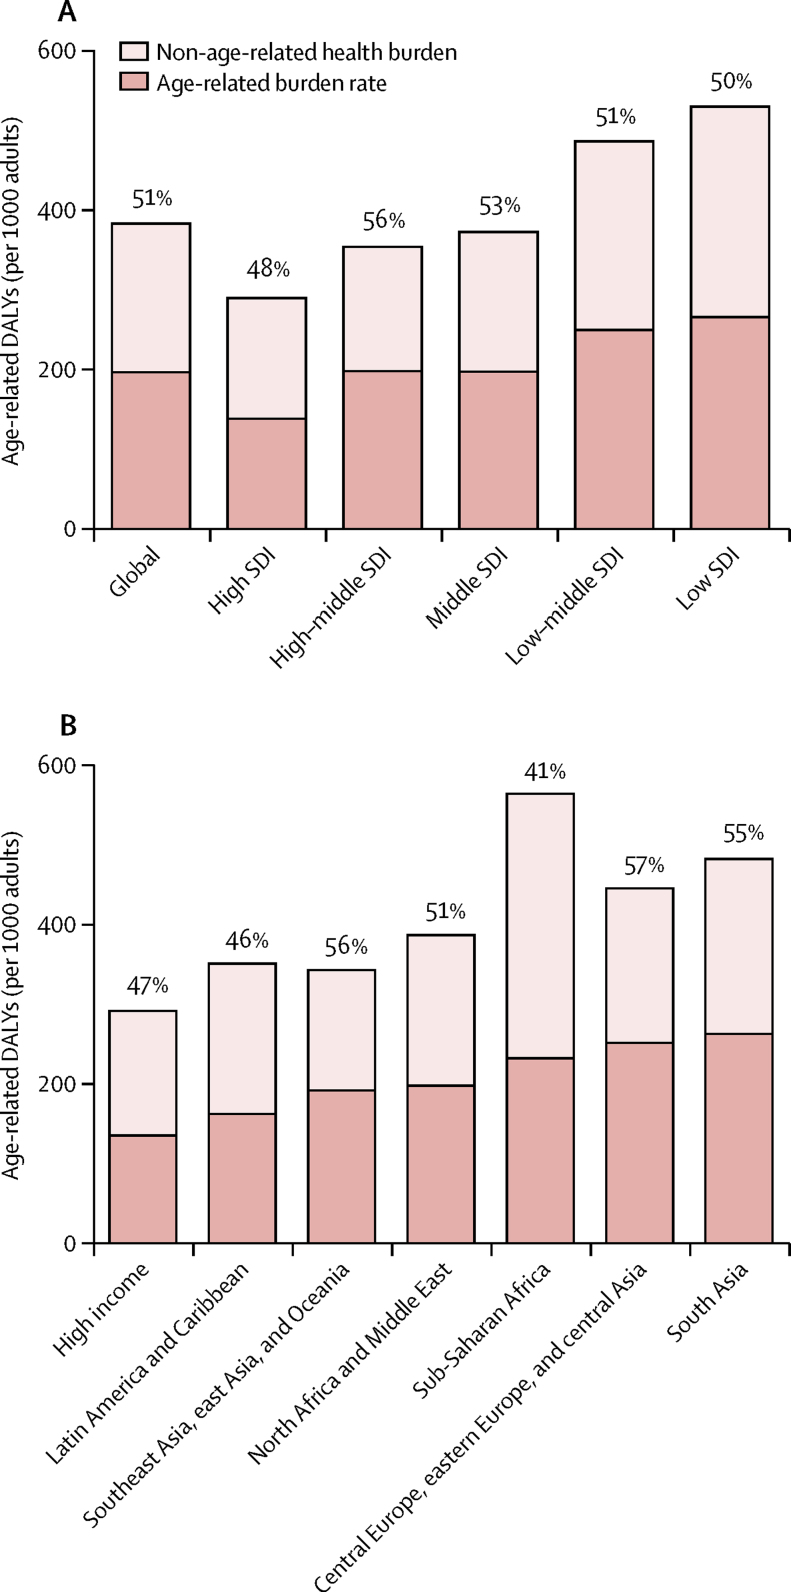
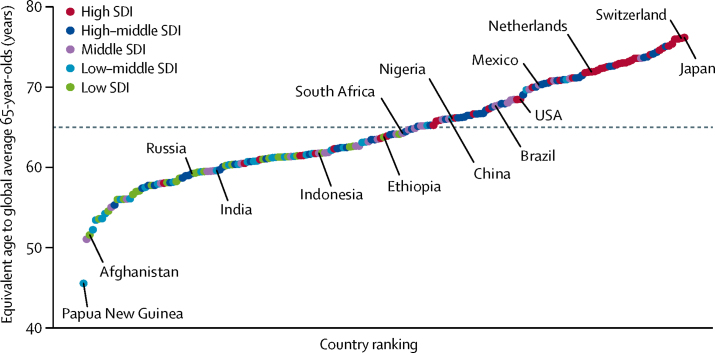
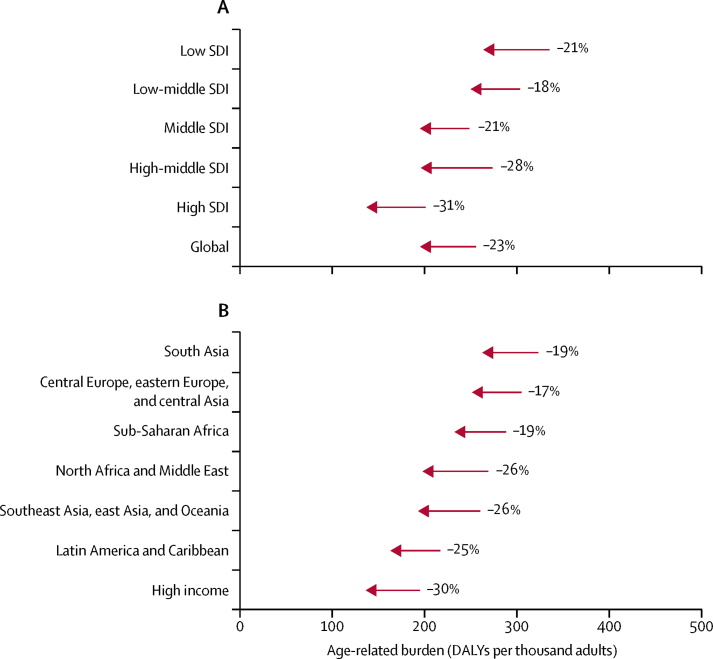
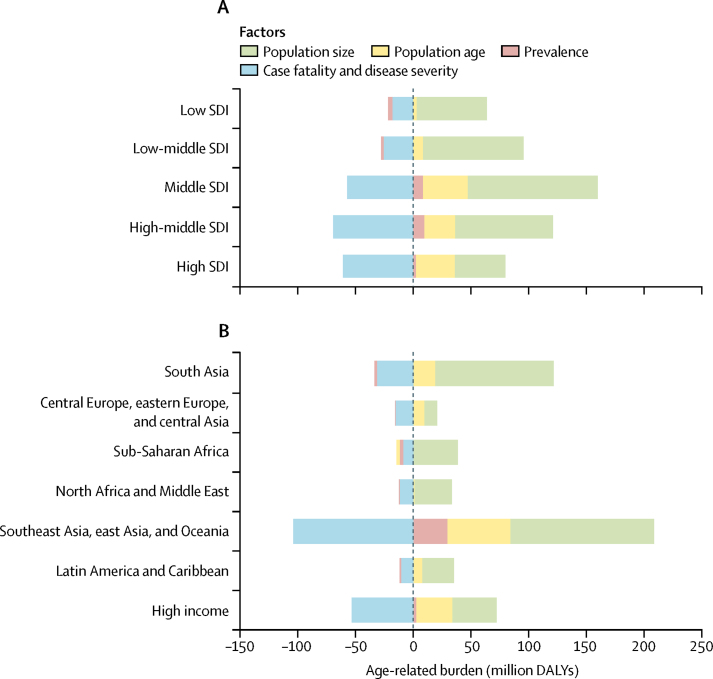
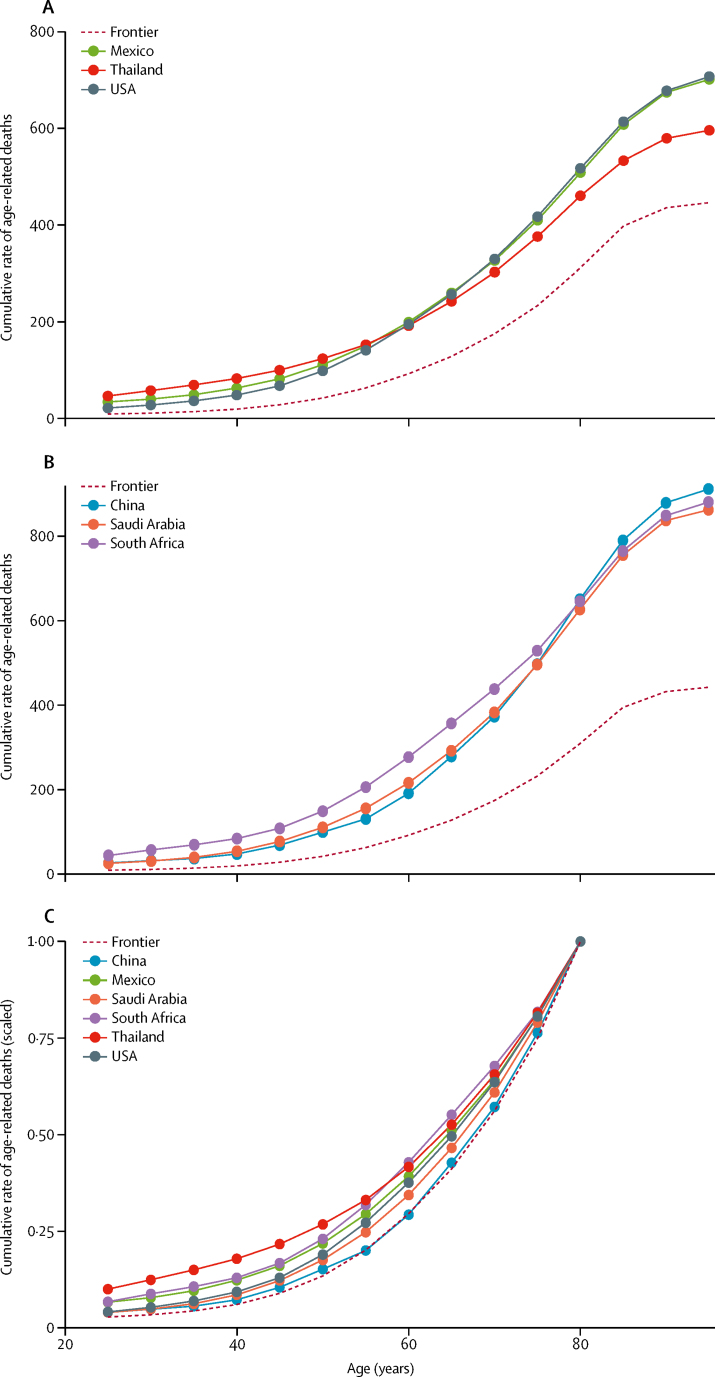
Findings: 92 diseases were identified as age related, accounting for 51·3% (95% UI 48·5-53·9) of all global burden among adults in 2017. Across the Socio-demographic Index (SDI), the rate of age-related burden ranged from 137·8 DALYs (128·9-148·3) per 1000 adults in high SDI countries to 265·9 DALYs (251·0-280·1) in low SDI countries. The equivalent age to average 65-year-olds globally spanned from 76·1 years (75·6-76·7) in Japan to 45·6 years (42·6-48·2) in Papua New Guinea. Age-standardised age-related disease rates have decreased over time across all SDI levels and regions between 1990 and 2017, mainly due to decreases in age-related case fatality and disease severity. Even among countries with similar age-standardised death rates, large differences in the onset and patterns of accumulating age-related burden exist.
Interpretation: The new metric facilitates the shift from thinking not just about chronological age but the health status and disease severity of ageing populations. Our findings could provide inputs into policymaking by identifying key drivers of variation in the ageing burden and resources required for addressing the burden.
Funding: National Institute on Aging of the National Institutes of Health.
Copyright © 2019 The Author(s). Published by Elsevier Ltd. This is an Open Access article under the CC BY 4.0 license. Published by Elsevier Ltd.. All rights reserved.
Figures
Comment in
-
Age-related disease burden as a measure of population ageing.Lancet Public Health. 2019 Mar;4(3):e123-e124. doi: 10.1016/S2468-2667(19)30026-X. Lancet Public Health. 2019. PMID: 30851865 No abstract available.
References
-
- d'Albis H, Collard F. Age groups and the measure of population aging. Demogr Res. 2013;29:617–640.
-
- Gavrilov LA, Heuveline P. Aging of population. In: Demeny P, McNicoll G, editors. The encyclopedia of population. Macmillan Reference USA; New York, NY: 2003. pp. 32–37.
-
- United States Census Bureau The nation's older population is still growing, Census Bureau reports. June 22, 2017. https://www.census.gov/newsroom/press-releases/2017/cb17-100.html
Publication types
MeSH terms
Grants and funding
LinkOut - more resources
Full Text Sources
Other Literature Sources
