

Risk of 30-Day Hospital Readmission Among Patients Discharged to Skilled Nursing Facilities: Development and Validation of a Risk-Prediction Model
- PMID: 30852170
- PMCID: PMC6476539
- DOI: 10.1016/j.jamda.2019.01.137
Risk of 30-Day Hospital Readmission Among Patients Discharged to Skilled Nursing Facilities: Development and Validation of a Risk-Prediction Model
Abstract
Objectives: Patients discharged to a skilled nursing facility (SNF) for post-acute care have a high risk of hospital readmission. We aimed to develop and validate a risk-prediction model to prospectively quantify the risk of 30-day hospital readmission at the time of discharge to a SNF.
Design: Retrospective cohort study.
Setting: Ten independent SNFs affiliated with the post-acute care practice of an integrated health care delivery system.
Participants: We evaluated 6032 patients who were discharged to SNFs for post-acute care after hospitalization.
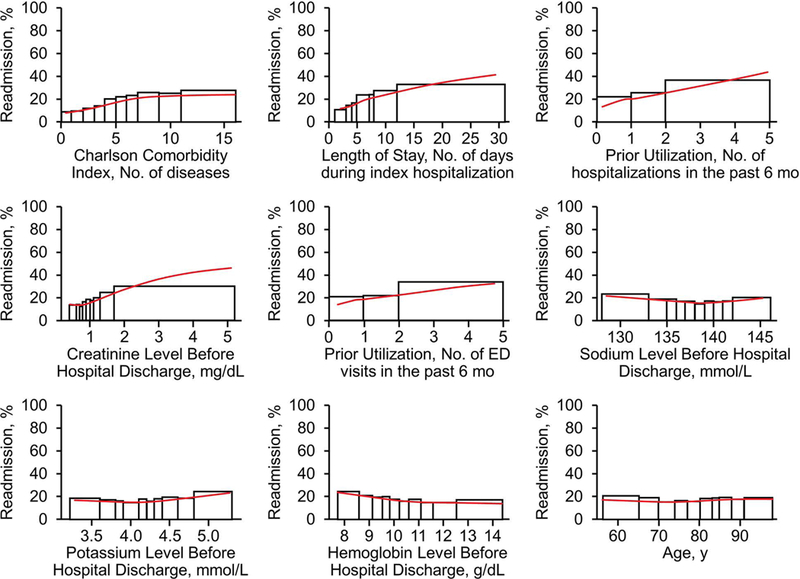
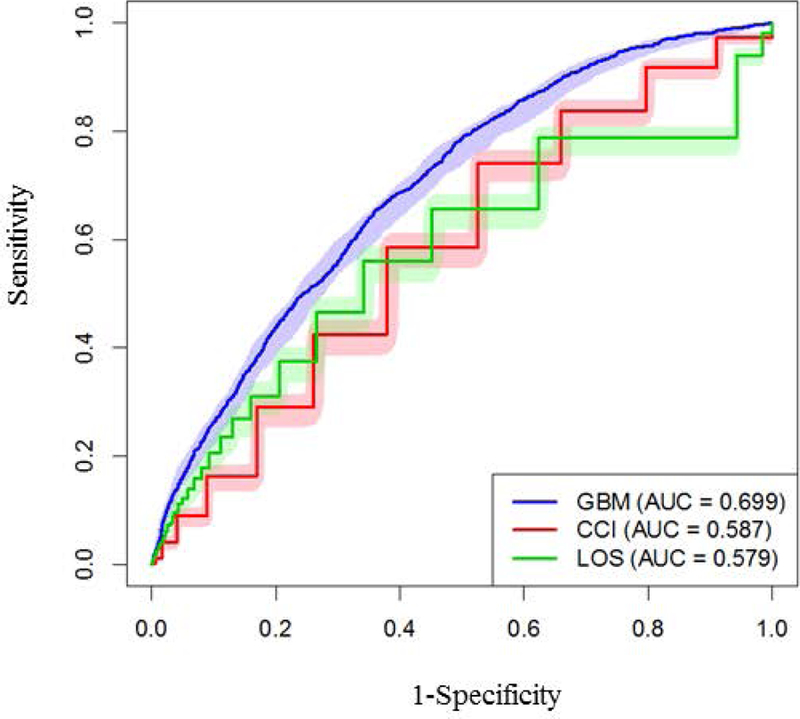
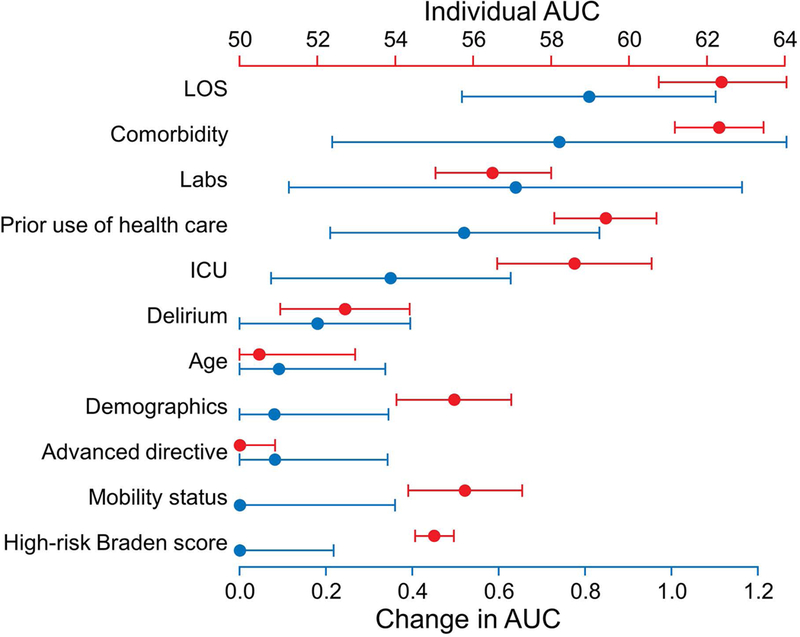
Measurements: The primary outcome was all-cause 30-day hospital readmission. Patient demographics, medical comorbidity, prior use of health care, and clinical parameters during the index hospitalization were analyzed by using gradient boosting machine multivariable analysis to build a predictive model for 30-day hospital readmission. Area under the receiver operating characteristic curve (AUC) was assessed on out-of-sample observations under 10-fold cross-validation.
Results: Among 8616 discharges to SNFs from January 1, 2009, through June 30, 2014, a total of 1568 (18.2%) were readmitted to the hospital within 30 days. The 30-day hospital readmission prediction model had an AUC of 0.69, a 16% improvement over risk assessment using the Charlson Comorbidity Index alone. The final model included length of stay, abnormal laboratory parameters, and need for intensive care during the index hospitalization; comorbid status; and number of emergency department and hospital visits within the preceding 6 months.
Conclusions and implications: We developed and validated a risk-prediction model for 30-day hospital readmission in patients discharged to a SNF for post-acute care. This prediction tool can be used to risk stratify the complex population of hospitalized patients who are discharged to SNFs to prioritize interventions and potentially improve the quality, safety, and cost-effectiveness of care.
Keywords: Post-acute; readmission risk; skilled nursing facility.
Copyright © 2019 AMDA – The Society for Post-Acute and Long-Term Care Medicine. Published by Elsevier Inc. All rights reserved.
Figures
References
-
- Carter C, Garrett B, Wissoker D The need to reform Medicare’s payments to skilled nursing facilities is as strong as ever; 2015. https://www.urban.org/sites/default/files/publication/39036/2000072-The-.... Accessed 2018 Feb 15.
-
- Harris-Kojetin L, Sengupta M, Park-Lee E, et al. Long-Term Care Services in the United States: 2013 Overview. National Center for Health Statistics. Vital Health Stat 3(37); 2013. - PubMed
-
- Bogaisky M, Dezieck L Early hospital readmission of nursing home residents and community-dwelling elderly adults discharged from the geriatrics service of an urban teaching hospital: patterns and risk factors. J Am Geriatr Soc 2015;63(3):548–552. - PubMed
Publication types
MeSH terms
Grants and funding
LinkOut - more resources
Full Text Sources
