. 2019 Mar 27;8(3):226-241.e7.
doi: 10.1016/j.cels.2019.01.006. Epub 2019 Mar 6.

Mechanical Force Induces Phosphorylation-Mediated Signaling that Underlies Tissue Response and Robustness in Xenopus Embryos

Affiliations

Mechanical Force Induces Phosphorylation-Mediated Signaling that Underlies Tissue Response and Robustness in Xenopus Embryos

Yutaka Hashimoto et al. Cell Syst. .

Abstract

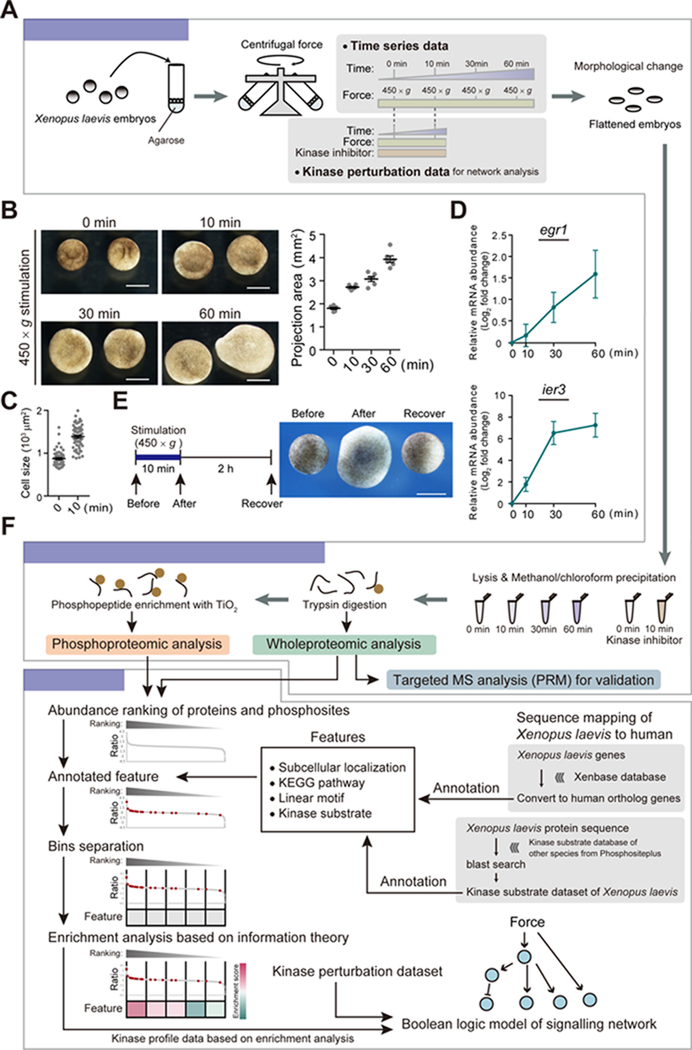
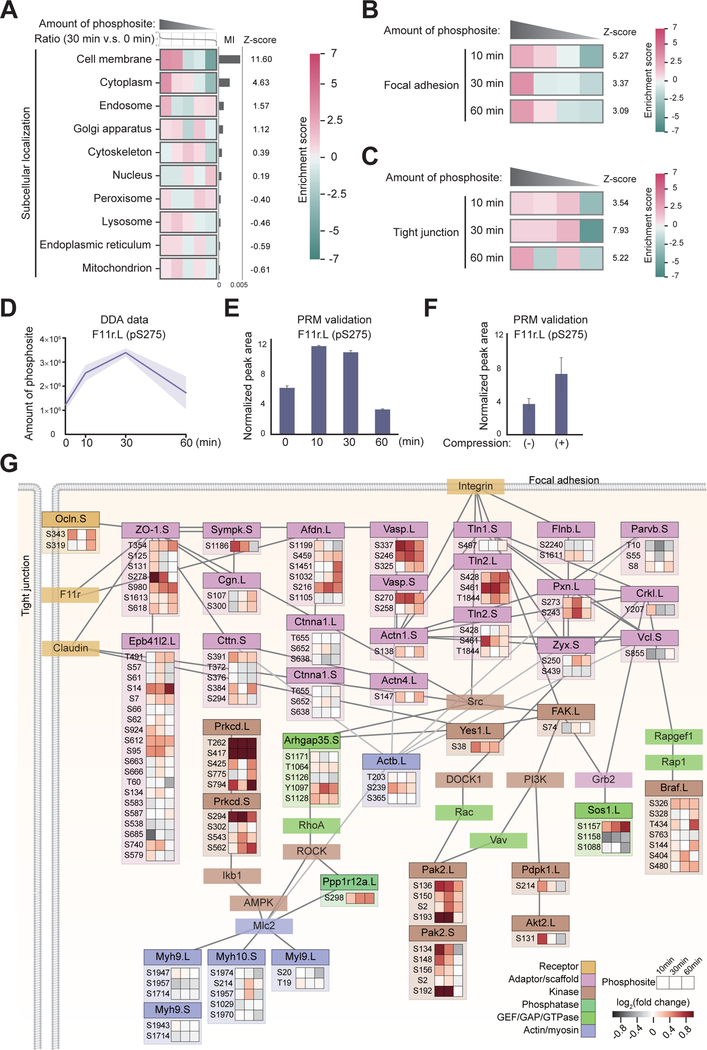
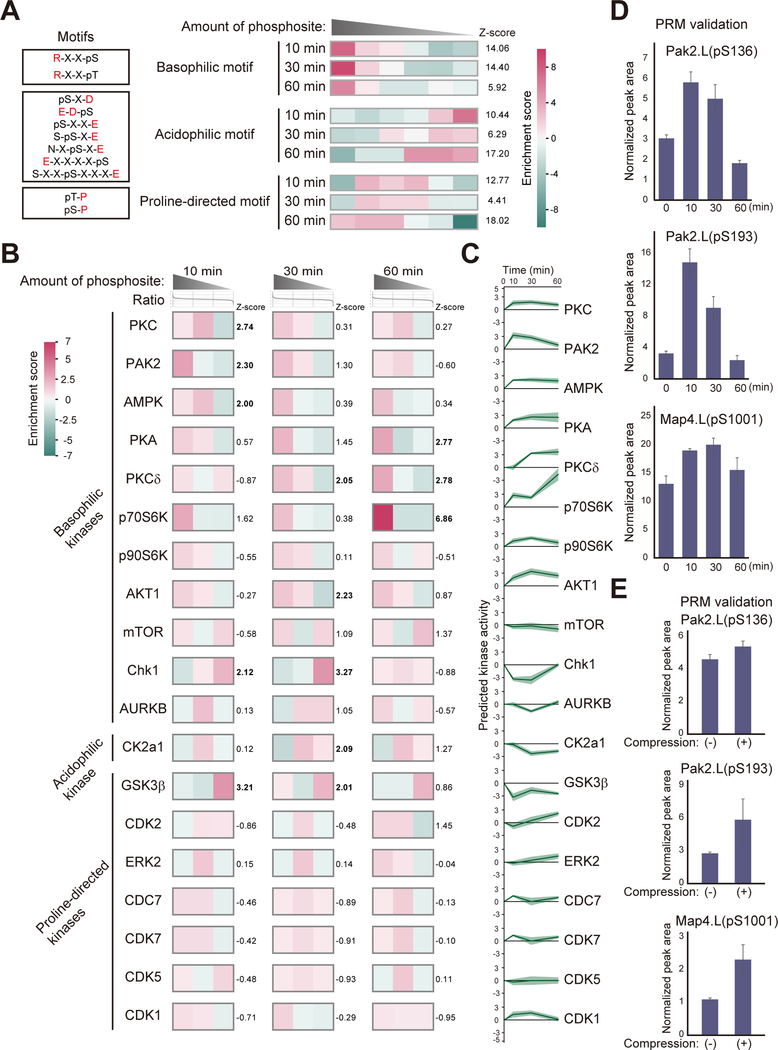
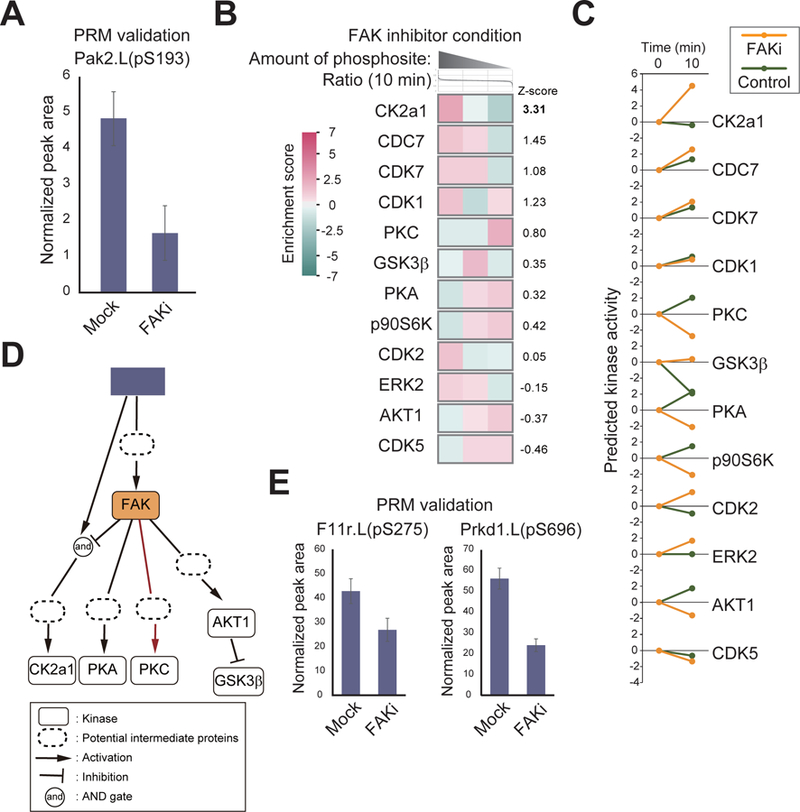
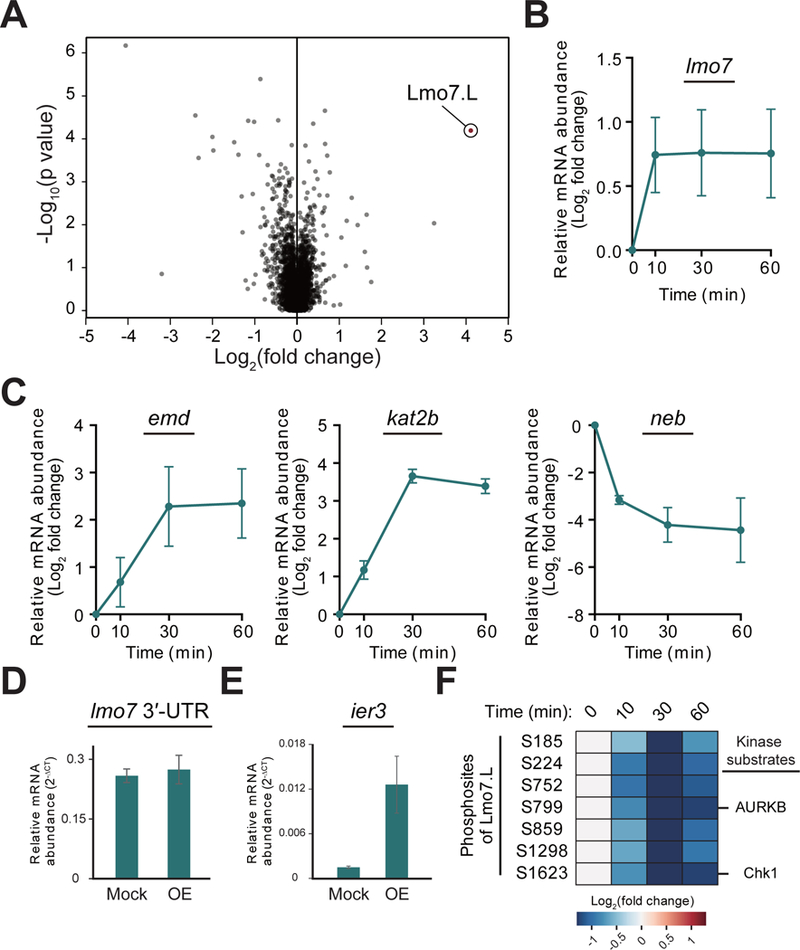
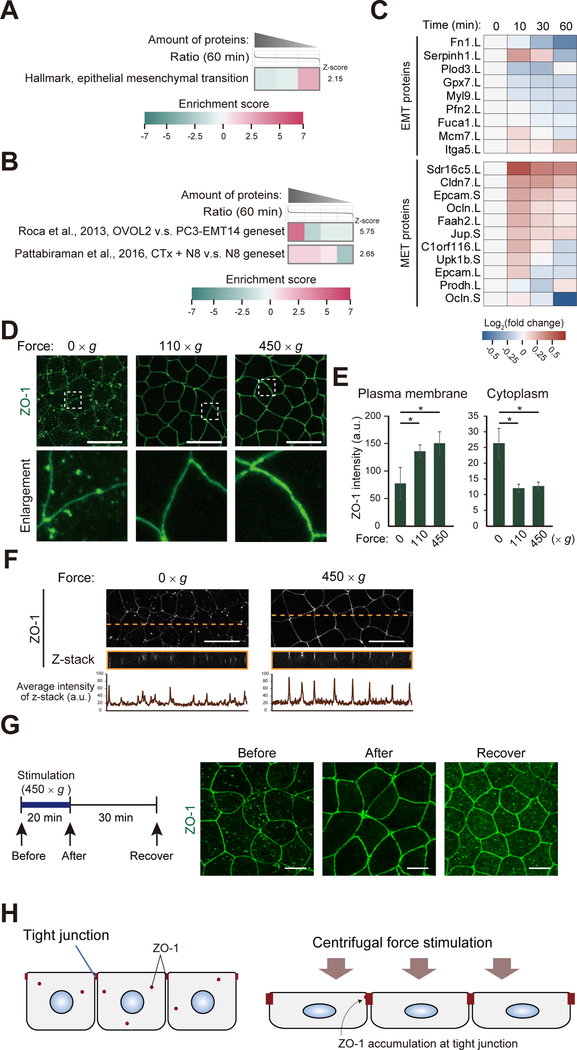
Mechanical forces are essential drivers of numerous biological processes, notably during development. Although it is well recognized that cells sense and adapt to mechanical forces, the signal transduction pathways that underlie mechanosensing have remained elusive. Here, we investigate the impact of mechanical centrifugation force on phosphorylation-mediated signaling in Xenopus embryos. By monitoring temporal phosphoproteome and proteome alterations in response to force, we discover and validate elevated phosphorylation on focal adhesion and tight junction components, leading to several mechanistic insights into mechanosensing and tissue restoration. First, we determine changes in kinase activity profiles during mechanoresponse, identifying the activation of basophilic kinases. Pathway interrogation using kinase inhibitor treatment uncovers a crosstalk between the focal adhesion kinase (FAK) and protein kinase C (PKC) in mechanoresponse. Second, we find LIM domain 7 protein (Lmo7) as upregulated upon centrifugation, contributing to mechanoresponse. Third, we discover that mechanical compression force induces a mesenchymal-to-epithelial transition (MET)-like phenotype.

Keywords: Xenopus laevis; mass spectrometry; mechanical signaling; mechanobiology; mechanosensing; phosphoproteomics; phosphorylation; proteomics; signaling.


Conflict of interest statement

DECLARATION OF INTERESTS

The authors declare no competing interests.

Figures

Figure 1.
Figure 1.. Workflow for Proteomic and Phosphoproteomic Analyses Upon Mechanical Stimulation of Xenopus laevis Embryos
(A) Workflow for the stimulation of Xenopus laevis embryos with centrifugal force for different periods of time, and follow-up kinase inhibitor assays. (B) Embryos were centrifuged at 450 × g for the indicated time. Embryonic morphology from animal pole (left) and quantified areas of animal hemisphere (right) are shown. Scale bar, 1 mm. Data are mean ± SEM (n=6). (C) Embryos centrifuged as in (B), and ectodermal cells from animal pole were quantified. Data are mean ± SEM (n=60). (D) RT-PCR analysis of egr1 and ier3 mRNAs in centrifuged embryos. Data are expressed relative to the normalized value for embryos at 0 min time point, and are mean ± SEM (n=3). (E) Embryonic morphology recovers after centrifugal force stimulation. Animal pole are shown with or without centrifugation (“Before” or “After”, respectively) and 2 h after centrifugation (“Recover”). Scale bar, 1 mm. (F) Workflow for sample preparation and MS and data analyses. See also Figure S1.
Figure 2.
Figure 2.. Temporal Alterations in the Xenopus Proteome and Phosphoproteome during Mechanoresponse
(A) Phosphopeptides and proteins quantified across biological replicates at the indicated time points. “Sequence matching” indicates proteins or peptides detected following MS/MS sequencing, while “peak matching” those detected as chromatographic peaks and features across samples. (B) Scatter plots of quantified proteins or phosphopeptides for the biological replicates at 0 and 60 min conditions. ρ, Spearman’s correlation coefficient. (C) PCA analysis of phosphorylated sites for the indicated time points. Percentage of variance shown on axes. (D) The coverage between Xenopus laevis and human ortholog GO terms in the proteome and phosphoproteome data. Annotated proteins refer to those that had at least one DAVID term. (E) Hierarchical clustering of proteins throughout mechanoresponse at the indicated time points. The main average clusters (w1–w3) and their enriched GO terms (scores > 1) are shown. (F) Hierarchical clustering of phosphorylated sites during mechanoresponse. The main average clusters (p1–p5) and their enriched GO terms (scores > 1) are shown. See also Figure S1 and S2; Tables S1 and S2.
Figure 3.
Figure 3.. Focal Adhesion and Tight Junction Components are Phosphorylated during Mechanoresponse
(A) Ranked phosphorylated sites were separated into five bins with decreasing phosphopeptide abundance from left to right when comparing 30 to 0 min force stimulation. Enrichment analysis of subcellular localization was performed based on UniProt annotation. Higher mutual information (MI) values represent more enriched features. Significance was set as z-score > 2. (B) Phosphorylation of focal adhesion proteins is elevated at all time points following force stimulation, as shown by phosphopeptide abundance ratios relative to mock, ranked as in (A). Z-scores are shown. (C) Phosphorylation of tight junction proteins is elevated following force stimulation, shown as in (B). (D) F11r.L phosphorylation at S275 quantified by label-free DDA at the indicated times. Data are median ±SD; n=3 biological replicates. (E) F11r.L S275 phosphorylation quantified by PRM. Data are mean ±SD; n=3. (F) F11r.L S275 phosphorylation was quantified by PRM after 5 min embryo compression. Data are mean ±SD; n=3. (G) Interaction network of focal adhesion and tight junction components, illustrating the temporal alterations in site-specific phosphorylation levels. Nodes indicate proteins that are components of focal adhesion or tight junction in KEGG pathways, and edges indicate interactions. Heatmap colors represent log2 fold changes in phosphorylation levels normalized to 0 min and to the protein abundance obtained from the proteome data. See also Figure S3; Tables S3.
Figure 4.
Figure 4.. Dynamic Kinase Activation Profiles during Mechanoresponse
(A) Phosphorylation sites classified based on their presence within basophilic, acidophilic, or proline-directed motifs. Enrichment analysis shows phosphorylation levels ranked from high to low (left to right) and separated into six bins. (B) Kinase substrate enrichment analysis was performed following force stimulation. Kinase substrates were annotated from the phosphosites database, and kinases with ≥5 substrates in our phosphoproteome data are listed. Ranked phosphorylated sites were separated into bins (from high to low levels). Z-scores are shown. (C) Predicted kinase activities during temporal mechanoresponse based on enrichment score in (B). Predicted activities were calculated by subtracting the enrichment score in the bin with the lowest phosphorylation levels from that in the bin with the highest level. (D) Pak2.L(pS136, pS193) and Map4.L(pS1001) quantified by PRM at the indicated times. Data are means ±SD; n=3. (E) Pak2.L(pS136, pS193) and Map4.L(pS1001) quantified by PRM after embryo compression for 5 min. Data are means ±SD; n=3. See also Figure S4; Tables S3.
Figure 5.
Figure 5.. Kinase Crosstalk in Response to Mechanical Stimulation
(A) Embryos were stimulated with centrifugal force for 10 min in the presence or absence of FAK inhibition. Pak2.L phosphorylation at S193 (pS193) was quantified by PRM. Data are means ±SD; n=3. (B) Kinase substrate enrichment analysis performed following FAK inhibition and 10 min force stimulation. Ranked phosphorylated sites were separated into bins (high to low, left to right). (C) Predicted kinase activity based on enrichment score in Figure 4B and (B) with or without FAK inhibition at 10 min post force stimulation. (D) Boolean logic model of signaling network was constructed using predicted kinase activity profiles in (C). Arrows, T-bars and an ‘and’ node indicate activation, inhibition, and AND gate. (E) F11r.L(pS275) and Prkd1.L(pS696) quantified by PRM following embryo centrifugation for 10 min with or without FAK inhibition. Data are means ±SD; n=3. See also Figure S5; Tables S4, and S5.
Figure 6.
Figure 6.. Lmo7 is Activated in Response to Force Stimulation
(A) Volcano plot of proteome alterations following 60 min force stimulation, quantified by DDA MS. (B) RT-qPCR analysis of lmo7 mRNA in embryos following force stimulation. Data are expressed relative to the corresponding normalized value for embryos at the 0 min time point, and are mean ±SEM (n=5). (C) RT-qPCR analysis of emd, kat2b, and neb mRNAs in embryos following temporal force stimulation. Data are expressed as in (B), and are mean ±SEM (n=3). (D) RT-qPCR analysis of endogenous lmo7 mRNA in embryos with or without Lmo7 overexpression. Data are expressed relative to the corresponding normalized value for embryos at the mock or Lmo7 overexpression, and mean ±SEM (n=3). (E) RT-qPCR analysis of ier3 mRNA in embryos with or without Lmo7 overexpression. Data are expressed as in (D), and mean ±SEM (n=4). (F) Temporal change in Lmo7.L site-specific phosphorylation, quantified by label-free DDA. Known kinase substrate sites reported by PhosphoSitePlus database are shown. See also Tables S1.
Figure 7.
Figure 7.. Centrifugal Compression Force Induces MET-like Phenotype
(A) Enrichment analysis of epithelial-mesenchymal transition (EMT) gene set (hallmark) from MsigDB was performed at 60 min post force stimulation. (B) Enrichment analysis of MET gene sets created from two published MET studies was performed at 60 min post force stimulation. (C) The relative levels of MET and EMT proteins were quantified by PRM at indicated force stimulation times. (D) Immunofluorescence analysis of ZO-1 (green) in Xenopus laevis embryos, with or without 15 min force stimulation. Scale bar, 25 µm. (E) ZO-1 intensities as determined in (D) were quantified. Data are mean ±SD (n=30~60). *, p < 0.05 (Dunnett’s test). (F) Immunofluorescence analysis of ZO-1 in Xenopus laevis embryos, with or without 15 min force stimulation. Z-stack images of the dashed lines are shown. Average intensities of ZO-1 in the z-stack images are shown. (G) Immunofluorescence analysis of ZO-1 in Xenopus laevis embryos are shown with or without centrifugation (“Before” or “After”, respectively) and 30 min after centrifugation (“Recover”). Scale bar, 1 mm. (H) Schematic representation of the tight junction regulation upon mechanoresponse. See also Tables S6.

Similar articles

Cited by

References

    1. Blasius M, Forment JV, Thakkar N, Wagner SA, Choudhary C, and Jackson SP (2011). A phospho-proteomic screen identifies substrates of the checkpoint kinase Chk1. Genome biology 12, R78. - PMC - PubMed
    1. Boeckeler K, Rosse C, Howell M, and Parker PJ (2010). Manipulating signal delivery - plasma-membrane ERK activation in aPKC-dependent migration. Journal of cell science 123, 2725–2732. - PubMed
    1. Broders-Bondon F, Nguyen Ho-Bouldoires TH, Fernandez-Sanchez ME, and Farge E (2018). Mechanotransduction in tumor progression: The dark side of the force. The Journal of cell biology 217, 1571–1587. - PMC - PubMed
    1. Collins C, Osborne LD, Guilluy C, Chen Z, O’Brien ET 3rd, Reader JS, Burridge K, Superfine R, and Tzima E (2014). Haemodynamic and extracellular matrix cues regulate the mechanical phenotype and stiffness of aortic endothelial cells. Nature communications 5, 3984. - PMC - PubMed
    1. Coniglio SJ, Zavarella S, and Symons MH (2008). Pak1 and Pak2 mediate tumor cell invasion through distinct signaling mechanisms. Molecular and cellular biology 28, 4162–4172. - PMC - PubMed

Publication types

MeSH terms

LinkOut - more resources