. 2019 Apr 2;29(4):871-885.e5.
doi: 10.1016/j.cmet.2019.02.014. Epub 2019 Mar 7.

LINE1 Derepression in Aged Wild-Type and SIRT6-Deficient Mice Drives Inflammation

Affiliations

LINE1 Derepression in Aged Wild-Type and SIRT6-Deficient Mice Drives Inflammation

Matthew Simon et al. Cell Metab. .

Abstract

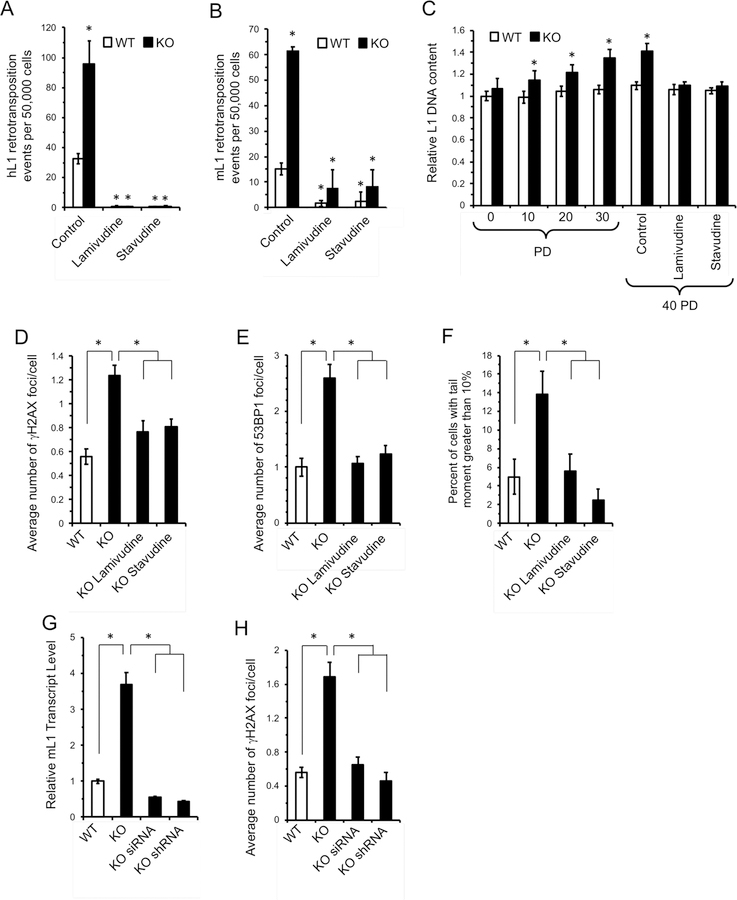
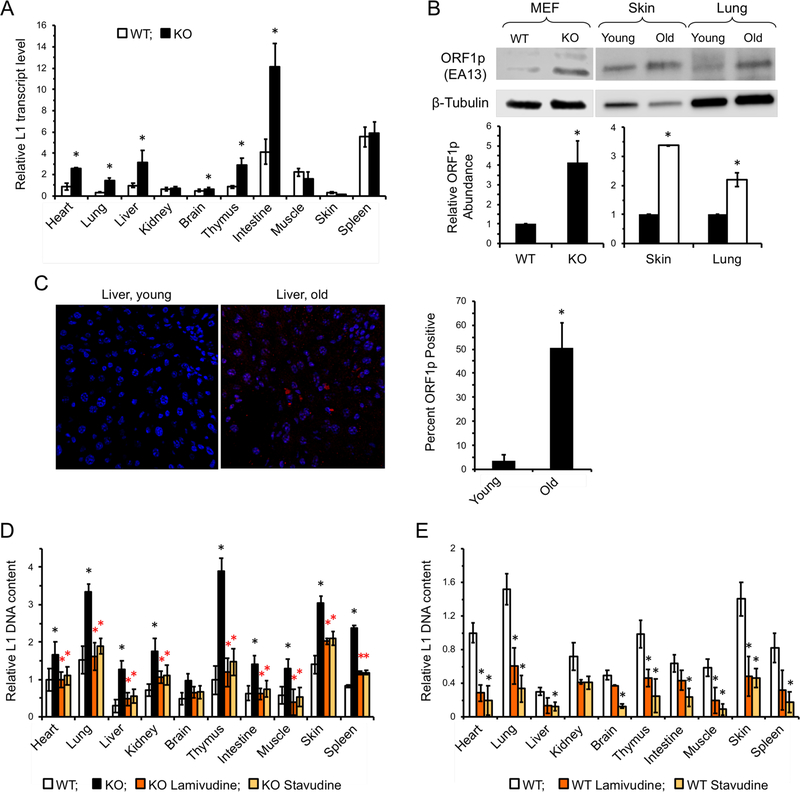
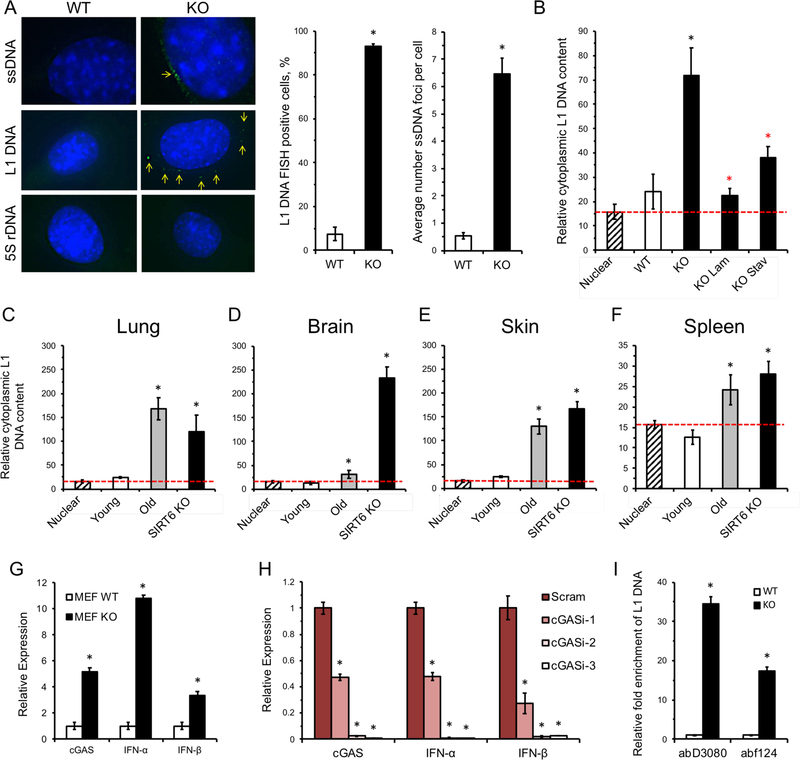
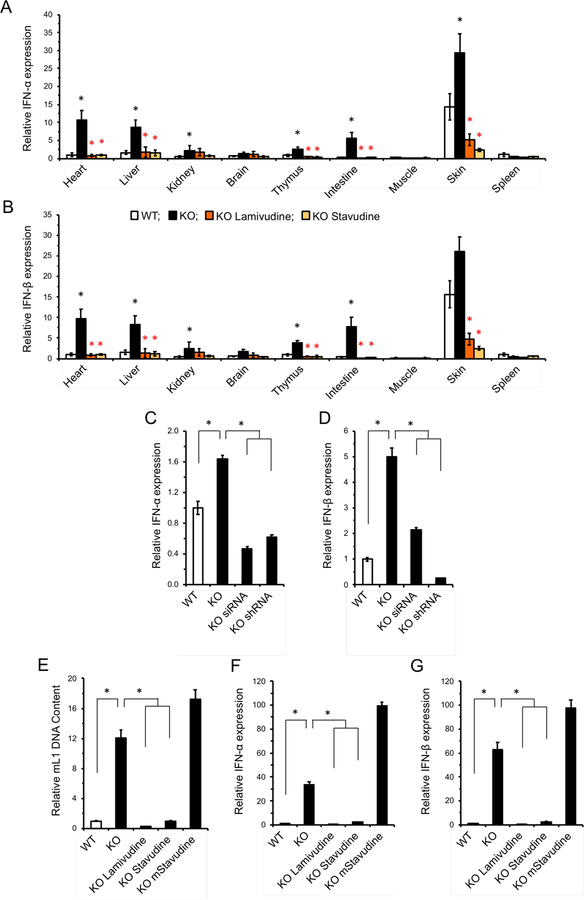
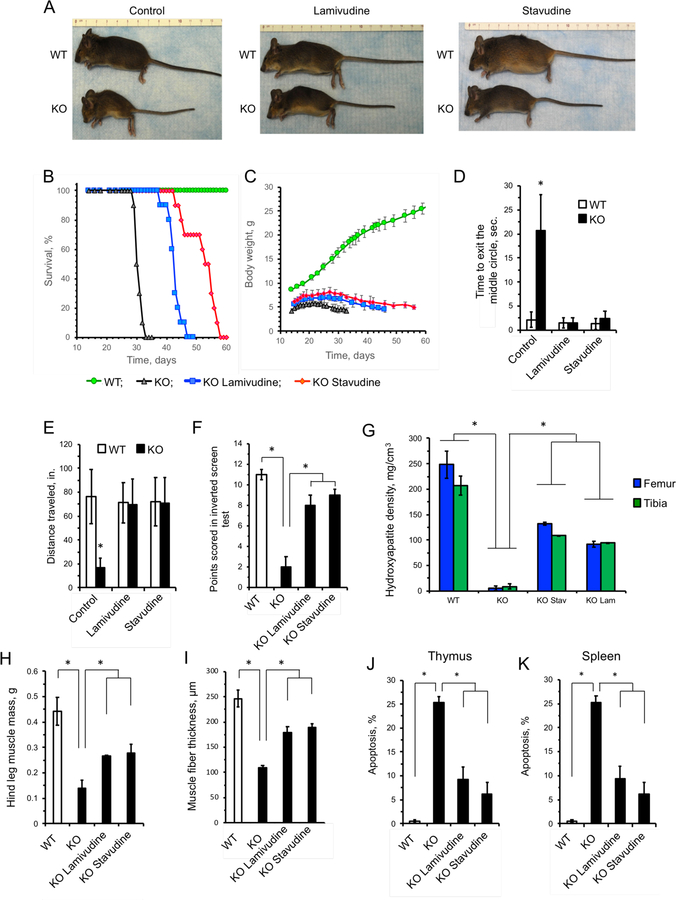
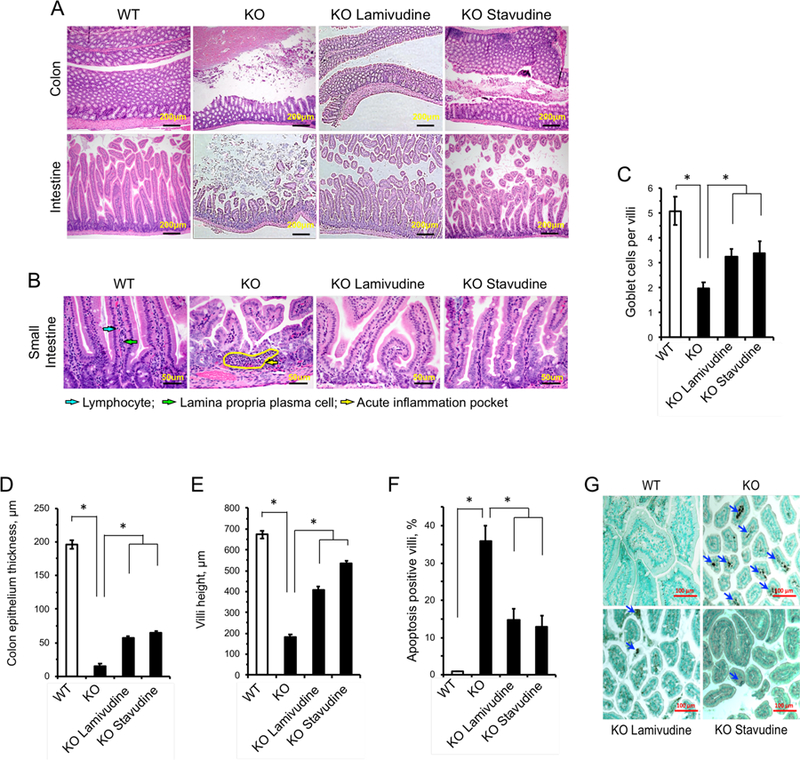
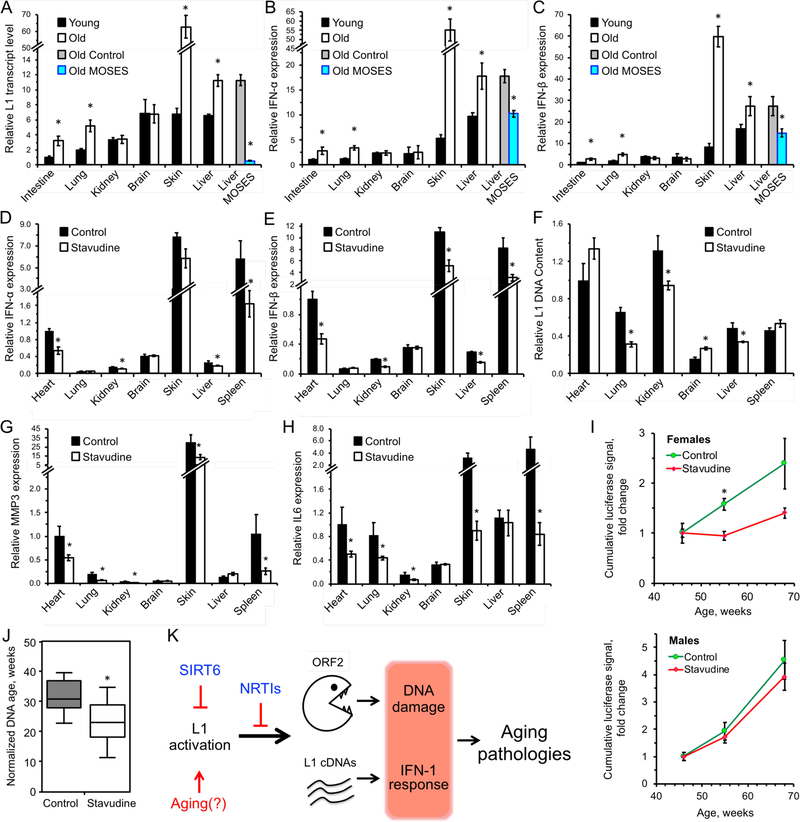
Mice deficient for SIRT6 exhibit a severely shortened lifespan, growth retardation, and highly elevated LINE1 (L1) activity. Here we report that SIRT6-deficient cells and tissues accumulate abundant cytoplasmic L1 cDNA, which triggers strong type I interferon response via activation of cGAS. Remarkably, nucleoside reverse-transcriptase inhibitors (NRTIs), which inhibit L1 retrotransposition, significantly improved health and lifespan of SIRT6 knockout mice and completely rescued type I interferon response. In tissue culture, inhibition of L1 with siRNA or NRTIs abrogated type I interferon response, in addition to a significant reduction of DNA damage markers. These results indicate that L1 activation contributes to the pathologies of SIRT6 knockout mice. Similarly, L1 transcription, cytoplasmic cDNA copy number, and type I interferons were elevated in the wild-type aged mice. As sterile inflammation is a hallmark of aging, we propose that modulating L1 activity may be an important strategy for attenuating age-related pathologies.

Keywords: SIRT6; aging; longevity; nucleotide reverse-transcriptase inhibitors; retrotransposition.


Conflict of interest statement

DECLARATION OF INTERESTS

The authors declare no competing interests.

Figures

Figure 1 |
Figure 1 |. NRTI treatment inhibits L1 retrotransposition and rescues DNA damage in SIRT6 KO cells.
A, B Treatment with either 3TC or d4T inhibits L1 retrotransposition events. WT and SIRT6 KO MEF were cultured with 10 μM 3TC or d4T and then transfected with a human (A) or mouse (B) L1-EGFP reporter plasmids containing full length L1 elements including native L1 5’ UTRs from human (Ostertag et al., 2000) or mouse (An et al., 2011). De novo retrotransposition events leading to activation of the GFP gene were scored by flow cytometry. The values were normalized for transfection efficiency using co-transfection with DsRed expression plasmid (see Figure S1A). C, NRTI treatment reduces L1 DNA copy number in cultured cells. WT and SIRT6 KO MEFs were cultured and assayed for L1 copy number every 10 population doublings (PDs). In addition (right part of the panel), cells were grown for 40 PDs with 10 μM NRTI and then assayed by qPCR. The values were normalized to 5S ribosomal RNA gene. D-E, SIRT6 KO MEFs show elevated levels of DNA damage that is alleviated by NRTI treatment. MEFs were isolated from embryos of NRTI-treated or control dams, cultured for two passages with or without NRTIs and spontaneously arising γH2AX (D) and 53BP1 (E) foci were quantified by immunostaining. ≥80 cells were counted for each treatment. Representative images are shown in Figure S1B. F, SIRT6 KO MEFs show elevated levels of DSBs as measured by the neutral comet assay, and these breaks are rescued by NRTI treatment. Values represent percent of population with excessive DNA damage denoted by tail DNA content in excess of 10%. At least 80 cells were counted for each treatment. Representative images are shown in Figure S1B. G, L1-specific knockdown rescues elevated L1 expression in SIRT6 KO cells. SIRT6 KO MEF lines were generated with siRNA or shRNA cassettes targeting conserved sequences at the 5’ portion of MdA L1 family. The knock down cassettes were stably integrated. Both cassettes repressed L1 expression. qRT-PCR data was normalized to actin. Three clones were analyzed per genotype. H, L1 RNAi rescued elevated γH2AX foci in SIRT6 KO cell lines. At least 80 cells were counted for each cell line. For PCR experiments, three independent MEF cultures of each genotype were used. Error bars show s.d. Statistical significance was determined by t-test and asterisks indicate p < 0.05.
Figure 2 |
Figure 2 |. L1 expression is induced in SIRT6 KO and aged mice and is suppressed by NRTI treatment.
A, L1 transcripts are elevated in several tissues of SIRT6 KO mice. Organs were harvested from 27 days old WT and SIRT6 KO mice. L1 mRNA was assayed via qRT-PCR and normalized to actin and WT heart was used as a reference. B, Western blot analysis of L1 ORF1p . Both WT and KO MEFs, as well as sample young (4 month; black bars) and old (24 month; while bars) WT mouse tissue, were subjected to Western blot analysis. KO cells and old WT tissue both displayed significantly elevated ORF1p staining (p < 0.001, t-test). The mouse LINE-1 ORF1p antibody (EA13 Rb Monoclonal) was developed and validated in the lab of J.D. Boeke by transfection experiments and peptide blocking. C, Immunostaining of young (5 month) and old (25 month) fixed liver tissue. Tissue samples were stained using LINE1 ORF1p (EA13). Cells were scored for positive signal and counted. n=3 animals per age group. p < 0.001, t-test D, NRTI treatment reduces L1 DNA content in SIRT6 KO mice. E, L1 DNA content in NRTI treated WT mouse tissues. L1 DNA content was assayed at 27 days old and normalized to 5S rRNA gene. Four animals were assayed for each treatment and error bars indicate s.d. Significance was determined by t-test and asterisks indicate p < 0.05.
Figure 3 |
Figure 3 |. Cytoplasmic L1 DNA is enriched in SIRT6 KO and aged WT tissues.
A, SIRT6 KO cells have cytoplasmic ssDNA and L1 DNA. Cytoplasmic ssDNA foci were observed in cultured SIRT6 KO MEFs but absent in WT cells. SIRT6 KO MEFs staining using a DNA FISH probe displayed multiple foci in the cytoplasm that were rare or absent in WT cells. 5S rDNA probes were used as control. Quantification of FISH data is shown on the right. B, Cytoplasimic L1 DNA is elevated in SIRT6 KO MEFs. Cells cultured with NRTIs show reduced cytoplasmic L1 DNA content. Cells were counted and lysed to extract cytoplasmic fraction. Serial dilutions were used to standardize loading amount. Data is presented as a ratio of L1 DNA to 5S rDNA. Dashed red line indicates the baseline ratio of L1 DNA to 5S rDNA in the nucleus (established by PCR on isolated nuclei). Black asterisks indicate p < 0.05 compared to WT, red asterisks indicated p < 0.05 compared to SIRT6 KO. C-F, Cytoplasmic L1 DNA copies are elevated in the tissues of aged (24 month old) and SIRT6 KO mice. C, liver; D, spleen; E, brain; F, skin. Data is presented as a ratio of L1 DNA to 5S rDNA. Dashed red line indicates the baseline ratio of L1 DNA to 5S rDNA in the nucleus (established by qPCR on isolated nuclei). G, cGAS expression and type I interferon expression are elevated in SIRT6 KO MEFs. Expression levels were normalized to actin. H, RNAi knockdown of cGAS correlates with decrease in type I interferon expression in SIRT6 KO MEFs. Three separate cGAS targeting shRNAs were transfected into MEF SIRT6 KO cells. A scramble shRNA sequence was used as a control. Expression levels were normalized to actin. I, cGAS-bound DNA is enriched for L1s in SIRT6 KO cells. Immunoprecipitation of cGAS from MEFs using two separate antibodies shows an average 17- and 34-fold enrichment for L1 DNA. Abundance of cGAS-bound DNA was normalized to 5S rDNA. Three independent MEF cultures or four animals of each genotype were used. Error bars show s.d. Statistical significance determined by t-test. Asterisks indicate p < 0.05.
Figure 4 |
Figure 4 |. Inhibition of reverse transcriptase rescues type I interferon response in SIRT6 KO mice.
A, B, SIRT6 KO mice display a robust type I interferon-α (A) and β (B) response that is rescued by NRTI treatment. Organs were harvested from 27 days old mice and interferon mRNA was quantified by qRT-PCR. Data normalized to actin and WT heart was used as a reference. Impact NRTI treatment on the WT control mice is shown in Figure S2A, B. n=5 animals per group, error bars show s.d. Black asterisks indicate significant differences from WT, and red asterisks indicate significant differences from water-treated SIRT6 KO. C, D, SIRT6 KO MEF lines were generated with stably integrated siRNA or shRNA cassettes targeting conserved sequences at the 5’ portion of L1 MdA family. Both cassettes rescued IFN-α/β expression. E-G, NRTI anti-RT activity is essential for L1 suppression and rescue of type I interferon response. Cells were treated with 10 μM/ml of unmodified NRTI or methylated d4T (mD4T) for 30 PD. See Figure S2D for additional analysis of methylated D4T. L1 DNA content (E) and IFN-α/β expression (F, G) were assayed by qPCR and qRT-PCR. The data was normalized to actin and WT values were used as a reference. Statistical significance was determined by the Student’s t-test and asterisks indicate p < 0.05.
Figure 5 |
Figure 5 |. Treatment with NRTIs extends lifespan and improves health of SIRT6 KO mice.
A, NRTI treatment improves the appearance and alleviates wasting phenotype of SIRT6 KO animals. Pictures were taken at 30 days of age. B, NRTI treatment extends mean and maximum lifespans of SIRT6 KO mice. The survival curves for SIRT6 KO NRTI-treated mice were significantly different from untreated SIRT6 KO controls. n=10 animals, p < 0.0001, log-rank test. C, NRTI treatment improved body weight of SIRT6 KO animals. n=10 animals. p < 0.0001, One Way ANOVA. D-F, NRTI treatment rescues physical impairments in SIRT6 KO mice. D, Open field test: healthy mice avoid unfamiliar open spaces and rapidly run to the corners when placed in the center. Time to exit the field was measured. E, Foraging activity. F, Inverted screen test measures the time a mouse holds on to an inverted mesh screen. For each animal the point score was calculated as a sum of the scores for three trials, then an average was calculated for six animals. n=6 animals per group, and three replicate tests were performed for each animal. G, Bone density of SIRT6 KO animals is significantly reduced, and is partially rescued by NRTI treatment. Data were determined by CT-scan and analysis of 27-day old animals. n=3 animals per group and error bars show s.d. Representative images of the bones are shown in Figure S4D. H, I, Hind leg muscle mass (H) and fiber thickness (I) are significantly reduced in SIRT6 KO animals and are partially rescued by NRTI treatment. Hind quarters (feet, tibia, femur were separated at pelvis, including all muscle groups, with exception of gluteus maximus) were removed and weighed. Fiber thickness was measured in quadriceps muscles fixed and stained with hematoxylin & eosin. At least 50 fibers were measured for cross sectional diameter per group at similar lateral locations on the quadriceps. n=3 animals per group, error bars show s.d. Representative images of the muscles are shown in Figure S4E. J, K, NRTIs attenuate apoptosis in the thymus (J) and spleen (K) of SIRT6 KO mice. Apoptosis was measured in single cell suspensions by annexin V/PI staining and flow cytometry. n=5 animals per group, error bars show s.d. asterisks indicate p < 0.01. Unless stated otherwise, statistical significance was determined by the Student’s t-test and asterisks indicate p < 60.05.
Figure 6 |
Figure 6 |. NRTIs improve gut health and reduce villi apoptosis in SIRT6 KO mice.
NRTI treatment alleviates tissue pathology in the SIRT6 KO colon and small intestine. Histological examination was performed on four 27 day old animals for each group and representative images are shown. A, Tissues were stained with Hematoxylin & Eosin and are shown at 100x magnification (scale bars = 200 μm). B, SIRT6 KO small intestines displayed neutrophilic acute inflammation pockets (yellow arrow) and reduced villi size, in addition to reduced epithelial thickness. Normally abundant plasma cells (green arrow) and lymphocytes (blue arrow) found in WT tissues were rarely seen in SIRT6 KO lamina propria and were not restored by NRTI treatment. Tissues were stained with Hematoxylin & Eosin (scale bars = 50 μm). C, SIRT6 KO villi have depleted goblet cell populations that are partially restored by NRTI treatment. ≥20 villi were scored. D, E, NRTI treatment restores the thickness of the epithelial layer (D) and villi height (E) in SIRT6 KO intestines. F, G, NRTI treatment partially rescues elevated apoptosis observed in SIRT6 KO villi (F). Apoptosis was analyzed by TUNEL staining and villi containing apoptotic cells were scored. G, Representative images of TUNEL results. Blue arrows indicate apoptotic cells. Statistical significance was determined by the Student’s t-test and asterisks indicate p < 0.05.
Figure 7 |
Figure 7 |. L1 transcripts and interferon response are elevated in WT aged mice and are rescued by treatment with NRTIs and SIRT6 overexpression.
A, L1 transcripts are elevated in tissues of aged (24 month old) animals, and are repressed in aged MOSES mice overexpressing SIRT6. B, C, Aged tissues show elevated IFN-α/β expression whereas MOSES mice show decreased expression. Tissues from 4 months and 24 months old BL/6 and 28 months old MOSES animals were analyzed for L1 expression. Young intestine was used as a reference for the other samples after normalization to actin. Statistical significance determined by t-test asterisk indicate p < 0.05. D, E, F, Treatment with NRTI reduces IFN-α/β and L1 DNA content in 55-week old mice. The data was normalized to actin and WT heart used as a reference. n=5 animals per group, error bars show SEM. Statistical significance was determined by t-test; asterisk indicate p < 0.05. G, H, MMP3 and IL6 show significant reduction in several tissues of d4T-treated 55-week old mice. The data was normalized to actin and WT heart was used as a reference. n=5 animals per group, Error bars show SEM. Statistical significance was determined by t-test. Asterisks indicate p < 0.05. I, D4T treatment ameliorates age-related increase in p16 expression in female p16(LUC) reporter mice. n=10 animals per sex per treatment. Statistical significance determined by t-test, asterisk indicate p < 0.05. J, DNA methylation age estimated with a multi-tissue DNA methylation clock. Analysis is based on 370 out of 435 clock sites. Each group included aged-matched male (n = 3) and female (n = mice. The mean normalized age was 32 weeks for the control (water) group and 23 weeks for the d4T-treated samples. p = 0.046, two-tailed Mann–Whitney U test. K, Model. L1 activation causes age-related pathologies through induction of DNA damage and a type I interferon response. These pathologies are rescued or attenuated by inhibition of L1 reverse transcriptase with NRTIs.

Similar articles

Cited by

References

    1. Ablasser A, Hemmerling I, Schmid-Burgk JL, Behrendt R, Roers A, and Hornung V (2014). TREX1 deficiency triggers cell-autonomous immunity in a cGAS-dependent manner. J Immunol 192, 5993–5997. - PubMed
    1. An W, Dai L, Niewiadomska AM, Yetil A, O’Donnell KA, Han JS, and Boeke JD (2011). Characterization of a synthetic human LINE-1 retrotransposon ORFeus-Hs. Mobile DNA 2, 2. - PMC - PubMed
    1. Burd CE, Sorrentino JA, Clark KS, Darr DB, Krishnamurthy J, Deal AM, Bardeesy N, Castrillon DH, Beach DH, and Sharpless NE (2013). Monitoring tumorigenesis and senescence in vivo with a p16(INK4a)-luciferase model. Cell 152, 340–351. - PMC - PubMed
    1. Crichton JH, Dunican DS, Maclennan M, Meehan RR, and Adams IR (2014). Defending the genome from the enemy within: mechanisms of retrotransposon suppression in the mouse germline. Cell Mol Life Sci 71, 1581–1605. - PMC - PubMed
    1. Dai L, Huang Q, and Boeke JD (2011). Effect of reverse transcriptase inhibitors on LINE-1 and Ty1 reverse transcriptase activities and on LINE-1 retrotransposition. BMC biochemistry 12, 18. - PMC - PubMed

Publication types

MeSH terms