. 2019 Apr 4;177(2):352-360.e13.
doi: 10.1016/j.cell.2019.01.042. Epub 2019 Mar 7.

Magnesium Flux Modulates Ribosomes to Increase Bacterial Survival

Affiliations

Magnesium Flux Modulates Ribosomes to Increase Bacterial Survival

Dong-Yeon D Lee et al. Cell. .

Abstract

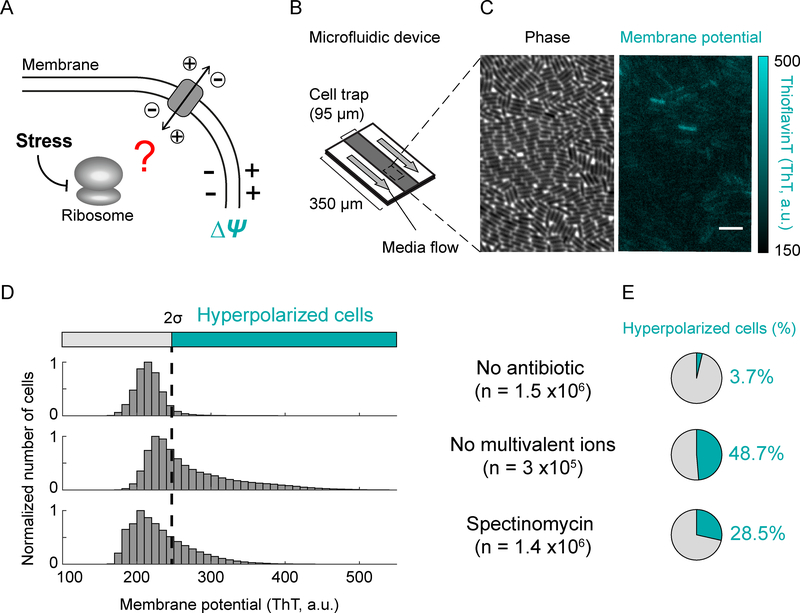
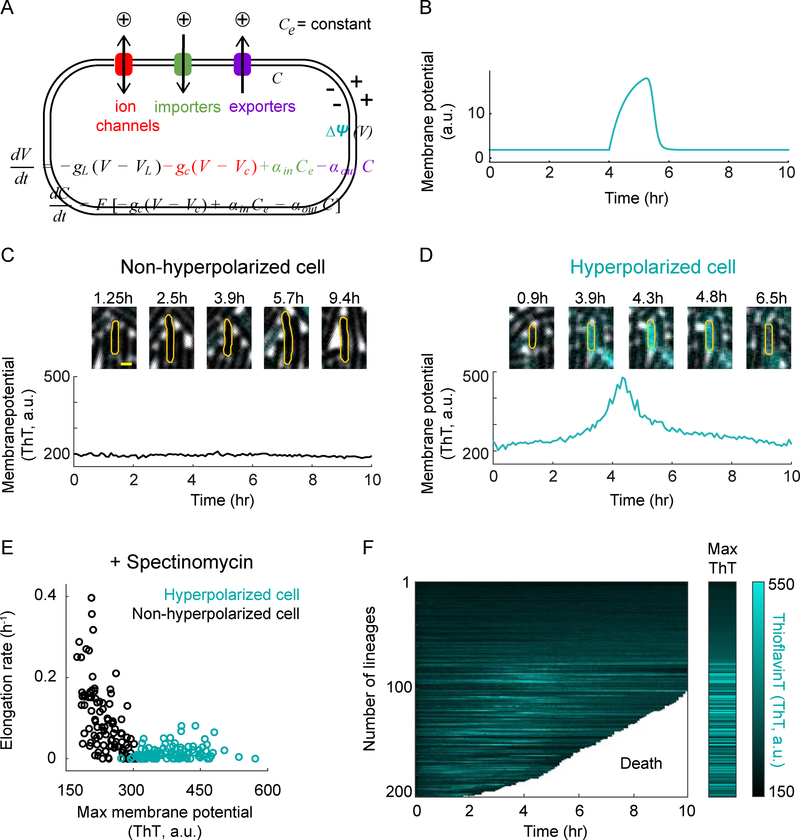
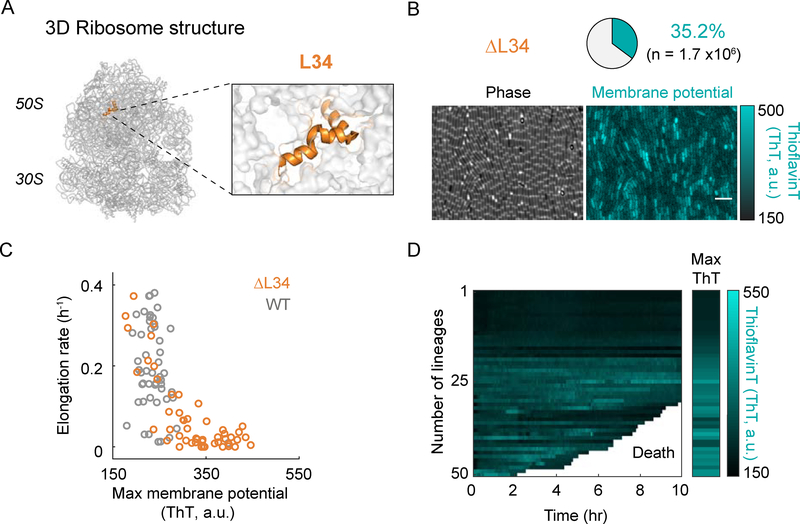
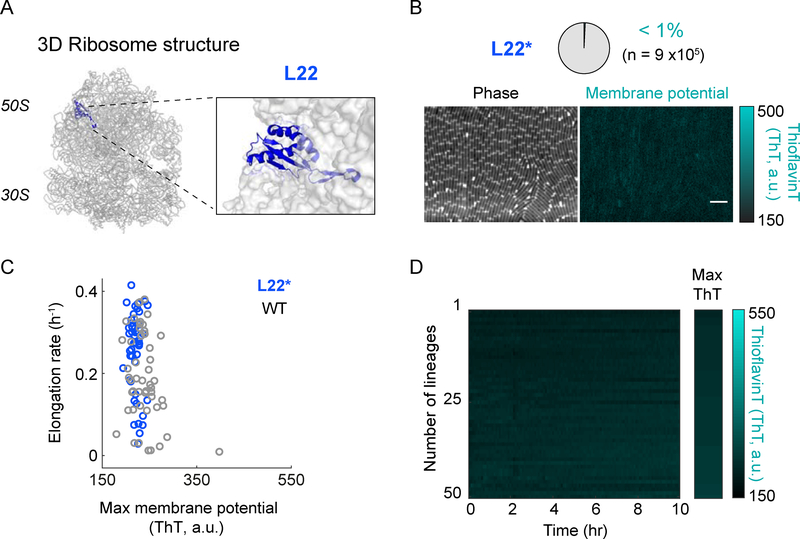
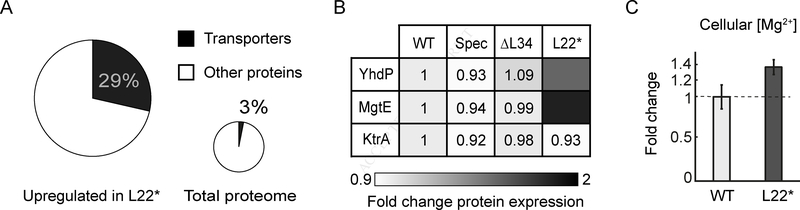
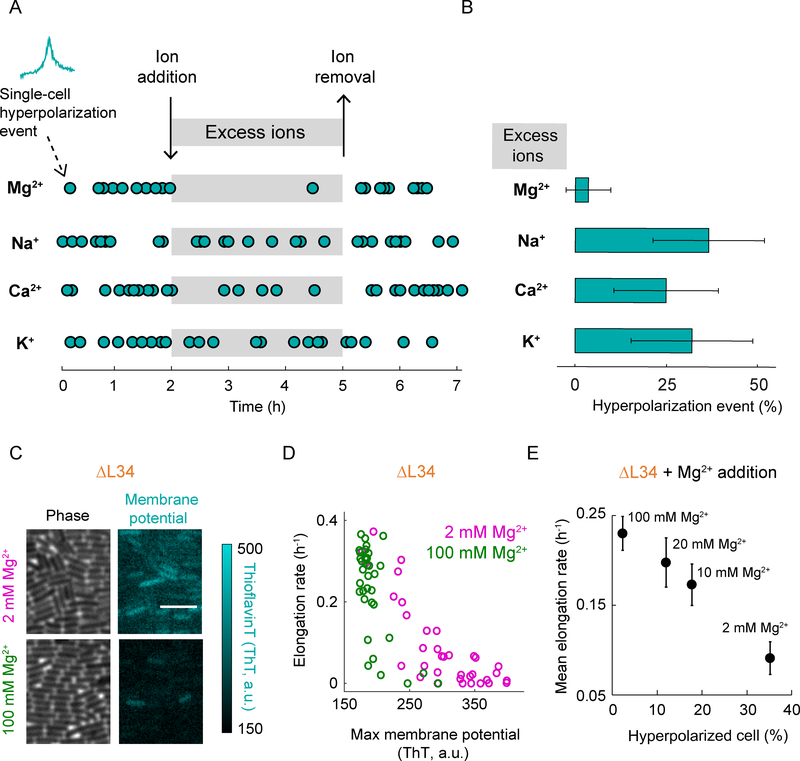
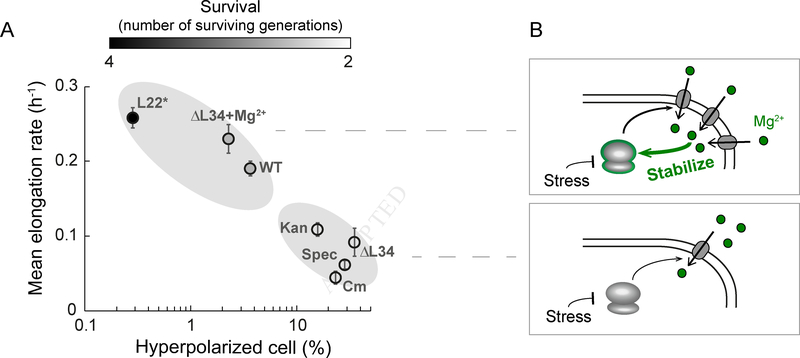
Bacteria exhibit cell-to-cell variability in their resilience to stress, for example, following antibiotic exposure. Higher resilience is typically ascribed to "dormant" non-growing cellular states. Here, by measuring membrane potential dynamics of Bacillus subtilis cells, we show that actively growing bacteria can cope with ribosome-targeting antibiotics through an alternative mechanism based on ion flux modulation. Specifically, we observed two types of cellular behavior: growth-defective cells exhibited a mathematically predicted transient increase in membrane potential (hyperpolarization), followed by cell death, whereas growing cells lacked hyperpolarization events and showed elevated survival. Using structural perturbations of the ribosome and proteomic analysis, we uncovered that stress resilience arises from magnesium influx, which prevents hyperpolarization. Thus, ion flux modulation provides a distinct mechanism to cope with ribosomal stress. These results suggest new approaches to increase the effectiveness of ribosome-targeting antibiotics and reveal an intriguing connection between ribosomes and the membrane potential, two fundamental properties of cells.

Keywords: antibiotics; bacterial survival; cations; ion flux; ion transporters; magnesium; membrane potential; ribosomes; single-cell dynamics.


Conflict of interest statement

Declaration of Interests

The authors declare no competing interests.

Figures

Figure 1.
Figure 1.
A fraction of cells exhibits an increase in membrane potential (hyperpolarization). A) Cartoon illustrating the question of whether the perturbation of ribosomes alters ion flux across the membrane. B) Schematic of the microfluidic device used in this study. Cells were grown as a single-cell layer under the cell trap with a constant flow of fresh media on both sides of the trap. C) Phase contrast (left) and corresponding fluorescence (ThT, right) images of cells. The fluorescent dye Thioflavin-T (ThT) reports on the membrane potential. The color bar (right) illustrates the intensity range of ThT-stained cells. D) Distribution of ThT intensities in a population of cells in the absence of a perturbation (top), in the absence of multivalent ions in the media (middle), or in the presence of sub-lethal doses of spectinomycin (2 mg/L, bottom). The dashed line represents two standard deviations from the mode of the wild-type, which is used as a cutoff to determine the fraction of hyperpolarized cells. ‘n’ represents the number of analyzed cells. E) Pie charts showing the percentage of hyperpolarized cells from D. See also Figure S1 and Table S3.
Figure 2.
Figure 2.
Membrane potential dynamics can be mathematically predicted and experimentally verified at the single-cell level. A) Mathematical model describing the relationship between ion flux modulation and membrane potential dynamics. B) The mathematical model predicts a transient hyperpolarization event in response to a decrease in cation influx. C) Filmstrip (top) and its corresponding membrane potential as a function of time (bottom) for a representative non-hyperpolarized cell. Yellow scale bar on the most left panel indicates 1 μm. D) Filmstrip (top) and its corresponding membrane potential as a function of time (bottom) for a representative hyperpolarized cell. E) Elongation rate as a function of maximum membrane potential (ThT) in the presence of spectinomycin for hyperpolarized (cyan, n = 100) and non-hyperpolarized (black, n = 100) cells. F) Single-cell ThT time traces showing membrane potential dynamics of the cells in panel E. The white region of the graph marks the death of the tracked cells. The Max ThT stripe shows the maximum projection of each ThT trace. The color bar (right) illustrates the intensity range of ThT-stained cells. See also Figure S2 and S3.
Figure 3.
Figure 3.
Deletion of the ribosomal protein L34 increases the fraction of hyperpolarized cells. A) A schematic of the 3D ribosome structure showing the localization of the ribosomal protein L34 (left). Right panel shows a magnified view of the L34 region. The ribosome structure was obtained from the Protein Data Bank (PDB, ID: 3j9w) and is represented using Pymol. B) Phase contrast (left) and the corresponding fluorescence (ThT, right) images of the L34 deletion mutant. The pie chart (top) illustrates the percentage of hyperpolarized cells in a population of n = 1.7×10⁶ cells. The color bar (right) illustrates the intensity range of ThT-stained cells. C) Comparison of elongation rate as a function of maximum membrane potential (ThT) for wild-type (WT, gray, n = 50) and the L34 deletion mutant (ΔL34, orange, n = 50) cells. D) Single-cell ThT time traces showing membrane potential dynamics of the cells in panel C. The white region of the graph marks the death of the tracked cells. The Max ThT stripe shows the maximum projection of each ThT trace. The color bar (right) illustrates the intensity range of ThT-stained cells. See also Figure S1C and S4A.
Figure 4.
Figure 4.
Duplication of a ribosomal protein L22 loop decreases the fraction of hyperpolarized cells. A) A schematic of the 3D ribosome structure showing the localization of the ribosomal protein L22 (left). Right panel shows a magnified view of the L22 region. The ribosome structure was obtained from the Protein Data Bank (PDB, ID: 3j9w) and is represented using Pymol. B) Phase contrast (left) and the corresponding fluorescence (ThT, right) images of the L22 loop duplication mutant (L22*). The pie chart (top) illustrates the percentage of hyperpolarized cells in a population of n = 9×10⁵ cells. The color bar (right) illustrates the intensity range of ThT-stained cells. C) Comparison of elongation rate as a function of maximum membrane potential (ThT) for wild-type (WT, gray, n = 50) and L22* mutant (blue, n = 50). D) Single-cell ThT time traces showing membrane potential dynamics of the cells in panel C. The Max ThT stripe shows the maximum projection of each ThT trace. The color bar (right) illustrates the intensity range of ThT-stained cells. See also Figure S4B, S4C, and S5.
Figure 5.
Figure 5.
Proteomics and ICP-OES data showing the enrichment of ion transporters and increased levels of cellular magnesium content in the L22* mutant strain. A) Pie chart showing the percentage of ion transporters among the upregulated proteins in the L22* strain (left, n = 21). The small pie chart illustrates the percentage of ion transporters among all measured proteins (total proteome, n = 2798). B) Table comparing the expression of two magnesium transporters (YhdP and MgtE) and one potassium transporter (KtrA) in WT, WT in the presence of spectinomycin, L34 deletion strain (ΔL34), and L22 loop duplication strain (L22*). The color bar (bottom) illustrates the fold change in protein expression. C) Relative fold change (35 ± 9%) of intracellular magnesium content in the L22* strain compared to wild-type. For details on the ICP-OES measurements, please see the methods section. See also Table S2.
Figure 6.
Figure 6.
Addition of magnesium decreases the fraction of hyperpolarized cells. A) Hyperpolarization events as a function of time in the presence (grayed region) and absence of excess ions (Mg2+, Na+, Ca2+, or K+). Each dot represents the time point of a hyperpolarization event (n = 28, 30, 32, and 28 for Mg2+, Na+, Ca2+, and K+, respectively). Cells were exposed to spectinomycin to increase the occurrence of hyperpolarization events. B) Bar plot showing the percentage of hyperpolarized cells during the addition of excess ions (Mg2+, Na+, Ca2+, or K+). Error bars represent 95% confidence interval (CI). C) Phase contrast (left column) and the corresponding fluorescence (ThT, right column) images of the L34 deletion strain in the presence of regular (2 mM, top row) and increased (100 mM, bottom row) concentrations of the Mg2+ ion. The color bar (right) illustrates the intensity range of ThT-stained cells. D) Comparison of elongation rate as a function of maximum membrane potential (ThT) for the L34 deletion strain (ΔL34) in the presence of regular (2 mM Mg2+, magenta, n = 35) and increased (100 mM Mg2+, green, n = 35) concentrations of Mg2+ ion. ‘2 mM Mg2+’ data is a duplicate of ‘ΔL34’ data in Figure 3C. E) Mean elongation rate as a function of the percentage of hyperpolarized cells for ΔL34 exposed to various Mg2+ ion concentrations (2 mM, 10 mM, 20 mM, and 100 mM). Error bars represent standard error for the y-axis and 95% CI for the x-axis. The x-axis error bars are smaller than the symbol used in this plot. See also Figure S6 and Figure S7.
Figure 7.
Figure 7.
Hyperpolarized cell fraction is correlated with mean growth rate and survival for all ribosomal perturbations tested. A) Summary of mean elongation rate as a function of hyperpolarized cell percentage (in logarithmic scale) upon ribosomal perturbations used in this study: wild-type (WT), wild-type in the presence of spectinomycin (Spec), wild-type in the presence of kanamycin (Kan), wild-type in the presence of chloramphenicol (Cm), L34 deletion strain (ΔL34), L34 deletion strain in the presence of 100 mM magnesium (ΔL34+Mg2+), and L22 loop duplication strain (L22*). Error bars represent standard error for the y-axis and 95% CI for the x-axis. The x-axis error bars are smaller than the symbol used in this plot. Color bar (top) shows the mean surviving generations during the observation period of 10 hours. B) Cartoon proposing ion flux modulation as a bacterial mechanism to cope with ribosomal stress (surviving cell: top, dying cell: bottom). See also Tables S3 and S4.

Comment in

  • Unlocking new potentials.
    Du Toit A. Du Toit A. Nat Rev Microbiol. 2019 Jun;17(6):334-335. doi: 10.1038/s41579-019-0190-9. Nat Rev Microbiol. 2019. PMID: 30911143 No abstract available.

References

    1. Akanuma G, Nanamiya H, Natori Y, Yano K, Suzuki S, Omata S, Ishizuka M, Sekine Y, and Kawamura F (2012). Inactivation of ribosomal protein genes in Bacillus subtilis reveals importance of each ribosomal protein for cell proliferation and cell differentiation. J. Bacteriol 194, 6282–6291. - PMC - PubMed
    1. Akanuma G, Kobayashi A, Suzuki S, Kawamura F, Shiwa Y, Watanabe S, Yoshikawa H, Hanai R, and Ishizuka M (2014). Defect in the formation of 70S ribosomes caused by lack of ribosomal protein L34 can be suppressed by magnesium. J. Bacteriol 196, 3820–3830. - PMC - PubMed
    1. Arganda-Carreras I, Kaynig V, Rueden C, Eliceiri KW, Schindelin J, Cardona A, and Seung HS (2017). Trainable Weka Segmentation: A machine learning tool for microscopy pixel classification. Bioinformatics 33, 2424–2426. - PubMed
    1. Armitano J, Redder P, Guimarães VA, and Linder P (2016). An essential factor for high Mg2+ tolerance of Staphylococcus aureus. Front. Microbiol 7, 1–12. - PMC - PubMed
    1. Balaban NQ, Merrin J, Chait R, Kowalik L, and Leibler S (2004). Bacterial persistence as a phenotypic switch. Science 305, 1622–1625. - PubMed

Publication types

MeSH terms

LinkOut - more resources