. 2019 Apr 4;177(2):384-398.e11.
doi: 10.1016/j.cell.2019.01.039. Epub 2019 Mar 7.

Innate Immune Signaling Organelles Display Natural and Programmable Signaling Flexibility

Affiliations

Innate Immune Signaling Organelles Display Natural and Programmable Signaling Flexibility

Yunhao Tan et al. Cell. .

Abstract

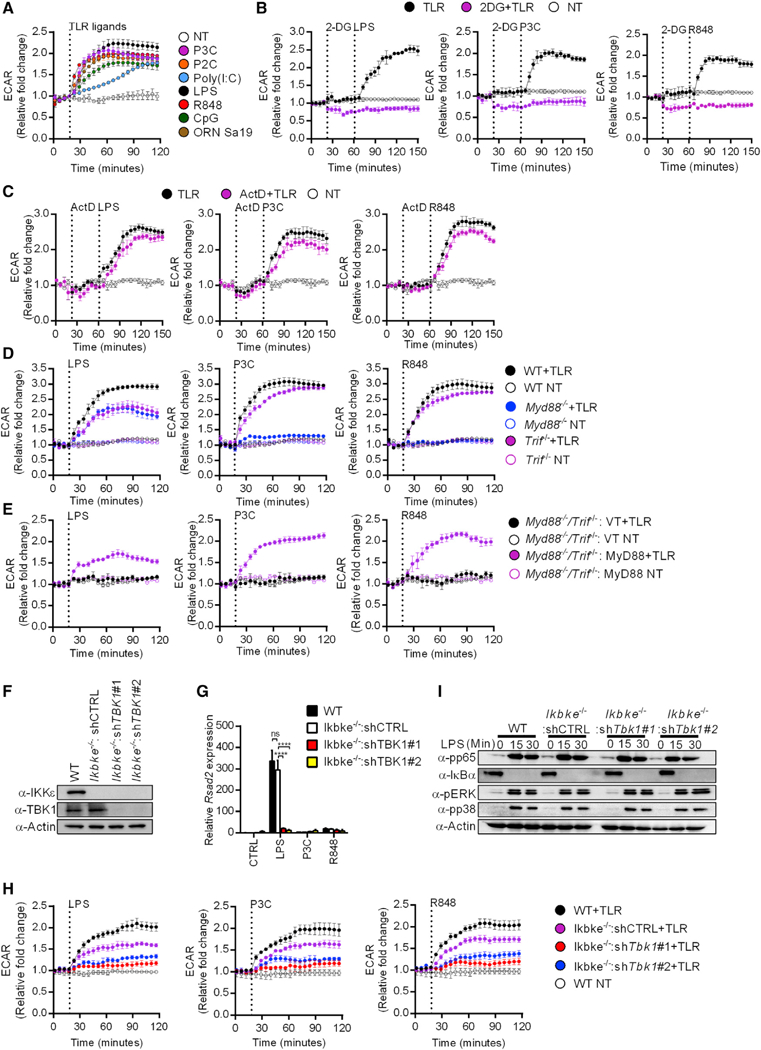
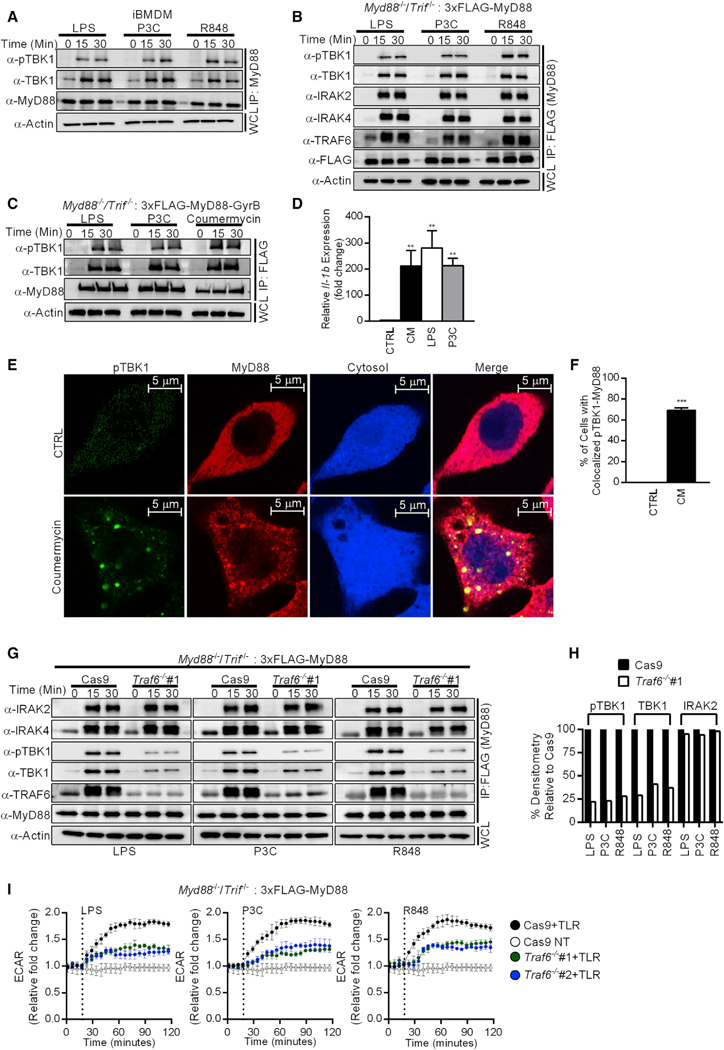
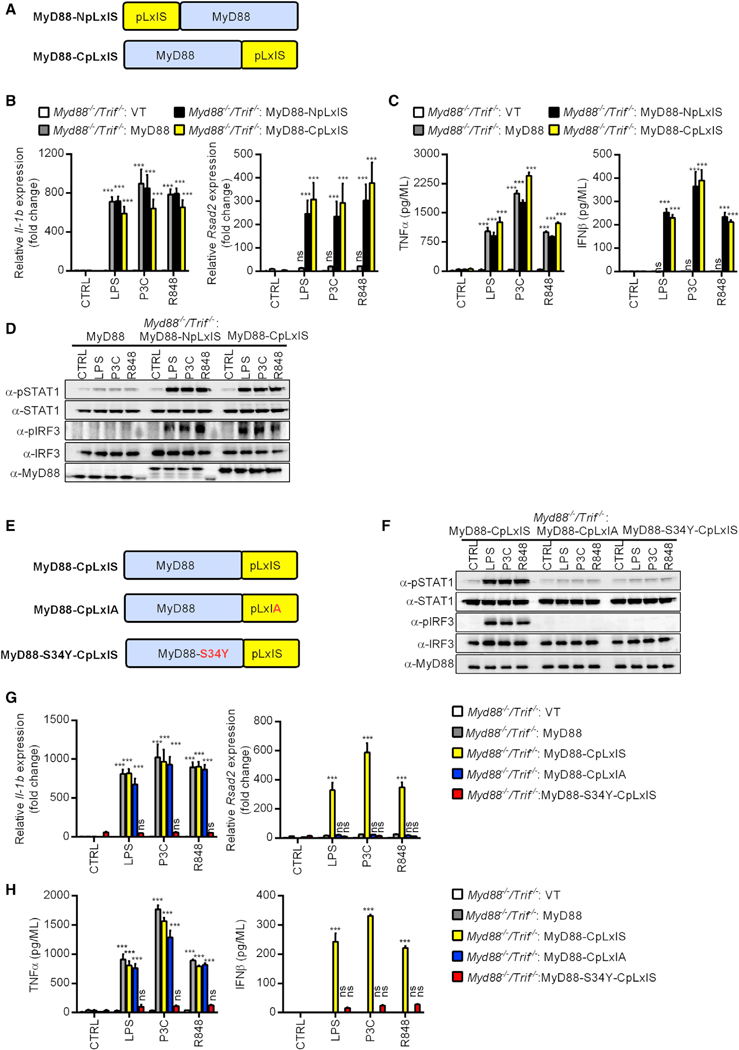
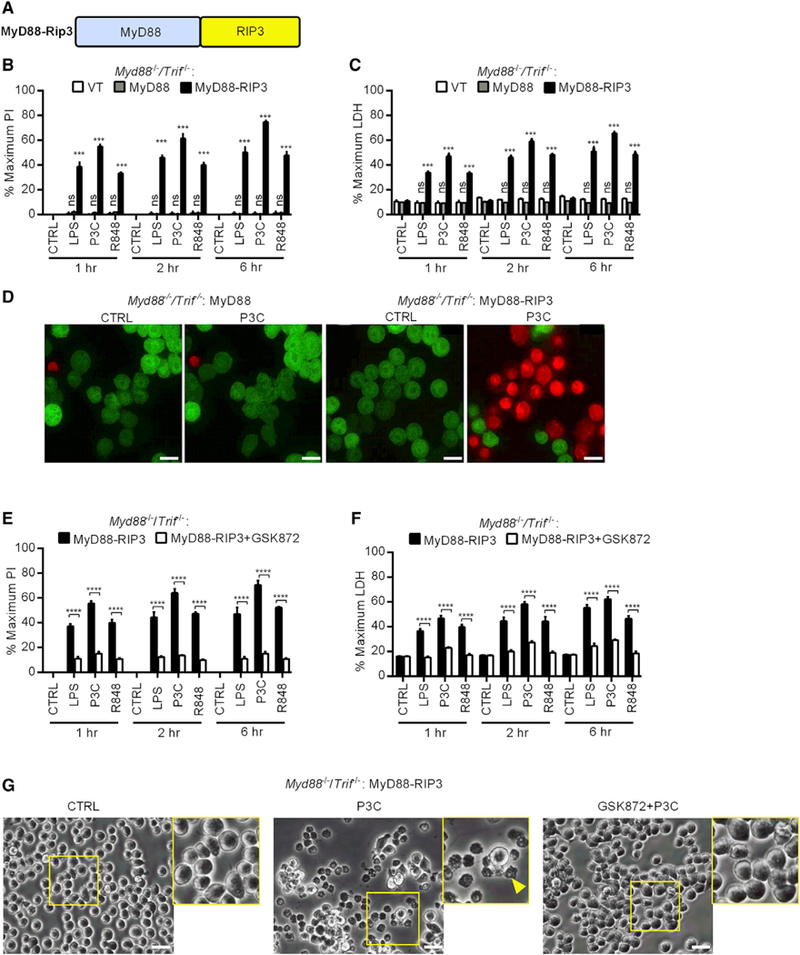
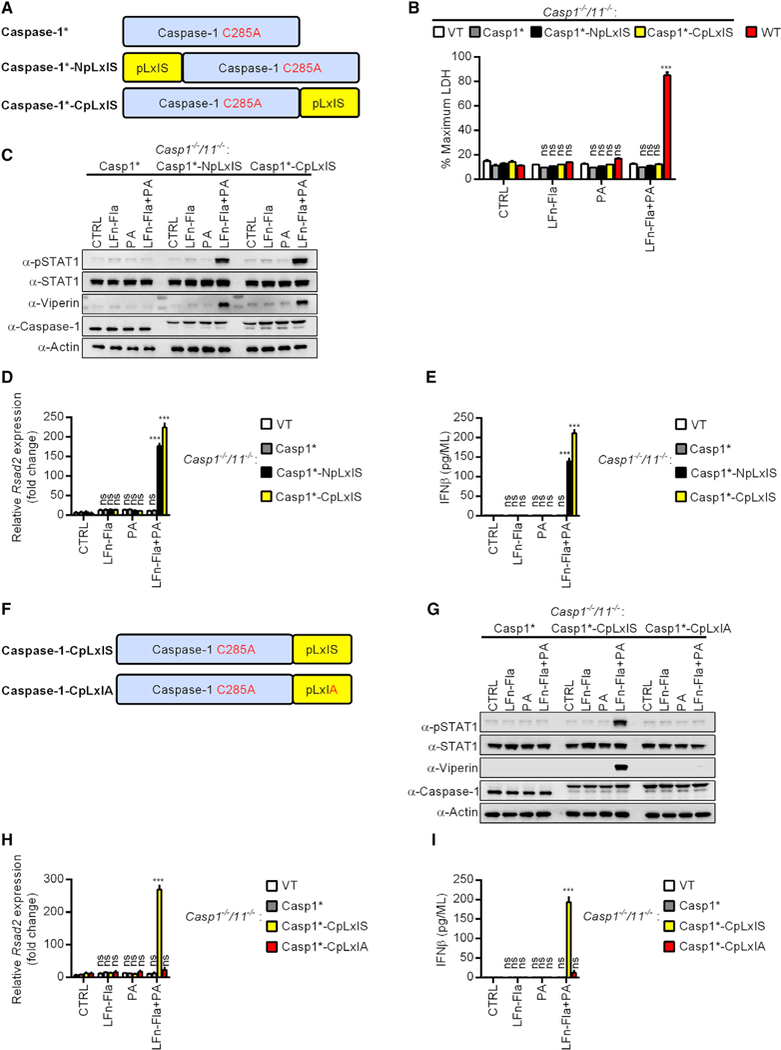
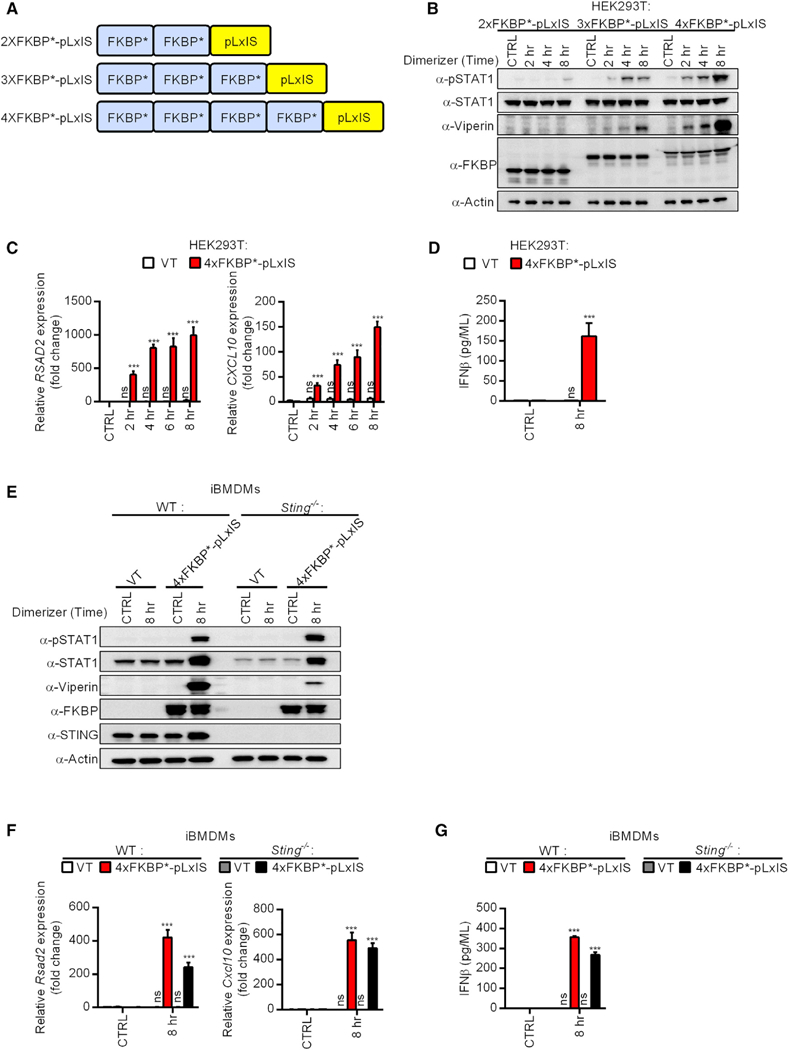
The signaling organelles of the innate immune system consist of oligomeric protein complexes known as supramolecular organizing centers (SMOCs). Examples of SMOCs include myddosomes and inflammasomes, which respectively induce transcription-dependent and -independent inflammatory responses. The common use of oligomeric structures as signaling platforms suggests multifunctionality, but each SMOC has a singular biochemically defined function. Here, we report that the myddosome is a multifunctional organizing center. In addition to promoting inflammatory transcription factor activation, the myddosome drives the rapid induction of glycolysis. We identify the kinase TBK1 as a myddosome component that promotes glycolysis, but not nuclear factor κB (NF-κB) activation. Synthetic immunology approaches further diversified SMOC activities, as we created interferon- or necroptosis-inducing myddosomes, inflammasomes that induce interferon responses instead of pyroptosis, and a SMOC-like nanomachine that induces interferon expression in response to a chemical ligand. These discoveries demonstrate the flexibility of immune signaling organelles, which permits the design of user-defined innate immune responses.

Keywords: MyD88; STING; TBK1; Toll-like Receptors; glycolysis; inflammasome; innate immunity; interferon; myddosome; synthetic biology.


Figures

Figure 1.
Figure 1.. A MyD88-TBK1 Pathway Commonly Promotes TLR-inducibie Glycolysis
(A) TLR induced changes in the ECAR of primary BMDMs stimulated with the TLR ligands indicated or left untreated (NT) were measured by the Seahorse assay. Data represent mean ± SEM of triplicate wells. Shown is one representative out of 3 independent experiments. (B) Same as (A) except stimulations were performed with or without 2-DG or left untreated (NT), as indicated. (C) Same as (A) except stimulations were performed with or without actinomycin D (ActD) or left untreated (NT), as indicated. (D) Same as (A) except stimulations were performed on primary BMDMs of the genotypes indicated. (E) Same as (A) except stimulations were performed on Myd88−/−/Trif−/− iBMDMs expressing MyD88 or an empty vector (VT). (F) Expression levels of TBK1 and IKKε were determined by western analysis in lysates from the indicated iBMDMs. (G) Indicated iBMDM lines were stimulated as indicated and Rsad2 expression was measured by qPCR. (H) Same as (A) except stimulations were performed on iBMDMs of the genotypes indicated or left untreated (NT). (I) Indicated iBMDM lines were pre-treated with cycloheximide and treated with LPS for the times indicated. Western analysis of lysates examined activation of NF-κB (pp65, IκBα) and MAP kinase (pp38, pERK) pathways. Each panel is a representative experiment of at least 3 independent repeats. See also Figure S1.
Figure 2.
Figure 2.. TBK1 Is a Component of the Myddosome
(A) iBMDMs were stimulated with LPS, P3C, and R848 for the times indicated. Components of the myddosome were determined by western analysis after MyD88 immunoprecipitations. (B) 3xFLAG-MyD88-expressing Myd88−/−/Trif−/− iBMDMs were stimulated with the ligands indicated for the times indicated. Components of the myddosome were determined by western analysis after M2 anti-FLAG immunoprecipitations. (C) Same as (B) except Myd88−/−/Trif−/− iBMDMs expressing 3xFLAG-MyD88-GyrB were examined. (D) Myd88−/−/Trif−/− iBMDMs expressing 3xFLAG-MyD88-GyrB were stimulated with coumermycin (CM), LPS, or P3C for 4 h, and Il-1b expression was analyzed by qPCR. (E and F) Myd88−/−/Trif−/− iBMDMs expressing 3xFLAG-MyD88-GyrB were stimulated with CM for 30 min and fixed. Cells were stained with antibodies detecting FLAG (for MyD88) and pTBK1. Cytosol was visualized by expression of the IRES-GFP from the retroviral vector and was pseudo-colored in blue (E). Quantification of the colocalization between pTBK1 and MyD88 staining (F). Images are representative of at least three independent experiments where more than 100 cells were examined per condition. Scale bar represents 5 μm. (G and H) Traf6-sufficient (Cas9) and Traf6-deficient (Traf6−/−#1) iBMDMs were stimulated with TLR ligands for the times indicated. Components of the myddosome were determined by western analysis after MyD88 immunoprecipitations (G). Quantification of myddosome-associated pTBK1, TBK1, and IRAK2 was performed by ImageJ (H). (I) Traf6-sufficient (Cas9) and Traf6-deficient (Traf6−/− #1 and Traf6−/− #2) iBMDMs were stimulated with TLR ligands or not (NT) for the times indicated. Real-time changes in the ECAR were measured by the Seahorse assay. Data represent mean ± SEM of triplicate wells. Shown is one representative experiment out of 3 independent experiments. For western analysis, each panel is a representative experiment of at least 3 independent repeats. See also Figure S2.
Figure 3.
Figure 3.. Myddosomes Can Be Engineered to Induce Type I IFN Responses
(A) Schematic representation of the MyD88-pLxIS alleles. (B) Myd88−/−/Trif−/− iBMDMs expressing MyD88, MyD88-NpLxIS, and MyD88-CpLxIS were stimulated with TLR ligands for 4 h. Il-1b and Rsad2 transcripts were determined by qPCR (C) Myd88−/−/Trif−/− iBMDMs expressing MyD88, MyD88-NpLxIS, and MyD88-CpLxIS were stimulated with TLR ligands for 6 h. Secreted TNF-α and IFNβ were measured by ELISA. (D) Myd88−/−/Trif−/− iBMDMs expressing MyD88, MyD88-NpLxIS, and MyD88-CpLxIS were stimulated with LPS, P3C or R848 for 90 min and lysed. Abundance of the proteins indicated was determined by western analysis. (E) Schematic representation of the selected MyD88-CpLxIS mutant alleles. (F) Myd88−/−/Trif−/− iBMDMs expressing MyD88-CpLxIS and its mutant alleles were treated with TLR ligands for 90 min and lysed. Abundance of the proteins indicated was determined by western analysis. (G) Myd88−/−/Trif−/− iBMDMs expressing MyD88-CpLxIS and its mutant alleles were treated with TLR ligands for 4 h. Il-1b and Rsad2 transcripts were determined by qPCR. (H) Myd88−/−/Trif−/− iBMDMs expressing MyD88-CpLxIS and its mutant alleles were treated with TLR ligands for 4 h. Secreted TNFα and IFNβ were measured by ELISA. For western analysis, each panel is a representative experiment of at least 3 independent repeats. See also Figure S3.
Figure 4.
Figure 4.. Myddosomes Can Be Engineered to Promote RIP3-Dependent Necroptosis
(A) Schematic representation of the MyD88-RIP3 allele. (B and C) Myd88−/−/Trif−/− iBMDMs expressing MyD88, MyD88-RIP3, or an empty vector (VT) were stimulated with LPS, P3C, or R848 for the times indicated. Membrane rupture was determined by PI staining (B) and extracellular LDH was quantified (C). (D) Myd88−/−/Trif−/− iBMDMs expressing MyD88 or MyD88-RIP3 were analyzed by confocal microscopy. Cells were stimulated with P3C in Pl-containing medium. One image was captured every 3 min for ~60 min. Shown are representative frames from a capture (see Videos S1 and S2 for full-length movies). Scale bar represents 10 μm. (E and F) Myd88−/−/Trif−/− iBMDMs expressing MyD88-RIP3 were pre-treated (or not) with GSK872 and stimulated with TLR ligands for the indicated times. Membrane rupture was determined by PI staining (E) and extracellular LDH was quantified (F). (G) Cells were treated as described in (E) and (F). Images of cell morphology were taken 1 h post-stimulation. The arrow head highlights a dead cell. Scale bar represents 10 μm. Images are representative of at least three independent experiments. See also Figure S4.
Figure 5.
Figure 5.. Inflammasomes Can Be Programmed to Prevent Pyroptosis and Induce IFN Responses
(A) Schematic representation of the caspase alleles. (B) Casp1−/−/Casp11−/− iBMDMs expressing caspase-1, caspase-1-NpLxIS, caspase-1-CpLxIS, or an empty vector (VT) were stimulated with flatox (LFn-Fla + PA) or its individual components: PA, LFn-Fla or not for 5 h. WT iBMDMs were used as positive control. Pyroptosis was quantified by measuring the extracellular LDH. (C) Same as (B) except the abundance of the proteins indicated was examined by western blot. (D) Same as (B) except Rsad2 expression was determined by qPCR. (E) Same as (B) except secreted IFNß was measured by ELISA. (F) Schematic representation of the caspase alleles. (G) Casp1−/−/Casp11−/− iBMDMs expressing caspase-1, caspase-1-CpLxIS, or caspase-1-CpLxIA were treated with flatox (LFn-Fla + PA) or its individual components: PA, LFn-Fla or not for 5 h. Abundance of the proteins indicated was examined by western blot. Actin was probed as loading control. (H) Casp1−/−/Casp11−/− iBMDMs expressing caspase-1, caspase-1-CpLxIS, caspase-1-CpLxIA, or an empty vector (VT) were treated with flatox (LFn-Fla + PA) or its individual components: PA, LFn-Fla or not for 5 h. Cells were lysed and mRNA was extracted. The level of Rsad2 expression was determined by qPCR. (I) Casp1−/−/Casp11−/− iBMDMs expressing caspase-1, caspase-1-CpLxIS, caspase-1-CpLxIA, or an empty vector (VT) were treated with flatox (LFn-Fla + PA) or its individual components: PA, LFn-Fla or not for 5 h. Secreted IFNβ was measured by ELISA. *The C285A mutation. For western analysis, each panel is a representative experiment of at least 3 independent repeats.
Figure 6.
Figure 6.. A Synthetic SMOC-like Nanomachine Drives IFN Expression in Response to a Small Molecule
(A) Schematic representation of the FKBP*-pLxIS alleles. *The F36V mutation allows for the recognition of the small molecule B/B homodimerizer, which does not engage endogenous FKBP. (B) HEK293T cells expressing the indicated FKBP*-pLxIS alleles were treated with B/B (1 μM) for the times indicated. Abundance of the proteins indicated was examined by western analysis. (C) Same as (B) except RSAD2 and CXCL10 transcripts were measured by qPCR. (D) Same as (B) except secreted IFNβ was measured by ELISA after 8 h of B/B stimulation. (E) WT and Sting−/− iBMDMs expressing 4xFKBP-pLxIS or an empty vector (VT) were treated with B/B for 8 h. Abundance of the proteins indicated was determined by western analysis. (F) Same as (E) except Rsad2 and Cxcl10 transcripts were measured by qPCR. (G) Same as (E) except secreted IFNβ was measured by ELISA. For western analysis, each panel is a representative experiment of at least 3 independent repeats.

Similar articles

Cited by

References

    1. Bonham KS, Orzalli MH, Hayashi K, Wolf AI, Glanemann C, Weninger W, Iwasaki A, Knipe DM, and Kagan JC (2014). A promiscuous lipid-binding protein diversifies the subcellular sites of toll-like receptor signal transduction. Cell 156, 705–716. - PMC - PubMed
    1. Brubaker SW, Bonham KS, Zanoni I, and Kagan JC (2015). Innate immune pattern recognition: a cell biological perspective. Annu. Rev. Immunol. 33, 257–290. - PMC - PubMed
    1. Burdette DL, Monroe KM, Sotelo-Troha K, Iwig JS, Eckert B, Hyodo M, Hayakawa Y, and Vance RE (2011). STING is a direct innate immune sensor of cyclic di-GMP. Nature 478, 515–518. - PMC - PubMed
    1. Clackson T, Yang W, Rozamus LW, Hatada M, Amara JF, Rollins CT, Stevenson LF, Magari SR, Wood SA, Courage NL, et al. (1998). Redesigning an FKBP-ligand interface to generate chemical dimerizers with novel specificity. Proc. Natl. Acad. Sci. USA 95, 10437–10442. - PMC - PubMed
    1. Clark K, Takeuchi O, Akira S, and Cohen P (2011). The TRAF-associated protein TANK facilitates cross-talk within the IkappaB kinase family during Toll-like receptor signaling. Proc. Natl. Acad. Sci. USA 108, 17093–17098. - PMC - PubMed

Publication types