. 2019 Apr 17;102(2):339-357.e7.
doi: 10.1016/j.neuron.2019.02.038. Epub 2019 Mar 7.

Cytoplasmic TDP-43 De-mixing Independent of Stress Granules Drives Inhibition of Nuclear Import, Loss of Nuclear TDP-43, and Cell Death

Affiliations

Cytoplasmic TDP-43 De-mixing Independent of Stress Granules Drives Inhibition of Nuclear Import, Loss of Nuclear TDP-43, and Cell Death

Fatima Gasset-Rosa et al. Neuron. .

Abstract

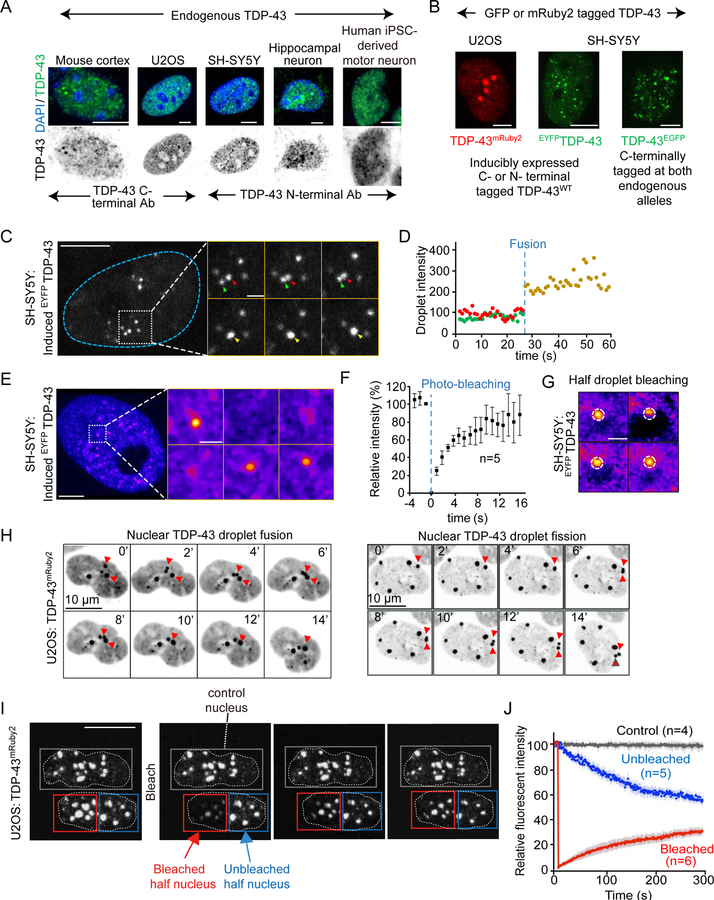
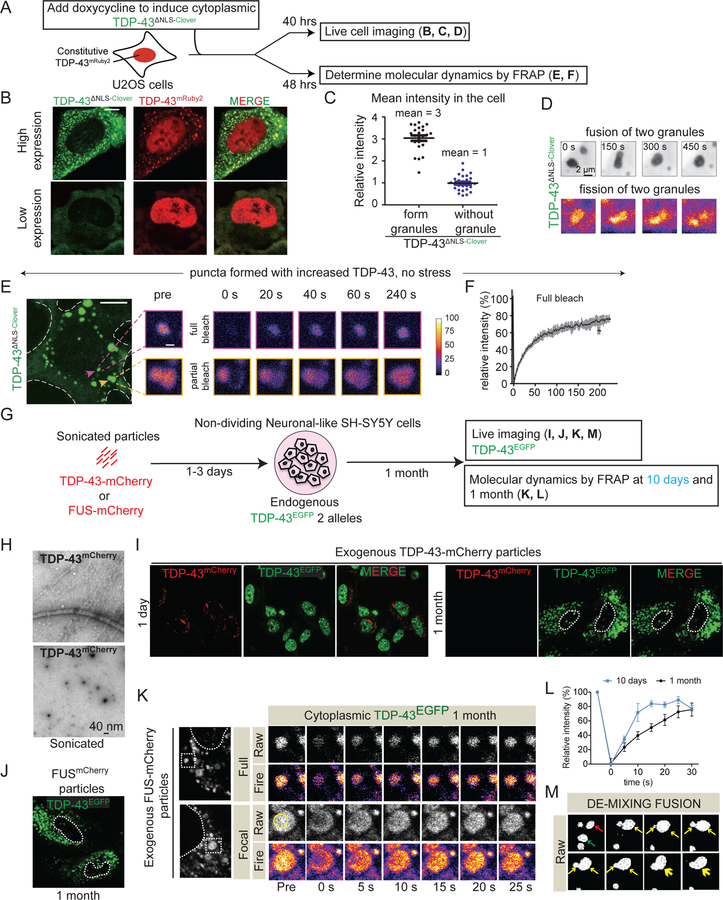
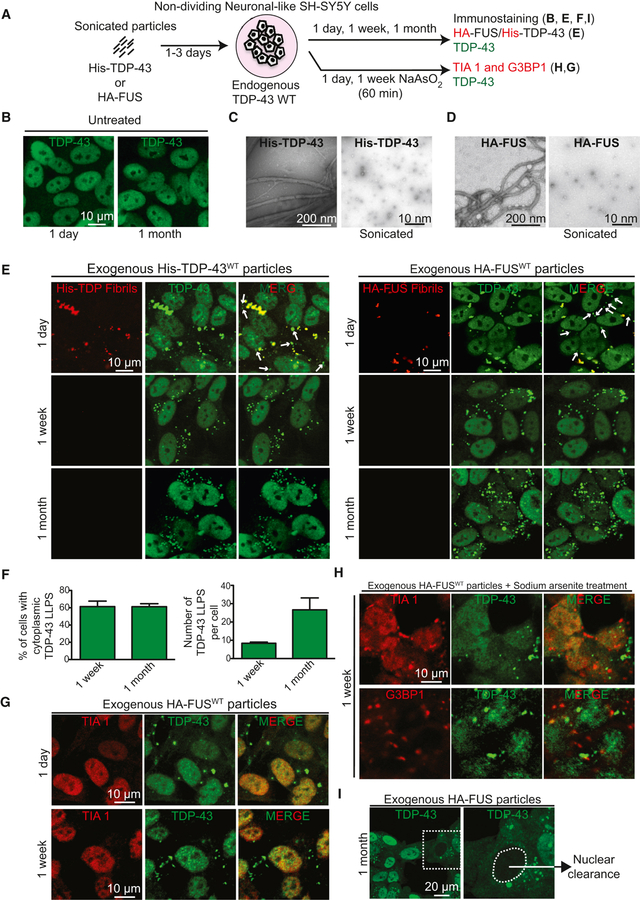
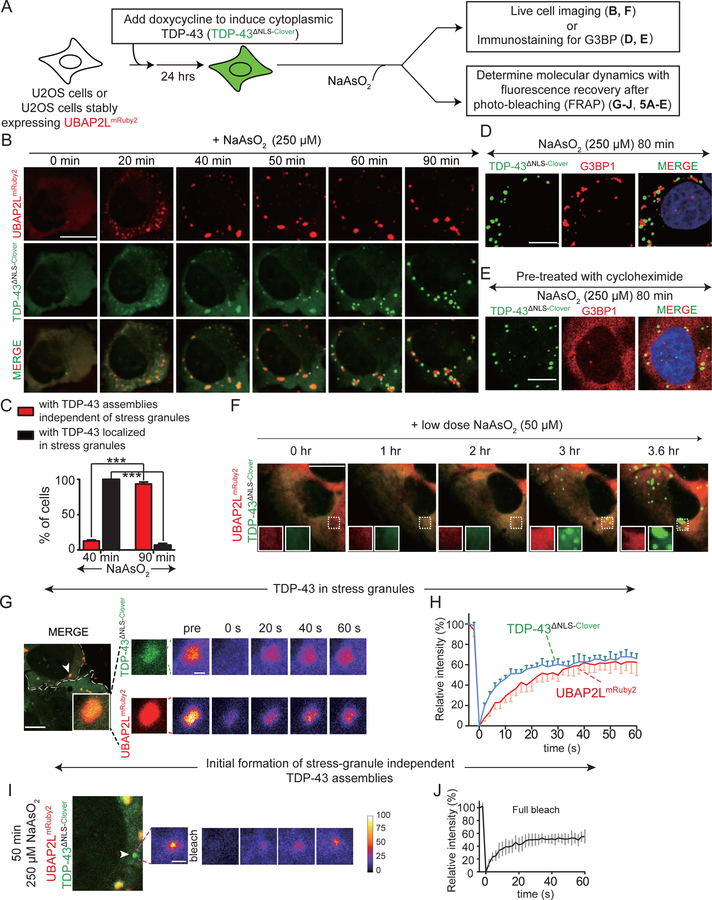
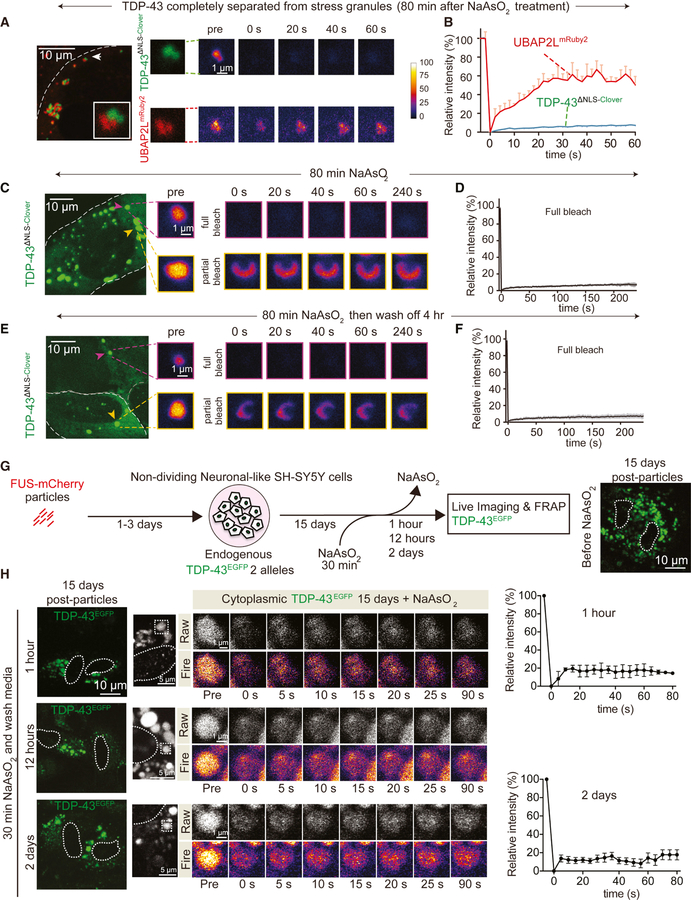
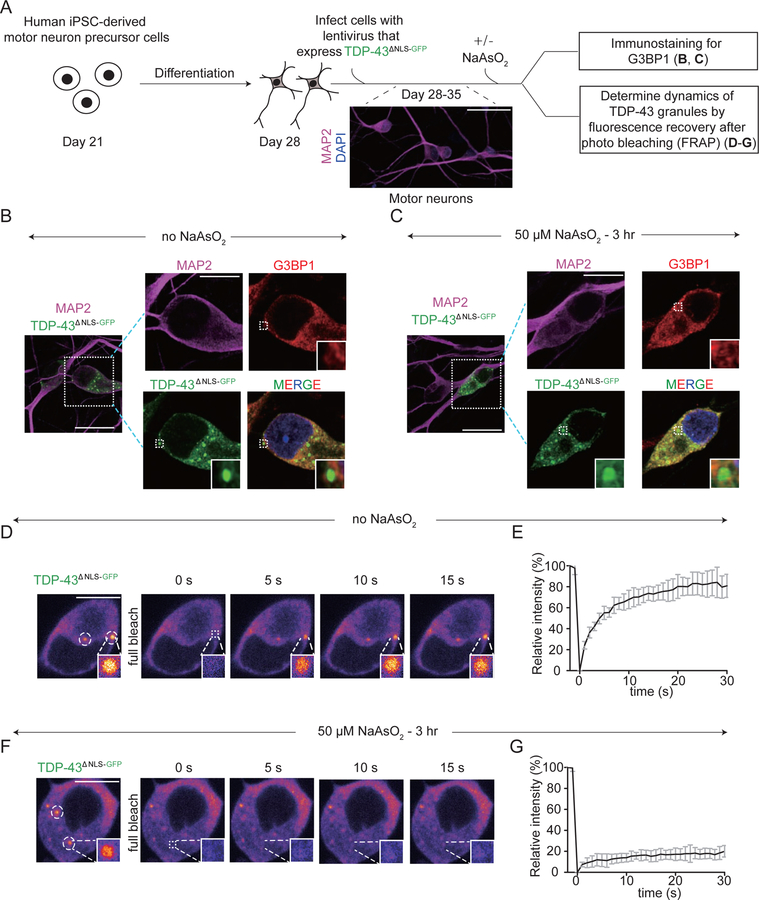
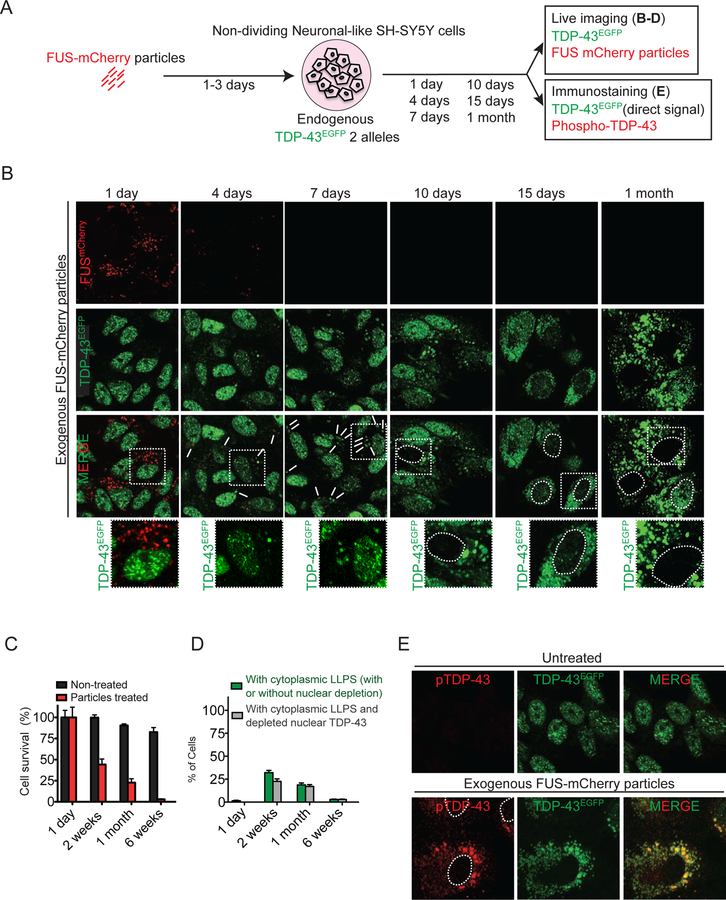
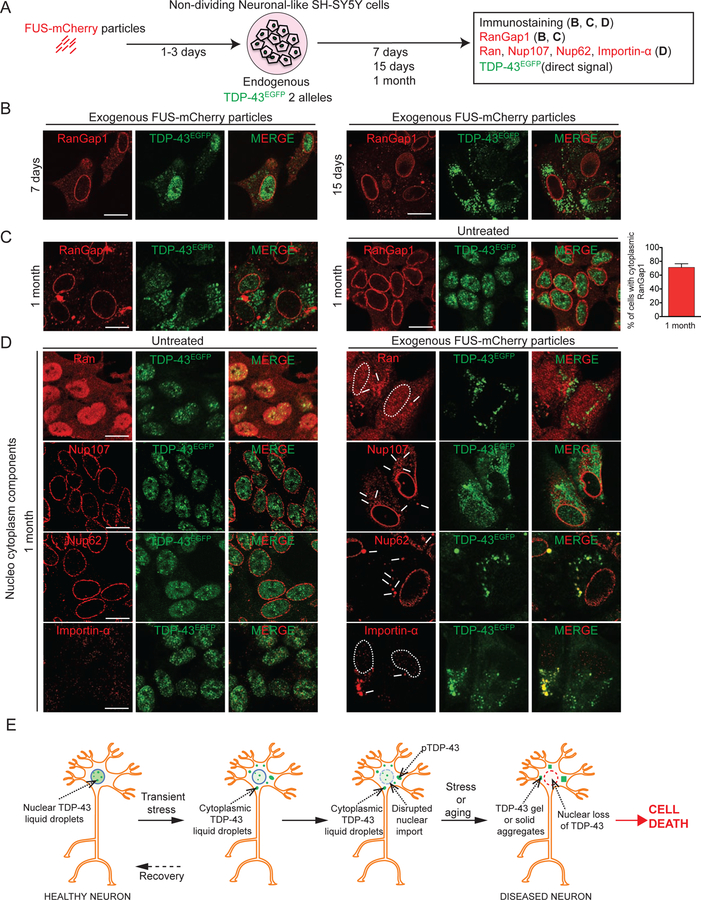
While cytoplasmic aggregation of TDP-43 is a pathological hallmark of amyotrophic lateral sclerosis and frontotemporal dementia, how aggregates form and what drives its nuclear clearance have not been determined. Here we show that TDP-43 at its endogenous level undergoes liquid-liquid phase separation (LLPS) within nuclei in multiple cell types. Increased concentration of TDP-43 in the cytoplasm or transient exposure to sonicated amyloid-like fibrils is shown to provoke long-lived liquid droplets of cytosolic TDP-43 whose assembly and maintenance are independent of conventional stress granules. Cytosolic liquid droplets of TDP-43 accumulate phosphorylated TDP-43 and rapidly convert into gels/solids in response to transient, arsenite-mediated stress. Cytoplasmic TDP-43 droplets slowly recruit importin-α and Nup62 and induce mislocalization of RanGap1, Ran, and Nup107, thereby provoking inhibition of nucleocytoplasmic transport, clearance of nuclear TDP-43, and cell death. These findings identify a neuronal cell death mechanism that can be initiated by transient-stress-induced cytosolic de-mixing of TDP-43.

Keywords: ALS/FTD; RNA-binding proteins; TDP-43; TDP-43 de-mixing; iPSCs; liquid-liquid phase separation; low complexity domains; motor neurons; neurodegeneration; nucleocytoplasmic transport; stress granules.


Conflict of interest statement

Declaration of interests

The authors declare no competing interests.

Figures

Figure 1
Figure 1. Nuclear TDP-43 de-mixes under physiological conditions.
(A) Endogenous TDP-43 detected by immunofluorescence (green) in multiple cell types (upper panels). Endogenous TDP-43 (green) and DAPI (blue); (lower panels) TDP-43 only (inverted in gray). (B) Representative images of nuclear particles of full-length TDP-43 in U2OS or SH-SY5Y cells stably expressing wild-type TDP-43 C-terminally tagged with mRuby2 (TDP-43mRuby2; left) or N-terminally tagged with EYFP (EYFPTDP-43; middle), respectively. C-terminally EGFP tagged TDP-43 expressed from both endogenous alleles in SH-SY5Y (right panel). (C) Representative fusion event of nuclear EYFPTDP-43 droplets in SH-SY5Y cells 24 hours post-induction of EYFPTDP-43 expression. Higher magnification is shown in the right panels. The green and red arrowheads point to two separated droplets before fusion, while the yellow one points to the fused droplet. (D) Fluorescence intensity of the indicated droplets in (C) before (red and green arrowheads) and after (yellow arrowhead) fusion, normalized to average droplet intensity before fusion. (E) FRAP of EYFPTDP-43 droplets in SH-SY5Y cells after 24 hours of expression. Higher magnification is shown in the right panel. The whole droplet was photobleached at 0’’. (F) Mean fluorescence intensity at the bleached area shown in (E) plotted over time, normalized to the average intensity of a droplet before photobleaching and represented as mean ± SEM [from the recovery curves of 5 droplets in a total of three independent experiments]. (G) FRAP of partial photobleaching of EYFPTDP-43 droplets in SH-SY5Y cells 24 hours after EYFPTDP-43 induction. (H) Fusion and fission events of TDP-43mRuby2 droplets in U2OS cells. Red arrowheads point to fusing or dividing droplets. (I) FRAP of nuclear TDP-43mRuby2 in U2OS cells. Half of one nucleus (outlined by the red box) was photobleached at 0’’. The blue box outlines the unbleached area of the other half of the nucleus; the gray box outlines an unbleached control nucleus in an adjacent cell. (J) Mean fluorescence intensity (normalized to the unbleached control nucleus) in the bleached and unbleached areas shown in plotted over time (represented as mean ± SEM from the recovery curves of 3 nuclei in a total of three independent experiments). See also Figure S1.
Figure 2
Figure 2. Fluorescently tagged TDP-43 de-mixes in the cytoplasm forming liquid-like droplets that are dynamic and fuse.
(A) Schematic of experimental design to assess LLPS properties of cytoplasmic TDP-43 with increasing TDP-43 levels. (B) U2OS cells expressing high and low levels of cytoplasmic TDP-43∆NLS-Clover and nuclear TDP-43mRuby2. (C) Relative fluorescence intensity of cytoplasmic TDP-43∆NLS-Clover in cells with (black dots) or without (blue dots) cytoplasmic TDP-43 particles. (D) Representative fusion and fission event of cytoplasmic TDP-43 liquid-like droplets. (E) Representative cytoplasmic TDP-43∆NLS-Clover particles (green) formed with increased accumulated levels of TDP-43 in absence of stress (left). FRAP examples of fully (upper panel) or partially (lower panel) bleached TDP-43∆NLS-Clover particles. (F) Mean fluorescence intensity of the fully bleached TDP-43∆NLS-Clover particle over time, normalized to the average intensity of the particle before photobleaching (and represented as mean ± SEM from the recovery curves of six droplets in a total of three independent experiments). See also Figure S3. (G) Experimental design to assess LLPS properties of endogenously EGFP tagged TDP-43 expressed from both endogenous TDP-43 alleles in non-cycling SH-SY5Y cells after incubation with wild-type TDP-43mCherry or FUSmCherry fibrils and visualized over time by live-imaging. (H) Electron micrographs of amyloid-like fibrils of full-length wild-type TDP-43mCherry. Bottom panel illustrates the TDP-43mCherry fibrils after sonication before inoculating them into cell media. (I) Representative images of neuronal-like SH-SY5Y cells inoculated with sonicated TDP-43mCherry fibrils at a final concentration of 200nM and further imaged for TDP-43mCherry particles (red) and TDP-43EGFP (green) up to 1 month. Media were changed after 3 days. Dashed white line outlines nuclei. (J) Neuronal-like SH-SY5Y cells imaged for direct GFP fluorescence from TDP-43EGFP (green) 1 month after transient incubation with sonicated FUSmCherry particles. (K) Cytoplasmic droplets of TDP-43EGFP expressed from both endogenous TDP-43 alleles (left panel). FRAP examples of fully or partially bleached TDP-43EGFP droplets. (L) Mean fluorescence intensity of the fully bleached TDP-43EGFP droplets over time at 10 days or 1 month, normalized to average particle intensity before photobleaching (represented as mean ± SEM from the recovery curves of 8 droplets in a total of three independent experiments). (M) Fusion event between two cytoplasmic TDP-43EGFP droplets. Arrows point to two particles (red and green) that initially fused into one (yellow arrow) at minute 2. At minute 4 another particle (new yellow arrow) fused to the newly formed LLPS at minute 12 (large yellow arrow). See also Figure S2.
Figure 3
Figure 3. Transient stress induces long-lasting untagged, cytosolic TDP-43 particles independent of conventional stress granules.
(A) Schematic of experimental design to assess endogenous wild type TDP-43 de-mixing in the cytoplasm of neuronal-like SH-SY5Y cells (non-cycling). (B) Representative images of endogenous nuclear TDP-43 in non-fibril-treated SH-SY5Y cells at day 1 (left) and after one month of culture (right). (C-D) Electron micrographs of amyloid-like fibrils of full-length wild-type His-TDP-43 (C) or HA-FUS (D) purified from bacteria. Respective right panels illustrate the His-TDP-43 or HA-FUS fibrils after sonication before inoculating them into cell media. (E) Representative images of neuronal-like SH-SY5Y cells after 1 day, 1 week or 1 month after inoculated sonicated His-TDP-43 (left) or HA-FUS fibrils (right) at a final concentration of 200nM and immunostained with His- or HA-tag (red) and TDP-43 (green) antibodies. Media was changed after 3 days. White arrows indicate cytoplasmic particles containing endogenous wild-type TDP-43 (green). (F) Quantification of the number of cells with cytoplasmic de-mixed TDP-43 over time (left panel). (Right panel) Quantification of cytoplasmic particles per cell with time (represented as mean ± SEM from 200 cells in a total of three independent experiments). (G-H) Representative images of SH-SY5Y cells incubated with sonicated HA-FUS particles and (G) immunostained after 1 day (top panel) or 1 week (bottom panel) with stress granule marker TIA1 (red) and TDP-43 (green) antibodies or (H) after treatment with NaAsO2 (0.5 mM) for 1 hour and immunostained with TIA1 or G3BP1 (red) and TDP-43 (green) antibodies. (I) Representative images of SH-SY5Y cells with apparent cytoplasmic TDP-43 de-mixing accompanied by depletion of nuclear TDP-43 1-month post-treatment with sonicated HA-FUS particles. Higher magnification of the white boxed area in the left panel (right panel). The white dashed line outlines the nucleus. See also Figure S3.
Figure 4
Figure 4. Arsenite induces cytoplasmic TDP-43 de-mixing into round, liquid-likecompartments that are distinct from stress granules.
(A) Schematic of experimental design to assess the relationship of cytoplasmic TDP-43 with stress granules (TDP-43∆NLS-Clover) in the presence of sodium arsenite. (B) Representative images of U2OS cells co-expressing stress granule protein UBAP2LmRuby2 and cytoplasmic TDP-43 (TDP-43∆NLS-Clover) after addition of 250 µM NaAsO2. White arrowheads indicate round TDP-43 particles independent of stress granules after 50 minutes of NaAsO2 treatment. (C) Quantification of TDP-43 recruitment to stress granules and cells that show formation of stress granule independent TDP-43 assemblies (from five independent frames in a live imaging experiment, total cell number from each frame = 25, 12, 30, 16, 10, respectively). Data are shown as box whisker plot (showing mean, min and max values). ***: P<0.001, paired t test. (D) Endogenous stress granules [using G3BP1 antibody (red)] in cells expressing cytoplasmic TDP-(TDP-43∆NLS-Clover; green) after treatment with NaAsO2 for 80 minutes. (E) Endogenous G3BP1 (red) in cells expressing TDP-43∆NLS-Clover (green) after pre-treatment with cycloheximide (10 µg/mL) followed by NaAsO2 treatment for 80 minutes. (F) Representative images of U2OS cells co-expressing stress granule protein UBAP2LmRuby2 and cytoplasmic TDP-43 (TDP-43∆NLS-Clover) after addition of 50 µM NaAsO2. (G) FRAP of TDP-43∆NLS-Clover (green) and UBAP2LmRuby2 (red) in a stress granule. (H) Mean fluorescence intensity of TDP-43∆NLS-Clover and UBAP2LmRuby2 plotted over time (normalized to average intensity of a droplet before photobleaching and represented as mean ± SEM from the recovery curves of a total of four granules from two independent FRAP experiments). (I) FRAP example of an initial stage formation of a cytoplasmic TDP-43∆NLS-Clover (green) droplet independent of the stress granules UBAP2LmRuby2 (red). (J) Mean fluorescence intensity of TDP-43∆NLS-Clover droplet (indicated by white arrowhead) plotted over time (lower graph). Data are normalized to the average intensity of a droplet before photobleaching (and are represented as mean ± SEM from the recovery curves of four droplets in a total of three independent experiments). See also Figure S4.
Figure 5
Figure 5. Arsenite induces liquid-liquid phase separation of cytoplasmic TDP-43 that quickly converts into a gel/solid state.
(A) Representative image using confocal microscopy of TDP-43∆NLS-Clover particles that are independent of UBAP2LmRuby2 stress granules after 80 minutes of NaAsO2 treatment (left). FRAP example of the TDP-43∆NLS-Clover particle (green) and UBAP2L granule (red) shown in the white box (of the left image). (B) Mean fluorescence intensity of a TDP-43∆NLS-Clover particle and a UBAP2LmRuby2 granule plotted over time. Data are normalized to the average intensity of a particle before photobleaching and are represented as mean ± SEM from the recovery the curves of five particles in a total of two independent experiments. (C) Representative of cytoplasmic TDP-43∆NLS-Clover particles (green) after 80 minutes of NaAsO2 treatment (left). FRAP examples of fully (upper panel) or partially (lower panel) bleached TDP-43∆NLS-Clover particles. (D) Mean fluorescence intensity of the fully bleached TDP-43∆NLS-Clover particle over time. Data are normalized to the average intensity of a particle before photobleaching and are represented as mean ± SEM from the recovery curves of five particles in a total of two independent experiments. (E) Representative image of cytoplasmic TDP-43∆NLS-Clover particles (green) after minutes of NaAsO2 treatment followed by a 4-hour wash of arsenite (left). FRAP examples of fully (upper panel) or partially (lower panel) bleached TDP-43∆NLS-Clover particles. (F) Mean fluorescence intensity of the fully bleached TDP-43∆NLS-Clover particle over time. Data are normalized to the average intensity of a particle before photobleaching and are represented as mean ± SEM from the recovery curves of seven particles in a total of two independent experiments. (G) Schematic of experimental design to assess LLPS properties of endogenous TDP-43EGFP in cells treated for 2 weeks with FUS particles and sodium arsenite. (H) Representative images of cytoplasmic endogenous TDP-43EGFP particles after 30 minutes of sodium arsenite addition in cells treated with FUS particles for 2 weeks (left panel). FRAP examples of TDP-43EGFP particles fully bleached. Mean fluorescence intensity of the fully bleached TDP-43EGFP particles over time (right). Data are normalized to the average intensity of a particle before photobleaching and is represented as mean ± SEM from the recovery curves of 4 particles in a total of three independent experiments. See also Figure S5.
Figure 6
Figure 6. De-mixing of cytoplasmic TDP-43 in human iPSC-derived motor neurons forms liquid-like droplets independent of stress granules, which convert into a gel/solid-like state after arsenite induced stress.
(A) Schematic of experimental design to assess the properties of de-mixed cytoplasmic TDP-43 particles in human iPSC-derived motor neurons with or without sodium arsenite treatment. Human iPSC-derived motor neuron precursor cells were differentiated for 7 days and then the differentiated motor neurons were infected with a lentivirus driving expression of Ubi::TDP-43∆NLS-GFP. After 1–2 weeks of expression the cells were analyzed. (B-C) Immunostaining of G3BP1 of mature motor neurons expressing cytoplasmic TDP-43 in absence of sodium arsenite treatment (B) or with 50 µM sodium arsenite (C). MAP2 was stained for neuron marker. (D-E) Representative images of cytoplasmic TDP-43∆NLS-GFP particles formed in absence of stress. FRAP example of TDP-43∆NLS-GFP particles in a neuron after a complete bleaching. (E) Mean fluorescence intensity of the fully bleached TDP-43∆NLS-GFP particles over time. Data are normalized to the average intensity of a particle before photobleaching and are represented as mean ± SEM from the recovery curves of 8 particles in a total of four independent experiments. (F-G) Representative images of cytoplasmic TDP-43∆NLS-GFP particles after 3 hours of 50 µM sodium arsenite treatment. FRAP example of TDP-43∆NLS-GFP particles in a motor neuron after a complete bleaching. (G) Mean fluorescence intensity of the fully bleached TDP-43∆NLS-GFP particles over time. Data are normalized to the average intensity of a particle before photobleaching and are represented as mean ± SEM from the recovery curves of nine particles in a total of four independent experiments.
Figure 7
Figure 7. Endogenous EGFP-tagged TDP-43 de-mixes in the cytoplasm, forming liquid-like droplets which slowly deplete nuclear TDP-43 and compromise cell survival.
(A) Schematic of experimental design to assess LLPS properties of endogenously EGFP tagged TDP-43 in non-cycling SH-SY5Y cells (knock-in in both alleles), which were incubated with fluorescently labelled wild type FUSmCherry fibrils and visualized over time by live-imaging or immunofluorescence. (B) Representative images using confocal microscopy of neuronal-like SH-SY5Y cells inoculated with sonicated His-FUSmCherry particles at a final concentration of 200nM and further imaged for FUSmCherry fibrils (red) and TDP-43EGFP (green) up to 1 month. Media was changed after 3 days. White arrows indicate cytoplasmic particles containing mislocalized endogenous TDP-43EGFP (green). Dashed white line outlines nuclei. (C) Cell survival quantification of non-treated (black) and fibril-treated (red) neuronal-like cells over time. Data are represented as mean ± SEM from a total of three independent experiments. (D) Quantification of the percentage of cells with cytoplasmic LLPS (with or without nuclear TDP-43 clearance) (green), or with cytoplasmic LLPS accompanied by nuclear clearance (gray). Data are represented as mean ± SEM from a total of three independent experiments. (E) Representative images of neuronal-like SH-SY5Y cells 1 month after inoculation of sonicated FUSmCherry fibrils and further immunostained with phospho-TDP-43 (red) and cytoplasmic TDP-43EGFP (green). See also Figure S6.
Figure 8
Figure 8. TDP-43 LLPS is accompanied by disruption of nucleocytoplasmic transport.
(A) Schematic of experimental design to assess LLPS properties of endogenous TDP-43EGFP in cells and their impact on nucleocytoplasmic transport. (B) Representative images using confocal microscopy of neuronal-like SH-SY5Y cells 7 days and 15 days post-incubation of sonicated FUSmCherry fibrils and further immunostained with RanGap1 (red) and cytoplasmic TDP-43EGFP (green). (C) Immunostained RanGap1 (red) and cytoplasmic TDP-43EGFP (green) 1 month after incubation with FUSmCherry sonicated fibrils or in absence of fibril-treatment (right panel). Quantification of the percentage of cells with cytoplasmic RanGap1 inclusions 1 month post-treatment (from 200 cells in a total of three independent experiments). (D) Representative images 1 month post-incubation and further immunostained with Ran (upper panel), Nup107 (second panel), Nup62 (third panel) and Importin-α (lower panel) (red) together with cytoplasmic TDP-43EGFP (green). See also Figure S7. (E) Schematic of how transient stress can induce cytoplasmic TDP-43 LLPS, disruption in nuclear import, accumulation of phospho-TDP-43, conversion from a de-mixed liquid to a gel/solid, depletion with time of nuclear TDP-43, and ultimately cell death.

Comment in

References

    1. Afroz T, Hock EM, Ernst P, Foglieni C, Jambeau M, Gilhespy LAB, Laferriere F, Maniecka Z, Pluckthun A, Mittl P, et al. (2017). Functional and dynamic polymerization of the ALS-linked protein TDP-43 antagonizes its pathologic aggregation. Nat Commun 8, 45. - PMC - PubMed
    1. Ayala YM, De Conti L, Avendano-Vazquez SE, Dhir A, Romano M, D’Ambrogio A, Tollervey J, Ule J, Baralle M, Buratti E, et al. (2011). TDP-43 regulates its mRNA levels through a negative feedback loop. EMBO J 30, 277–288. - PMC - PubMed
    1. Ayala YM, Zago P, D’Ambrogio A, Xu YF, Petrucelli L, Buratti E, and Baralle FE (2008). Structural determinants of the cellular localization and shuttling of TDP-43. J Cell Sci 121, 3778–3785. - PubMed
    1. Becker LA, Huang B, Bieri G, Ma R, Knowles DA, Jafar-Nejad P, Messing J, Kim HJ, Soriano A, Auburger G, et al. (2017). Therapeutic reduction of ataxin-2 extends lifespan and reduces pathology in TDP-43 mice. Nature 544, 367–371. - PMC - PubMed
    1. Boeynaems S, Alberti S, Fawzi NL, Mittag T, Polymenidou M, Rousseau F, Schymkowitz J, Shorter J, Wolozin B, Van Den Bosch L, et al. (2018). Protein Phase Separation: A New Phase in Cell Biology. Trends Cell Biol - PMC - PubMed

Publication types

MeSH terms