. 2019 Apr 9;12(4):787-800.
doi: 10.1016/j.stemcr.2019.02.002. Epub 2019 Mar 7.

Macroencapsulated Human iPSC-Derived Pancreatic Progenitors Protect against STZ-Induced Hyperglycemia in Mice

Affiliations

Macroencapsulated Human iPSC-Derived Pancreatic Progenitors Protect against STZ-Induced Hyperglycemia in Mice

Corinne Haller et al. Stem Cell Reports. .

Abstract

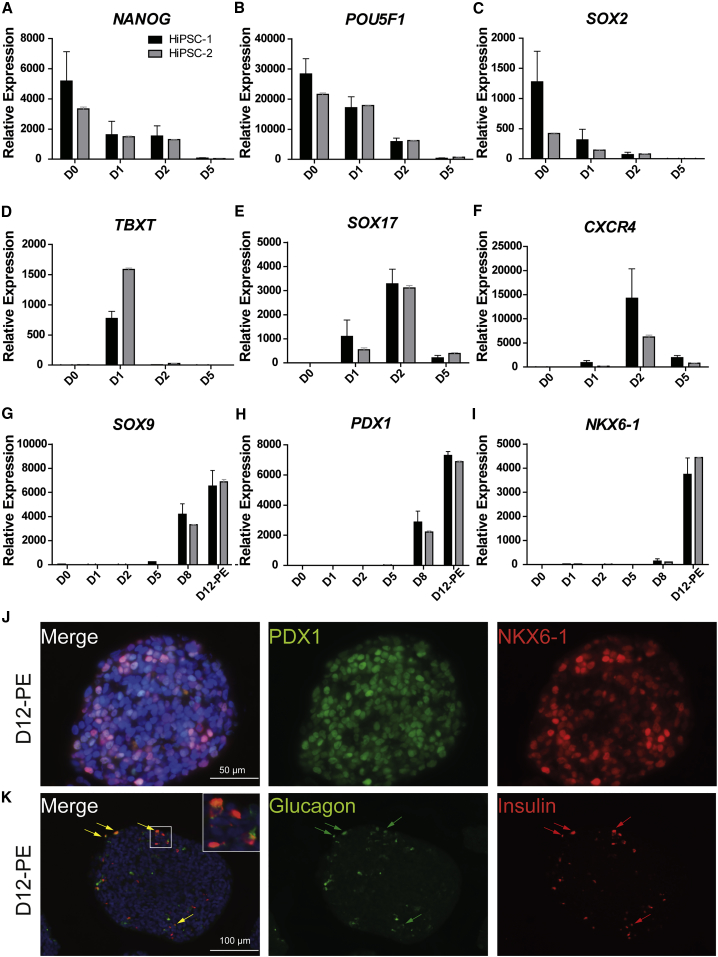
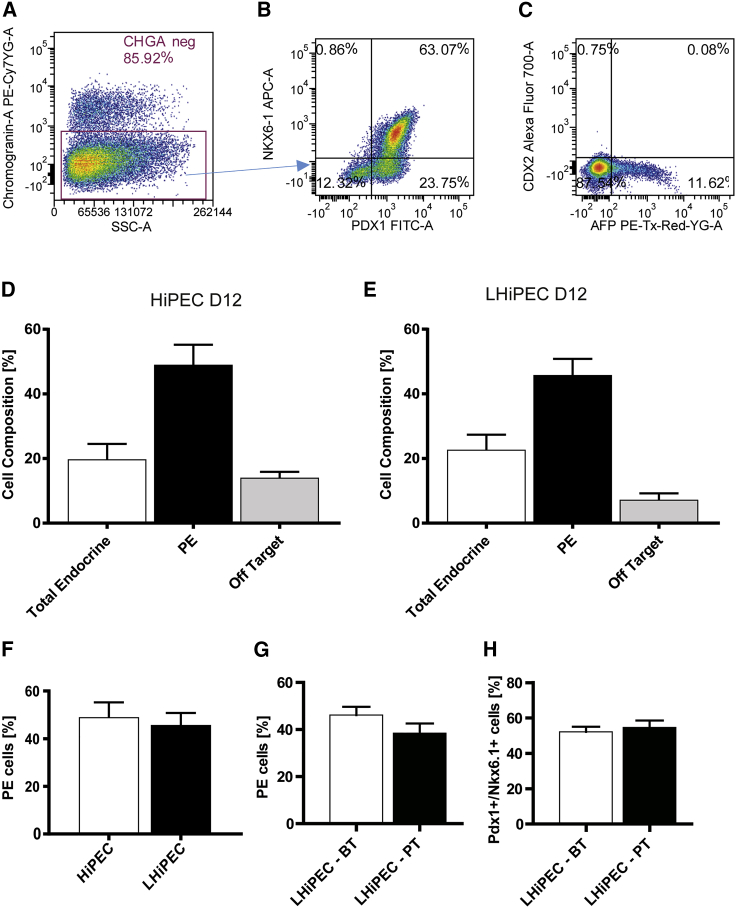
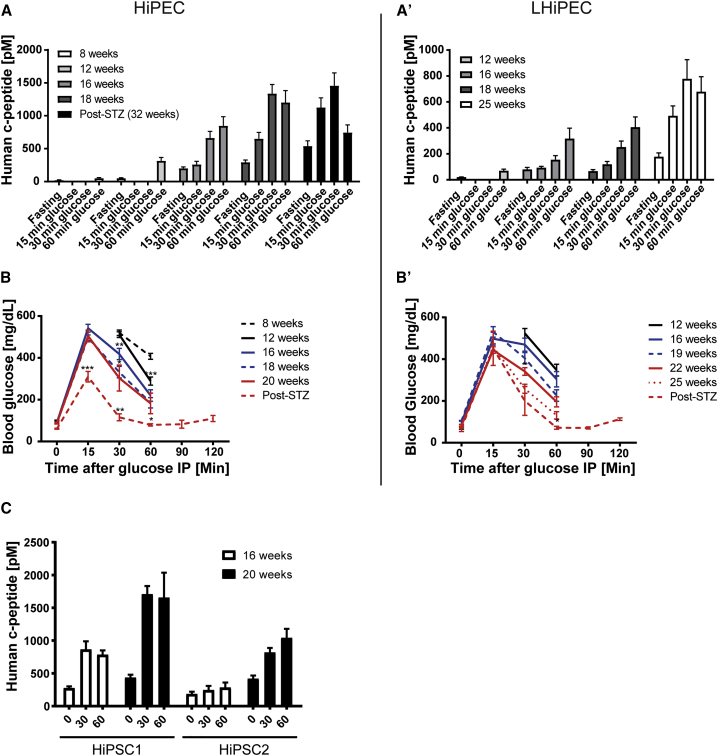
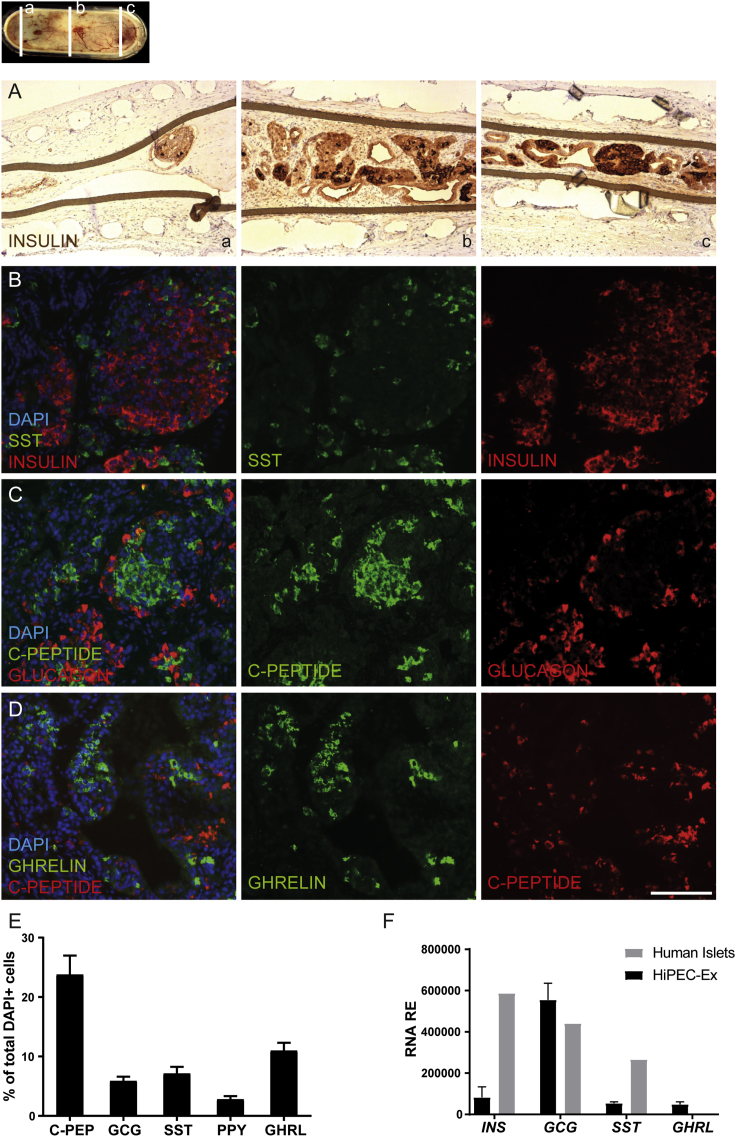
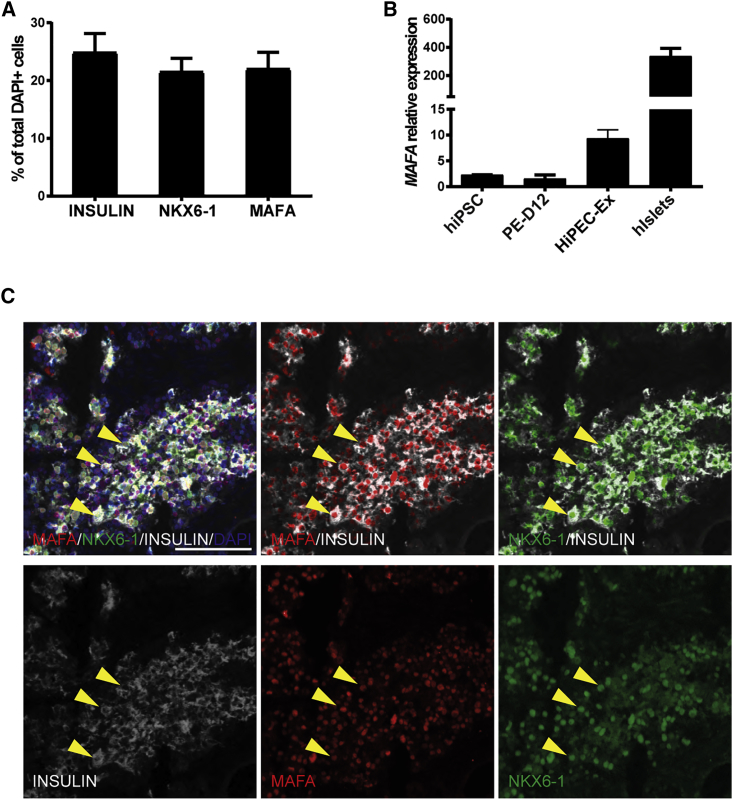
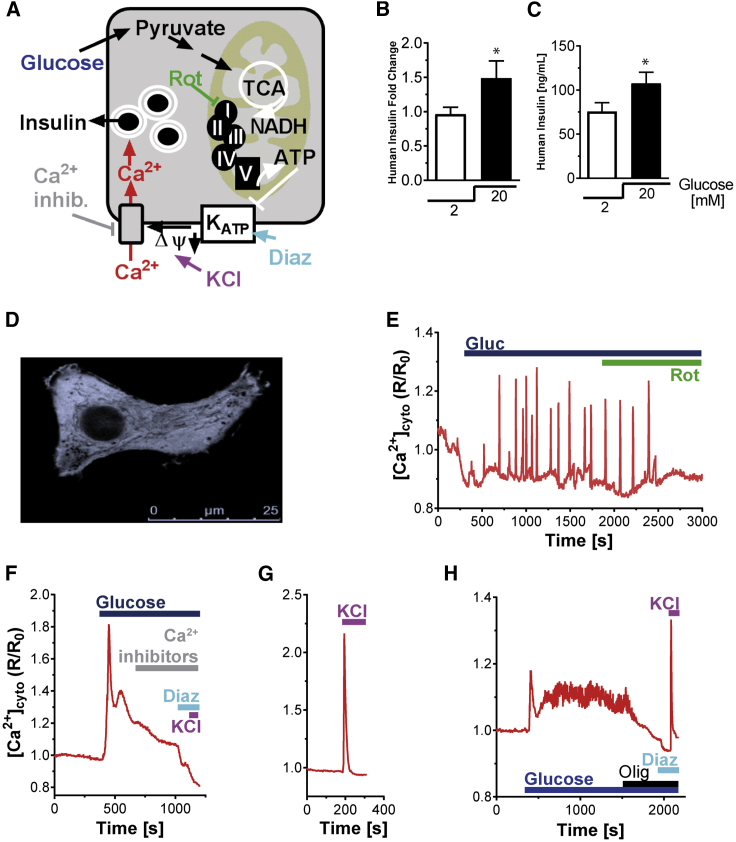
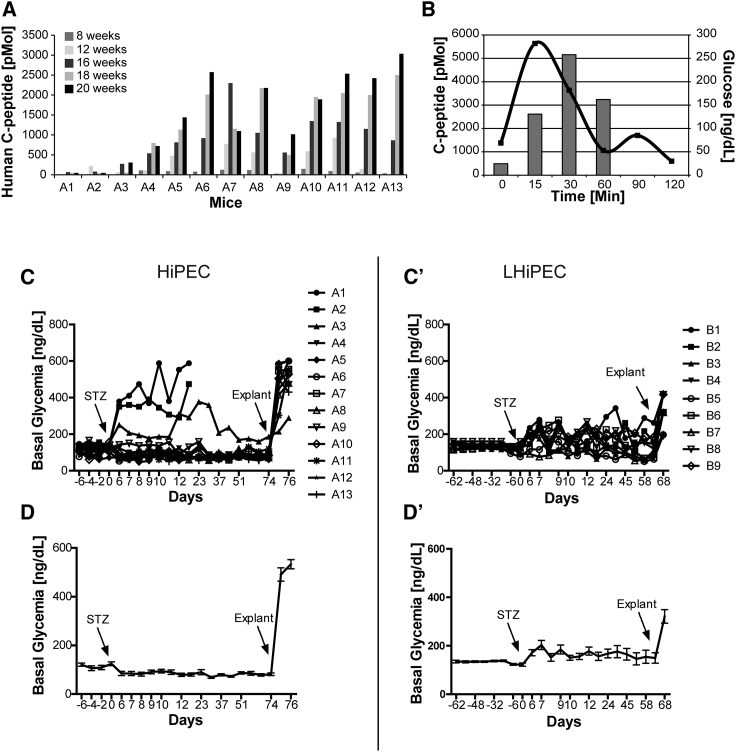
In type 1 diabetes, a renewable source of human pancreatic β cells, in particular from human induced pluripotent stem cell (hiPSC) origin, would greatly benefit cell therapy. Earlier work showed that pancreatic progenitors differentiated from human embryonic stem cells in vitro can further mature to become glucose responsive following macroencapsulation and transplantation in mice. Here we took a similar approach optimizing the generation of pancreatic progenitors from hiPSCs. This work demonstrates that hiPSCs differentiated to pancreatic endoderm in vitro can be efficiently and robustly generated under large-scale conditions. The hiPSC-derived pancreatic endoderm cells (HiPECs) can further differentiate into glucose-responsive islet-like cells following macroencapsulation and in vivo implantation. The HiPECs can protect mice from streptozotocin-induced hyperglycemia and maintain normal glucose homeostasis and equilibrated plasma glucose concentrations at levels similar to the human set point. These results further validate the potential use of hiPSC-derived islet cells for application in clinical settings.

Keywords: diabetes mellitus; differentiation; encapsulation; human; iPSC; stem cell; therapy; β cell.


Figures

Figure 1
Figure 1
Characterization of hiPSC Differentiation toward Pancreatic Endoderm Cells (A–I) RNA expression analyses of important markers modulated during differentiation of hiPSCs toward pancreatic endoderm stage comparing two different hiPSC lines, HiPSC-1 and HiPSC-2 (n = 3 independent experiments with technical duplicates). (A) NANOG, (B) POU5F1, (C) SOX2, (D) T, (E) SOX17, (F) CXCR4, (G) SOX9, (H) PDX1, (I) NKX6.1. Chart bars represent relative expression value average and error bars represent SD. (J and K) Immunofluorescence of cell aggregates at pancreatic endoderm stage (D12-PE). (J) Staining for PDX1 and NKX6-1. Scale bar, 50 μm. (K) Staining for glucagon and insulin. Scale bar, 100 μm. Arrows show polyhormonal cells. Nuclei are stained in blue with DAPI.
Figure 2
Figure 2
Cell Composition Analyses of HiPECs and LHiPECs (A–C) Flow cytometry analysis of cell composition of HiPEC and LHiPEC at day 12 of differentiation. Cells were labeled to determine the endocrine polyhormonal population (chromogranin A positive), the pancreatic endoderm population (chromogranin A negative, PDX1+ and NKX6-1+), and the off-target population (CDX2+, AFP+). Representative pictures from flow cytometry analysis of (A) chromogranin A (gated on side scatter), (B) PDX1 and NKX6-1 (gated on chromogranin A negative), and (C) AFP and CDX2 (gated on side scatter). (D and E) Ratios over the total population for each individual population of (D) HiPEC and (E) LHiPEC generated cells. (F) Comparison of percentage of PECs in HiPECs versus LHiPECs. (G) Comparison of percentage of PECs in LHiPECs before and after cryopreservation. (H) Comparison of percentage of PDX1+/NKX6-1+ cells in LHiPECs before and after cryopreservation. For HiPEC and LHiPEC analyses, n = 5 and n = 8 independent experiments, respectively. Error bars represent SEM.
Figure 3
Figure 3
Human c-peptide Detected in Sera of Mice Implanted with HiPECs and LHiPECs (A and A′) Analyses of blood glucose levels and serum levels of human c-peptide in mice implanted with hiPSC-derived pancreatic endoderm cells. Mice implanted with (A) HiPSC-1-derived or (A′) LHiPSC-derived pancreatic endoderm cells were analyzed at the corresponding indicated post-engraftment times for serum levels of human c-peptide following intraperitoneal glucose administration. (B and B′) (B) Mice implanted with cells as shown in (A), and (B) those shown in (A′), were analyzed at the indicated post-engraftment times for blood glucose levels following intraperitoneal (IP) glucose administration. Averages of blood glucose levels in response to intraperitoneal glucose tolerance test are shown for the indicated post-engraftment times. (A and B) n = 20–29 animals (three independent experiments); (A′ and B′) n = 12 animals (two independent experiments). (C) Comparative analyses at the indicated post-engraftment times of serum levels of human c-peptide in cohorts of mice implanted with HiPSC-1-derived pancreatic endoderm cells (n = 9 animals, two independent experiments) or HiPSC-2-derived pancreatic endoderm cells (n = 5 animals). Error bars indicate SEM. Statistical analysis was performed by Student’s t test (p < 0.05; ∗∗p < 0.01; ∗∗∗p < 0.001).
Figure 4
Figure 4
Pancreatic Endocrine Hormone Expression in HiPEC-1-Derived Grafts Micrographs of serial sections of immunohistochemistry and immunofluorescence analyses of HiPEC-1-derived graft samples 32 weeks post-engraftment for pancreatic endocrine hormone expression. (A) Staining for insulin. (B) Staining for somatostatin (SST) and insulin. (C) Staining for human c-peptide and glucagon. (D) Staining for ghrelin and c-peptide. Scale bar, 100 μm. (E) Cell composition quantification by high content image analysis of the indicated pancreatic endocrine hormones. Values were normalized to DAPI-positive cells (n = 6 explants). (F) RNA expression analysis of the indicated markers in HiPEC-1-derived explants (n = 2 explants) and control human islet (n = 2 donors) samples. Error bars indicate SD.
Figure 5
Figure 5
Expression of Mature β Cell Markers in HiPEC-1-Derived Grafts (A) Cell composition quantification by high content image analysis for insulin, NKX6-1, and MAFA. Values were normalized to DAPI-positive cells (n = 6 animals). (B) qRT-PCR analyses for MAFA transcript in hiPSCs (n = 2 lines), PE-D12 (n = 6 differentiations), explants (n = 4), and human islets (n = 2 donors). Error bars indicate SEM. (C) Extracted immunofluorescence staining from high content imaging for MAFA (red), NKX6-1 (green), and INSULIN (white). The three yellow arrowheads point to three cells showing triple-positive staining. Scale bar, 50 μm.
Figure 6
Figure 6
Glucose-Stimulated Ca2+-Signaling Pathway Characterization in hiPSC-Derived Pancreatic β Cells after In Vivo Differentiation (A) Model for Ca2+-dependent coupling of glucose metabolism to insulin secretion in the pancreatic β cells. (B and C) Human insulin secretion levels measured on ex vivo tissue samples after glucose exposure. Values are expressed as (B) fold change (n = 8 explants; p = 0.0371) or (C) concentration (ng/mL) (p = 0.0352) (C). (D) Cytosolic signal of Ca2+ sensor AD-RIP-YC3.6cyto recorded at 535 nm in HiPEC-1-derived β cells. Scale bar, 25 μm. (E–G) Examples of Ca2+ responses in individual HiPEC-1-derived β cells, stimulated with 16.7 mM glucose and subsequently treated with (E) Rotenone (Rot; 1 μM), (F) diazoxide (Diaz; 100 μM; KATP channel activator), and the three voltage-dependent Ca2+ channel blockers (Ca2+ inhibitor: Isidipine [20 μM], ω-agatoxin [400 nM], NNC 55-0396 [2 μM]) (F), and KCl (30 mM) (F and G). The ratiometric signals were normalized to basal (set to 1). Data are representative of 14 glucose stimulation experiments (40 cells). Diazoxide, Rotenone, and KCl effects were confirmed in 11, 6, and 7 experiments, respectively. The effect of the Ca2+-channels blockers followed by KCl depolarization was repeated three times. (H) Example of a control human β cell Ca2+ signaling trace. Statistical analysis was performed by Student’s t test. Error bars indicate SEM.
Figure 7
Figure 7
Analyses of STZ-Treated Mice (A) Mice implanted with HiPECs were analyzed at the indicated weeks post-engraftment for serum levels of human c-peptide after intraperitoneal glucose administration. The highest c-peptide values detected post-glucose challenge are represented for each time point. (B) Glucose tolerance test, blood glucose levels, and c-peptide levels are shown for mouse A5 after intraperitoneal glucose administration. (C, C′, D, and D′) (C) Independent and (D) average values of non-fasting blood glucose levels measured in 13 animals represented in (A) before and for 74 days after STZ treatment (STZ at 22 weeks post-engraftment time). Average values exclude animals A1, A2, and A3 that lost glucose control due to the absence of human c-peptide secretion. At day 74 post-STZ (10 weeks), mice were explanted and blood glucose levels were monitored post-explantation. (C′) Independent and (D′) average values of non-fasting blood glucose levels measured before and for 68 days after STZ treatment (STZ at 25 weeks post-engraftment time) in 9 animals implanted with LHiPECs. At day 67 post-STZ (9 weeks), mice were explanted and blood glucose levels were measured post-explantation. Error bars represent SEM.

Similar articles

Cited by

References

    1. Bruin J.E., Asadi A., Fox J.K., Erener S., Rezania A., Kieffer T.J. Accelerated maturation of human stem cell-derived pancreatic progenitor cells into insulin-secreting cells in immunodeficient rats relative to mice. Stem Cell Reports. 2015;5:1081–1096. - PMC - PubMed
    1. Castaing M., Peault B., Basmaciogullari A., Casal I., Czernichow P., Scharfmann R. Blood glucose normalization upon transplantation of human embryonic pancreas into beta-cell-deficient SCID mice. Diabetologia. 2001;44:2066–2076. - PubMed
    1. D'Amour K.A., Agulnick A.D., Eliazer S., Kelly O.G., Kroon E., Baetge E.E. Efficient differentiation of human embryonic stem cells to definitive endoderm. Nat. Biotechnol. 2005;23:1534–1541. - PubMed
    1. D'Amour K.A., Bang A.G., Eliazer S., Kelly O.G., Agulnick A.D., Smart N.G., Moorman M.A., Kroon E., Carpenter M.K., Baetge E.E. Production of pancreatic hormone-expressing endocrine cells from human embryonic stem cells. Nat. Biotechnol. 2006;24:1392–1401. - PubMed
    1. De Marchi U., Thevenet J., Hermant A., Dioum E., Wiederkehr A. Calcium co-regulates oxidative metabolism and ATP synthase-dependent respiration in pancreatic beta cells. J. Biol. Chem. 2014;289:9182–9194. - PMC - PubMed

Publication types

MeSH terms

LinkOut - more resources