. 2019 May 21:407:53-66.
doi: 10.1016/j.neuroscience.2019.02.031. Epub 2019 Mar 8.

Non-Invasive Assays of Cochlear Synaptopathy - Candidates and Considerations

Affiliations

Non-Invasive Assays of Cochlear Synaptopathy - Candidates and Considerations

Hari M Bharadwaj et al. Neuroscience. .

Abstract

Studies in multiple species, including in post-mortem human tissue, have shown that normal aging and/or acoustic overexposure can lead to a significant loss of afferent synapses innervating the cochlea. Hypothetically, this cochlear synaptopathy can lead to perceptual deficits in challenging environments and can contribute to central neural effects such as tinnitus. However, because cochlear synaptopathy can occur without any measurable changes in audiometric thresholds, synaptopathy can remain hidden from standard clinical diagnostics. To understand the perceptual sequelae of synaptopathy and to evaluate the efficacy of emerging therapies, sensitive and specific non-invasive measures at the individual patient level need to be established. Pioneering experiments in specific mice strains have helped identify many candidate assays. These include auditory brainstem responses, the middle-ear muscle reflex, envelope-following responses, and extended high-frequency audiograms. Unfortunately, because these non-invasive measures can be also affected by extraneous factors other than synaptopathy, their application and interpretation in humans is not straightforward. Here, we systematically examine six extraneous factors through a series of interrelated human experiments aimed at understanding their effects. Using strategies that may help mitigate the effects of such extraneous factors, we then show that these suprathreshold physiological assays exhibit across-individual correlations with each other indicative of contributions from a common physiological source consistent with cochlear synaptopathy. Finally, we discuss the application of these assays to two key outstanding questions, and discuss some barriers that still remain. This article is part of a Special Issue entitled: Hearing Loss, Tinnitus, Hyperacusis, Central Gain.

Keywords: auditory brainstem response; cochlear synaptopathy; envelope-following response; hidden-hearing loss; individual differences; middle-ear muscle reflex.


Figures

Figure 1:
Figure 1:. Relationship between ABR wave I amplitudes and extended-high-frequency audiometric thresholds (averaged over 10 – 16 kHz) for 136 ears with clinically normal thresholds (better than 25 dB HL) up to 8 kHz.
Greater thresholds in the 9–16 kHz range are associated with smaller wave I amplitudes. Moreover, a lower-triangular pattern of scatter is evident, i.e., there are many ears with small wave I amplitudes despite good 10–16 kHz thresholds, but very few data point with the opposite trend. These results are consistent with the interpretation that when there is OHC damage in the far basal parts of the cochlea, broader cochlear synaptopathy is also present. An alternate interpretation is that the 9–16 kHz region of the cochlea is a prominent contributor to the wave I.
Figure 2.
Figure 2.. Voltage to forward-pressure-level (FPL) transfer functions obtained from three different ears using the ER-10X OAE probe for typical probe insertion depths.
Considerable variability is seen in the FPL levels for a constant voltage input across ears at higher frequencies. This suggests that when conventional calibration techniques are employed, individual differences in ear-canal filtering could contribute to variability in the stimulus driving the middle-ear for insert probes.
Figure 3.
Figure 3.. OAE and ABR data illustrating the dispersive mechanics of cochlear excitation.
Panel A shows click-evoked OAE group delays for frequencies around 2 kHz (corresponding to roughly the middle of the cochlear spiral). Consistent with larger ABR amplitudes seen in female subjects, OAE group delays are shorter indicating that the dispersive effects of the cochlear traveling wave are less pronounced in female ears. Individual differences in such cochlear dispersion can contribute to variability in ABR amplitudes. Panel B show ABR wave I to wave V amplitude ratios obtained for broadband (BB) and high-pass (HP) click of approximately the same sensation level. For BB clicks, the wave V is larger consistent with a greater contribution of low-frequency portions of the cochlea to wave V compared to wave I. In contrast, with HP clicks, the relationship is reversed (as with tone-pip data in animal models). These observations suggest that when considering amplitude ratios, it is important to account for differences between the cochlear regions recruited by wave I and wave V.
Figure 4.
Figure 4.. Comparison of MEG and EEG versions of EFR measures.
Panel A (left) shows the response phase vs. frequency functions for EFRs obtained from MEG and EEG for a representative subject. The differences in slope near 100 Hz, and the similar slopes beyond 200 Hz are evident. The group delays extracted from the phase for three MEG subjects are shown along with EEG group delays estimated from 10 subjects (Panel A, right). For the 100 Hz EFR, MEG group delay is more than twice as long as EEG suggesting that MEG and EEG versions of EFR can only be compared for modulation frequencies beyond 200 Hz or so. Panel B shows the EFR response at 223 Hz for two types of MEG sensors. The gradiometers which are insensitive to farther sources do not show a response, whereas magnetometers do. This is consistent with a subcortical source dominating the MEG response for this modulation frequency.
Figure 5.
Figure 5.. Data illustrating the spectral profile variability of the MEMR.
Panel A shows the MEMR elicited by a 76 dB FPL broadband noise for an individual. The MEMR was measured using either a click probe, i.e., a wideband (WB) measurement, or using tone probes in interleaved trials. The coincidence of the WB spectrum with the individual data points from different tone probes confirms the linearity of acoustic measurement and suggests that a WB measurement is much more efficient. Panel B shows the MEMR spectra obtained for two different subjects (left and right) for a series of broadband noise elicitors at different forward-pressure levels. Both subjects show an increasing MEMR response as the elicitor level is increased. However, the spectral shapes are different; the individual in the left panel shows small changes near 226 Hz although a large response at other frequencies. In contrast the individual shown on the right has small responses overall, but shows larger changes near 226 Hz. Thus, if the MEMR were to be measured only at one frequency (say 226 Hz), the ordering of who has a larger response would be swapped.
Figure 6.
Figure 6.. Across-individual correlations between the ABR (wave I/V ratio), EFR (change with modulation depth) and the MEMR (wideband average).
Note that the eliciting stimulus for all three measures was restricted to the 3–8 kHz band, the region where “noise notches” often appear in human audiograms. Panel A shows the relationship between the ABR and the EFR for 30 ears with normal audiometric thresholds up to 8 kHz. A steeper EFR reduction with drop in modulation depth is associated with a smaller wave I/wave V ratio. Panel B shows the relationship between the ABR wave I/V ratio and MEMR measures from 69 ears with normal audiometric thresholds up to 8 kHz. In panel B, in order to show the association between the ABR and entire MEMR growth function, subjects were split into three groups based on their ABR wave I amplitudes (rather than show individual data points, which complicated visualizing the growth function). The median MEMR curve is shown for each group with error bars showing the.standard-error of the mean. Larger wave I/V ratios are associated with lower MEMR thresholds, and larger suprathreshold MEMR amplitudes. These observations are consistent with cochlear synaptopathy being a common source of individual differences in these measures.
Figure 7.
Figure 7.. A schematic illustration of the challenges in establishing the prevalence and perceptual consequences of cochlear synaptopathy in humans.
There are many sources of variability (illustrated in red boxes) in estimating both individual risk for synaptopathy and in the outcome measures available. For physiological assays, many of the factors illustrated in this manuscript can contribute to variability (solid red box). For perceptual outcome measures, still more factors could obscure the relationship between synaptopathy and perception (dashed red boxes). These sources of variability present a significant challenge for future studies in humans.

References

    1. Ahlfors SP, Han J, Belliveau JW, and Hämäläinen MS (2010). Sensitivity of meg and eeg to source orientation. Brain Topogr, 23(3):227–232. - PMC - PubMed
    1. Badri R, Siegel J, and Wright B (2011). Auditory filter shapes and high-frequency hearing in adults who have impaired speech in noise performance despite clinically normal audiograms. J Acoust Soc Am, 129(2):852–863. - PMC - PubMed
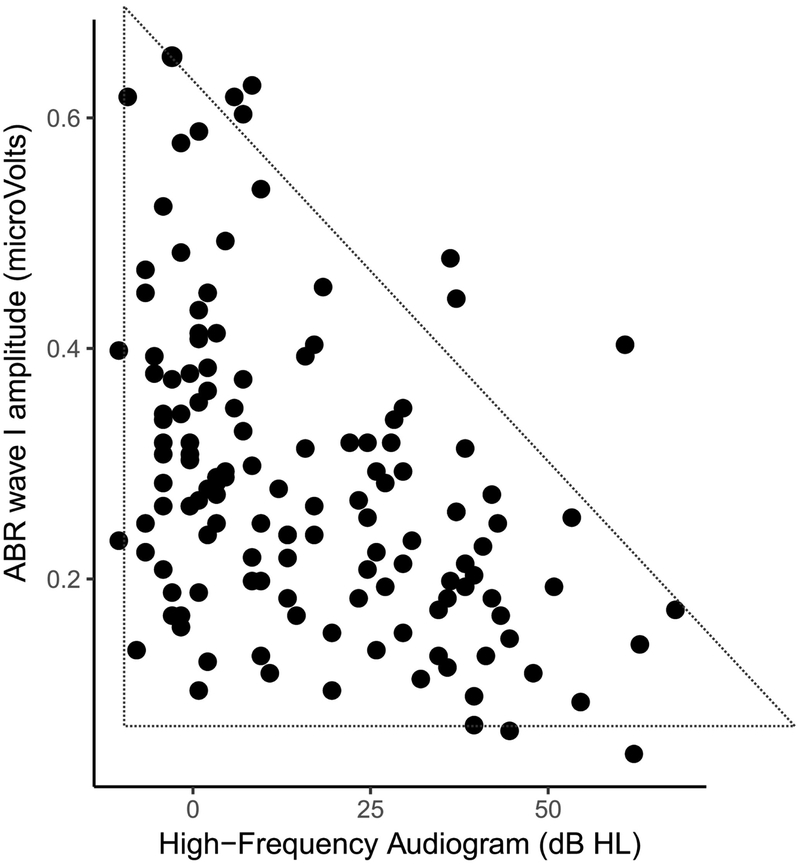
    1. Bardsley W, Jorgensen M, Alpert P, and Ben-Gai T (1999). A significance test for empty corners in scatter diagrams. J Hydrol, 219(1–2):1–6.
    1. Bharadwaj HM, Masud S, Mehraei G, Verhulst S, and Shinn-Cunningham BG (2015). Individual differences reveal correlates of hidden hearing deficits. J Neurosci, 35(5):2161–2172. - PMC - PubMed
    1. Bharadwaj HM and Shinn-Cunningham BG (2014). Rapid acquisition of auditory subcortical steady-state responses using multichannel recordings. Clin Neurophysiol, 125(9):1878–1888. - PMC - PubMed

Publication types

MeSH terms