Development of a Post-vitrectomy Injection of N-methyl-N-nitrosourea as a Localized Retinal Degeneration Rabbit Model
- PMID: 30853825
- PMCID: PMC6401555
- DOI: 10.5607/en.2019.28.1.62
Development of a Post-vitrectomy Injection of N-methyl-N-nitrosourea as a Localized Retinal Degeneration Rabbit Model
Abstract
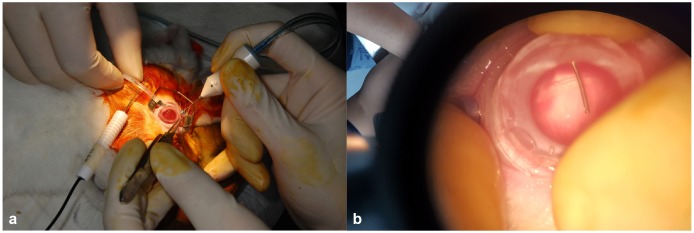
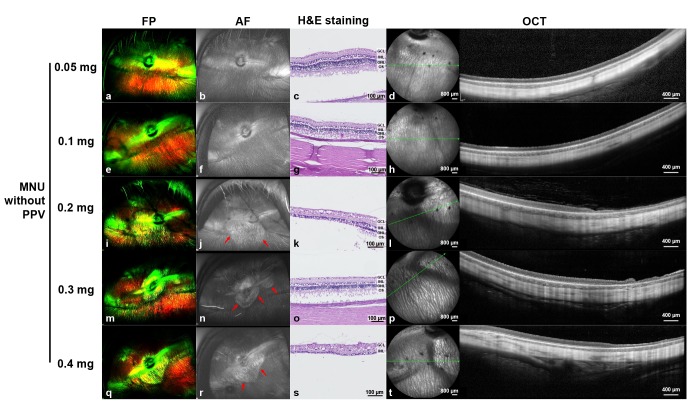
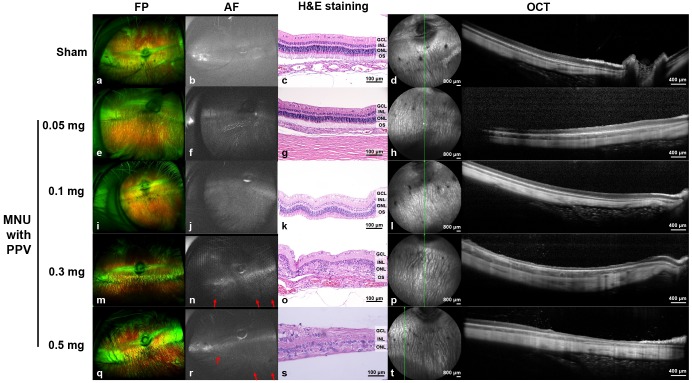
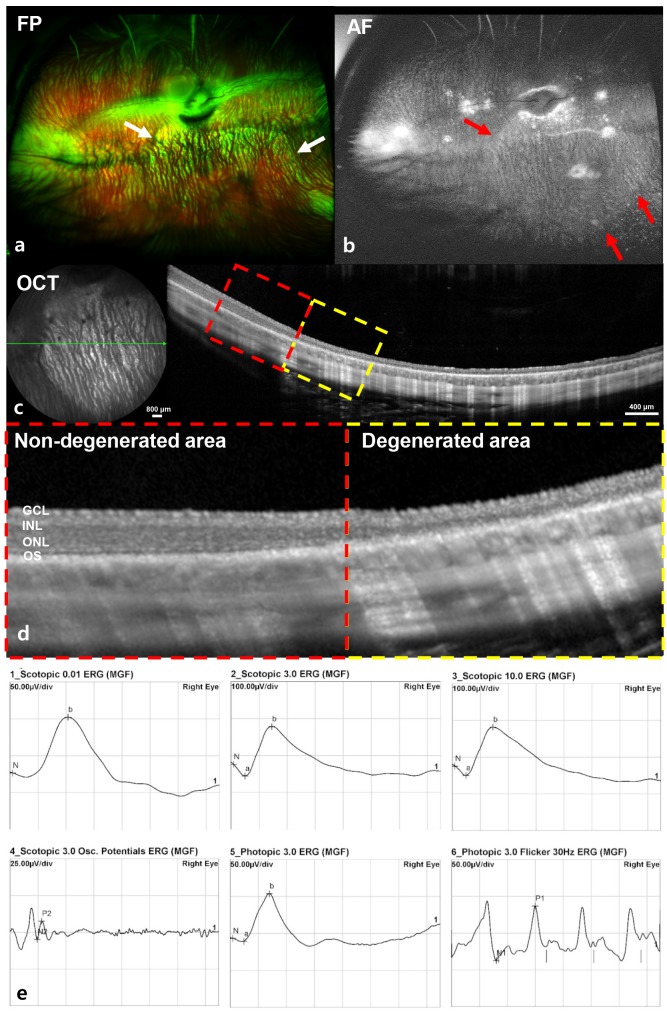
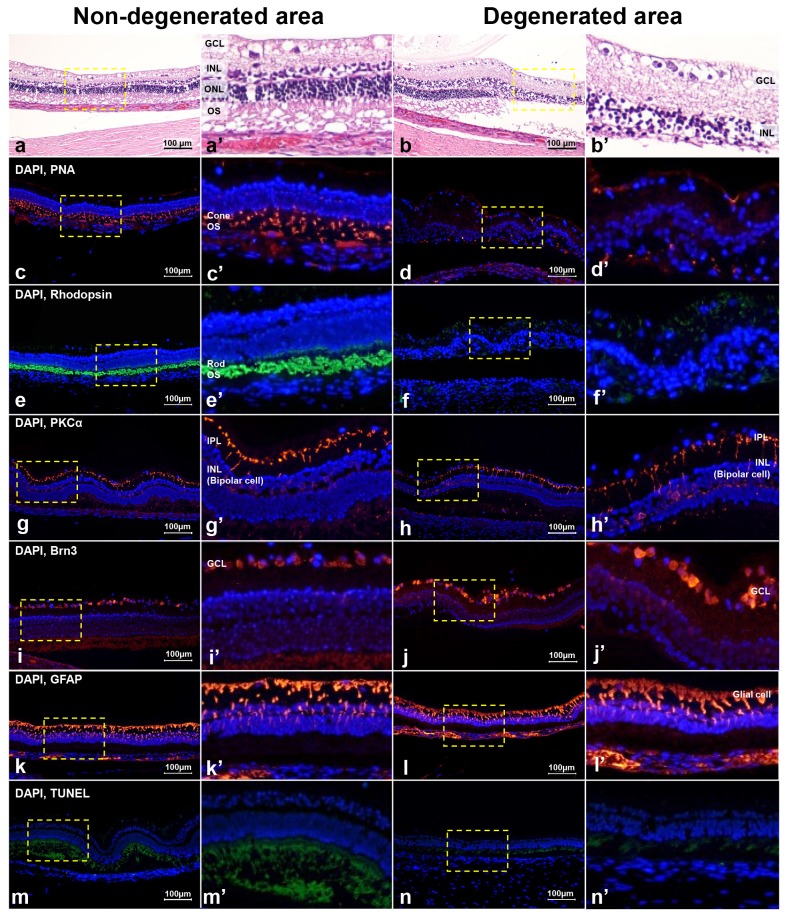
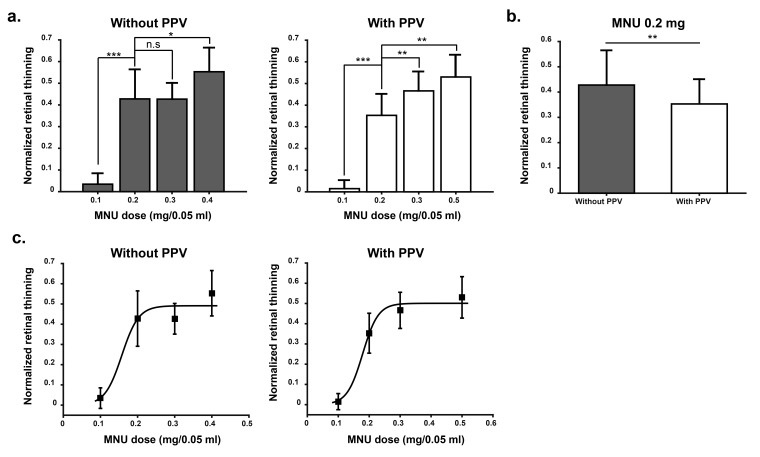
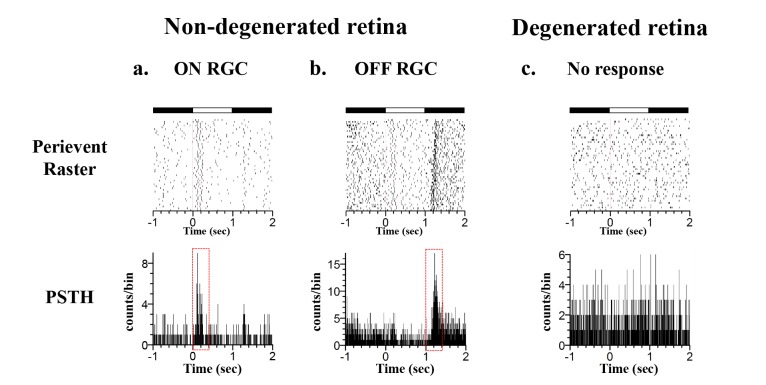
Since genetic models for retinal degeneration (RD) in animals larger than rodents have not been firmly established to date, we sought in the present study to develop a new rabbit model of drug-induced RD. First, intravitreal injection of N-methyl-N-nitrosourea (MNU) without vitrectomy in rabbits was performed with different doses. One month after injection, morphological changes in the retinas were identified with ultra-wide-field color fundus photography (FP) and fundus autofluorescence (AF) imaging as well as spectral-domain optical coherence tomography (OCT). Notably, the degree of RD was not consistently correlated with MNU dose. Then, to check the effects of vitrectomy on MNU-induced RD, the intravitreal injection of MNU after vitrectomy in rabbits was also performed with different doses. In OCT, while there were no significant changes in the retinas for injections up to 0.1 mg (i.e., sham, 0.05 mg, and 0.1 mg), outer retinal atrophy and retinal atrophy of the whole layer were observed with MNU injections of 0.3 mg and 0.5 mg, respectively. With this outcome, 0.2 mg MNU was chosen to be injected into rabbit eyes (n=10) at two weeks after vitrectomy for further study. Six weeks after injection, morphological identification with FP, AF, OCT, and histology clearly showed localized outer RD - clearly bordered non-degenerated and degenerated outer retinal area - in all rabbits. We suggest our post-vitrectomy MNU-induced RD rabbit model could be used as an interim animal model for visual prosthetics before the transition to larger animal models.
Keywords: Animal model; Intravitreal injection; N-methyl-N-nitrosourea; Optical coherence tomography; Retinal degeneration; Vitrectomy.
Figures
Similar articles
-
An experimental pig model with outer retinal degeneration induced by temporary intravitreal loading of N-methyl-N-nitrosourea during vitrectomy.Sci Rep. 2021 Jan 8;11(1):258. doi: 10.1038/s41598-020-79437-1. Sci Rep. 2021. PMID: 33420119 Free PMC article.
-
The effects of intravitreal sodium iodate injection on retinal degeneration following vitrectomy in rabbits.Sci Rep. 2019 Oct 30;9(1):15696. doi: 10.1038/s41598-019-52172-y. Sci Rep. 2019. PMID: 31666618 Free PMC article.
-
Photoreceptor degeneration by intravitreal injection of N-methyl-N-nitrosourea (MNU) in rabbits: a pilot study.Graefes Arch Clin Exp Ophthalmol. 2017 Feb;255(2):317-331. doi: 10.1007/s00417-016-3531-7. Epub 2016 Nov 19. Graefes Arch Clin Exp Ophthalmol. 2017. PMID: 27866331
-
Outer retinal degeneration in a non-human primate model using temporary intravitreal tamponade with N-methyl-N-nitrosourea in cynomolgus monkeys.J Neural Eng. 2023 Jan 20;20(1). doi: 10.1088/1741-2552/acb085. J Neural Eng. 2023. PMID: 36603218
-
[Characteristics of N-methyl-N-nitrosourea-induced retinal degeneration in animals and application for the therapy of human retinitis pigmentosa].Nippon Ganka Gakkai Zasshi. 2005 Jun;109(6):327-37. Nippon Ganka Gakkai Zasshi. 2005. PMID: 16047940 Review. Japanese.
Cited by
-
Morphologic and electrophysiologic findings of retinal degeneration after intravitreal sodium iodate injection following vitrectomy in canines.Sci Rep. 2020 Feb 27;10(1):3588. doi: 10.1038/s41598-020-60579-1. Sci Rep. 2020. PMID: 32107442 Free PMC article.
-
Electrical response of retinal ganglion cells in an N-methyl-N-nitrosourea-induced retinal degeneration porcine model.Sci Rep. 2021 Dec 17;11(1):24135. doi: 10.1038/s41598-021-03439-w. Sci Rep. 2021. PMID: 34921172 Free PMC article.
-
An experimental pig model with outer retinal degeneration induced by temporary intravitreal loading of N-methyl-N-nitrosourea during vitrectomy.Sci Rep. 2021 Jan 8;11(1):258. doi: 10.1038/s41598-020-79437-1. Sci Rep. 2021. PMID: 33420119 Free PMC article.
-
The effects of intravitreal sodium iodate injection on retinal degeneration following vitrectomy in rabbits.Sci Rep. 2019 Oct 30;9(1):15696. doi: 10.1038/s41598-019-52172-y. Sci Rep. 2019. PMID: 31666618 Free PMC article.
-
A novel approach for 25-gauge transconjunctival sutureless vitrectomy to evaluate vitreous substitutes in rabbits.Int J Ophthalmol. 2023 Oct 18;16(10):1568-1573. doi: 10.18240/ijo.2023.10.02. eCollection 2023. Int J Ophthalmol. 2023. PMID: 37854378 Free PMC article.
References
-
- da Cruz L, Coley BF, Dorn J, Merlini F, Filley E, Christopher P, Chen FK, Wuyyuru V, Sahel J, Stanga P, Humayun M, Greenberg RJ, Dagnelie G, Argus II Argus II Study Group. The Argus II epiretinal prosthesis system allows letter and word reading and long-term function in patients with profound vision loss. Br J Ophthalmol. 2013;97:632–636. - PMC - PubMed
-
- Humayun MS, Weiland JD, Fujii GY, Greenberg R, Williamson R, Little J, Mech B, Cimmarusti V, Van Boemel G, Dagnelie G, de Juan E., Jr Visual perception in a blind subject with a chronic microelectronic retinal prosthesis. Vision Res. 2003;43:2573–2581. - PubMed
-
- MacLaren RE, Pearson RA, MacNeil A, Douglas RH, Salt TE, Akimoto M, Swaroop A, Sowden JC, Ali RR. Retinal repair by transplantation of photoreceptor precursors. Nature. 2006;444:203–207. - PubMed
LinkOut - more resources
Full Text Sources
Miscellaneous