

Default Mode Network Structural Integrity and Cerebellar Connectivity Predict Information Processing Speed Deficit in Multiple Sclerosis
- PMID: 30853896
- PMCID: PMC6396736
- DOI: 10.3389/fncel.2019.00021
Default Mode Network Structural Integrity and Cerebellar Connectivity Predict Information Processing Speed Deficit in Multiple Sclerosis
Abstract
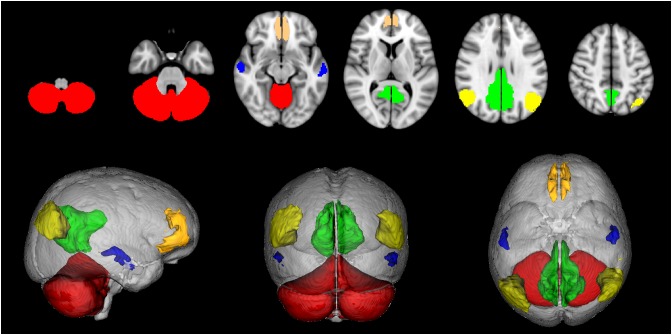
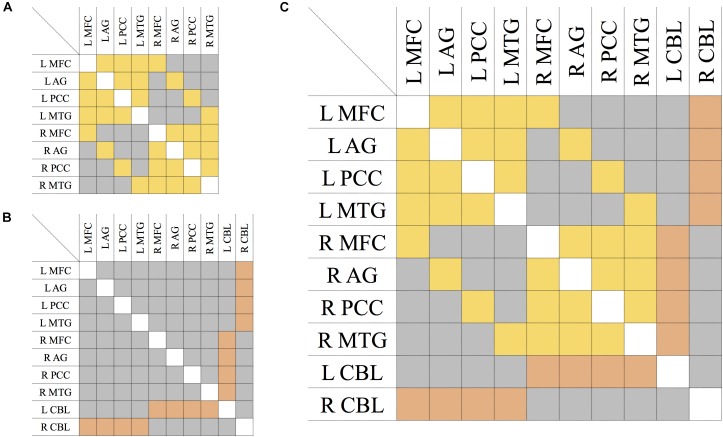
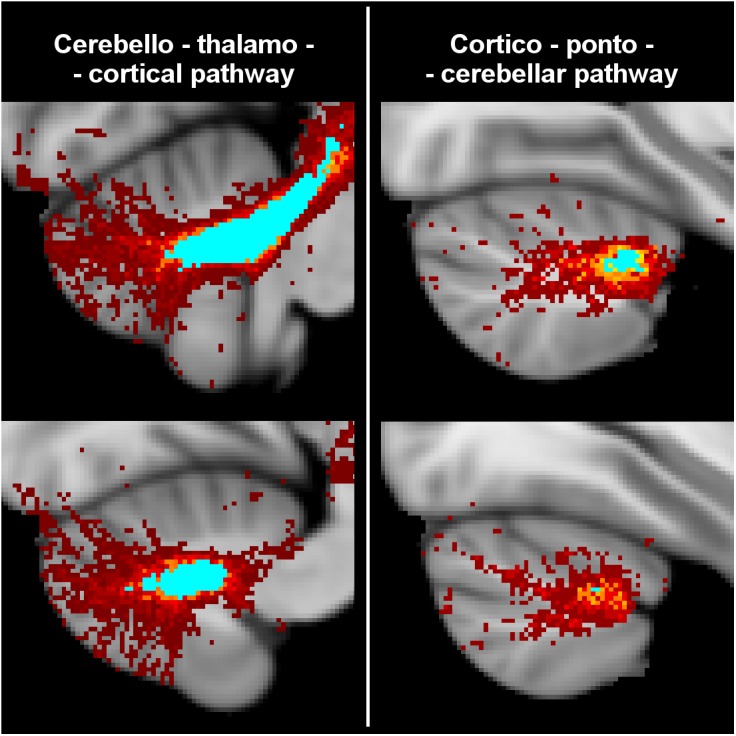
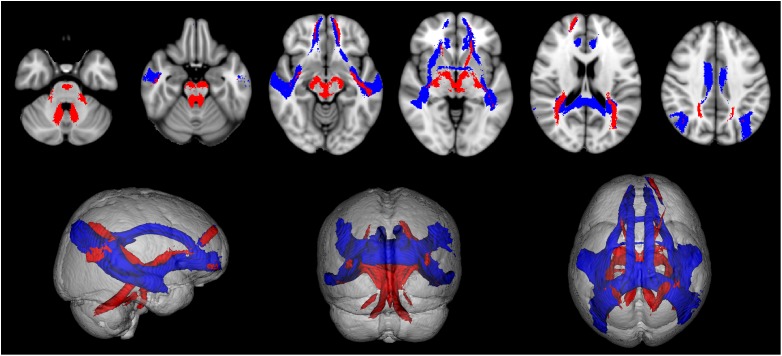
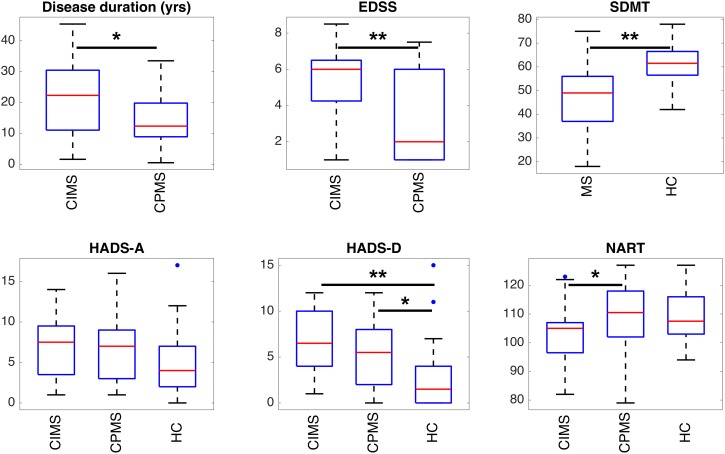
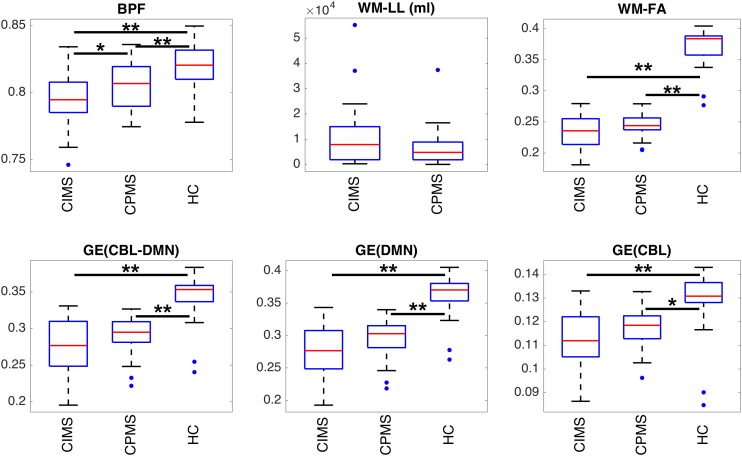
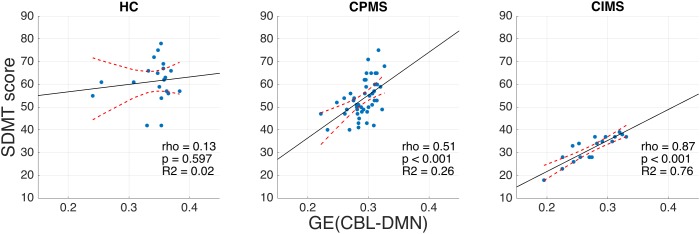
Cognitive impairment affects about 50% of multiple sclerosis (MS) patients, but the mechanisms underlying this remain unclear. The default mode network (DMN) has been linked with cognition, but in MS its role is still poorly understood. Moreover, within an extended DMN network including the cerebellum (CBL-DMN), the contribution of cortico-cerebellar connectivity to MS cognitive performance remains unexplored. The present study investigated associations of DMN and CBL-DMN structural connectivity with cognitive processing speed in MS, in both cognitively impaired (CIMS) and cognitively preserved (CPMS) MS patients. 68 MS patients and 22 healthy controls (HCs) completed a symbol digit modalities test (SDMT) and had 3T brain magnetic resonance imaging (MRI) scans that included a diffusion weighted imaging protocol. DMN and CBL-DMN tracts were reconstructed with probabilistic tractography. These networks (DMN and CBL-DMN) and the cortico-cerebellar tracts alone were modeled using a graph theoretical approach with fractional anisotropy (FA) as the weighting factor. Brain parenchymal fraction (BPF) was also calculated. In CIMS SDMT scores strongly correlated with the FA-weighted global efficiency (GE) of the network [GE(CBL-DMN): ρ = 0.87, R 2 = 0.76, p < 0.001; GE(DMN): ρ = 0.82, R 2 = 0.67, p < 0.001; GE(CBL): ρ = 0.80, R 2 = 0.64, p < 0.001]. In CPMS the correlation between these measures was significantly lower [GE(CBL-DMN): ρ = 0.51, R 2 = 0.26, p < 0.001; GE(DMN): ρ = 0.48, R 2 = 0.23, p = 0.001; GE(CBL): ρ = 0.52, R 2 = 0.27, p < 0.001] and SDMT scores correlated most with BPF (ρ = 0.57, R 2 = 0.33, p < 0.001). In a multivariable regression model where SDMT was the independent variable, FA-weighted GE was the only significant explanatory variable in CIMS, while in CPMS BPF and expanded disability status scale were significant. No significant correlation was found in HC between SDMT scores, MRI or network measures. DMN structural GE is related to cognitive performance in MS, and results of CBL-DMN suggest that the cerebellum structural connectivity to the DMN plays an important role in information processing speed decline.
Keywords: cerebellum; connectomics; default mode network (DMN); diffusion weighted imaging (DWI); magnetic resonance imaging (MRI); multiple sclerosis (MS); symbol digit modalities test (SDMT); tractography.
Figures
Similar articles
-
An investigation of the association between focal damage and global network properties in cognitively impaired and cognitively preserved patients with multiple sclerosis.Front Neurosci. 2023 Feb 7;17:1007580. doi: 10.3389/fnins.2023.1007580. eCollection 2023. Front Neurosci. 2023. PMID: 36824214 Free PMC article.
-
Reduced default mode network connectivity relative to white matter integrity is associated with poor cognitive outcomes in patients with idiopathic normal pressure hydrocephalus.BMC Neurol. 2021 Sep 13;21(1):353. doi: 10.1186/s12883-021-02389-0. BMC Neurol. 2021. PMID: 34517828 Free PMC article.
-
Information processing speed in multiple sclerosis: Relevance of default mode network dynamics.Neuroimage Clin. 2018 May 15;19:507-515. doi: 10.1016/j.nicl.2018.05.015. eCollection 2018. Neuroimage Clin. 2018. PMID: 29984159 Free PMC article.
-
The structural and functional connectivity of the posterior cingulate cortex: comparison between deterministic and probabilistic tractography for the investigation of structure-function relationships.Neuroimage. 2014 Nov 15;102 Pt 1:118-27. doi: 10.1016/j.neuroimage.2013.12.022. Epub 2013 Dec 21. Neuroimage. 2014. PMID: 24365673 Review.
-
Microstructure-Weighted Connectomics in Multiple Sclerosis.Brain Connect. 2022 Feb;12(1):6-17. doi: 10.1089/brain.2021.0047. Epub 2021 Sep 8. Brain Connect. 2022. PMID: 34210167 Free PMC article. Review.
Cited by
-
Innovative biomarker exploration in ASD: Combining Graph Neural Networks and permutation testing on fMRI data.Neuroimage Rep. 2025 Mar 26;5(2):100249. doi: 10.1016/j.ynirp.2025.100249. eCollection 2025 Jun. Neuroimage Rep. 2025. PMID: 40567447 Free PMC article.
-
Elucidating the complementarity of resting-state networks derived from dynamic [18F]FDG and hemodynamic fluctuations using simultaneous small-animal PET/MRI.Neuroimage. 2021 Aug 1;236:118045. doi: 10.1016/j.neuroimage.2021.118045. Epub 2021 Apr 10. Neuroimage. 2021. PMID: 33848625 Free PMC article.
-
Theta burst stimulation on the fronto-cerebellar connective network promotes cognitive processing speed in the simple cognitive task.Front Hum Neurosci. 2024 Jul 19;18:1387299. doi: 10.3389/fnhum.2024.1387299. eCollection 2024. Front Hum Neurosci. 2024. PMID: 39314267 Free PMC article.
-
Depressive symptoms, anxiety and cognitive impairment: emerging evidence in multiple sclerosis.Transl Psychiatry. 2023 Jul 19;13(1):264. doi: 10.1038/s41398-023-02555-7. Transl Psychiatry. 2023. PMID: 37468462 Free PMC article. Review.
-
Neurochemical and functional reorganization of the cognitive-ear link underlies cognitive impairment in presbycusis.Neuroimage. 2023 Mar;268:119861. doi: 10.1016/j.neuroimage.2023.119861. Epub 2023 Jan 5. Neuroimage. 2023. PMID: 36610677 Free PMC article.
References
-
- Barabási A.-L. (2016). Network science. Cambridge: Cambridge University Press.
-
- Bonavita S., Sacco R., Della Corte M., Esposito S., Sparaco M., D’Ambrosio A., et al. (2015). Computer-aided cognitive rehabilitation improves cognitive performances and induces brain functional connectivity changes in relapsing remitting multiple sclerosis patients: an exploratory study. J. Neurol. 262 91–100. 10.1007/s00415-014-7528-z - DOI - PubMed
LinkOut - more resources
Full Text Sources
Miscellaneous