. 2019 Jan 29;10(5):1077-1085.
doi: 10.7150/jca.29440. eCollection 2019.

Annexin A2 Silencing Inhibits Proliferation and Epithelial-to-mesenchymal Transition through p53-Dependent Pathway in NSCLCs

Affiliations

Annexin A2 Silencing Inhibits Proliferation and Epithelial-to-mesenchymal Transition through p53-Dependent Pathway in NSCLCs

Minhua Wu et al. J Cancer. .

Abstract

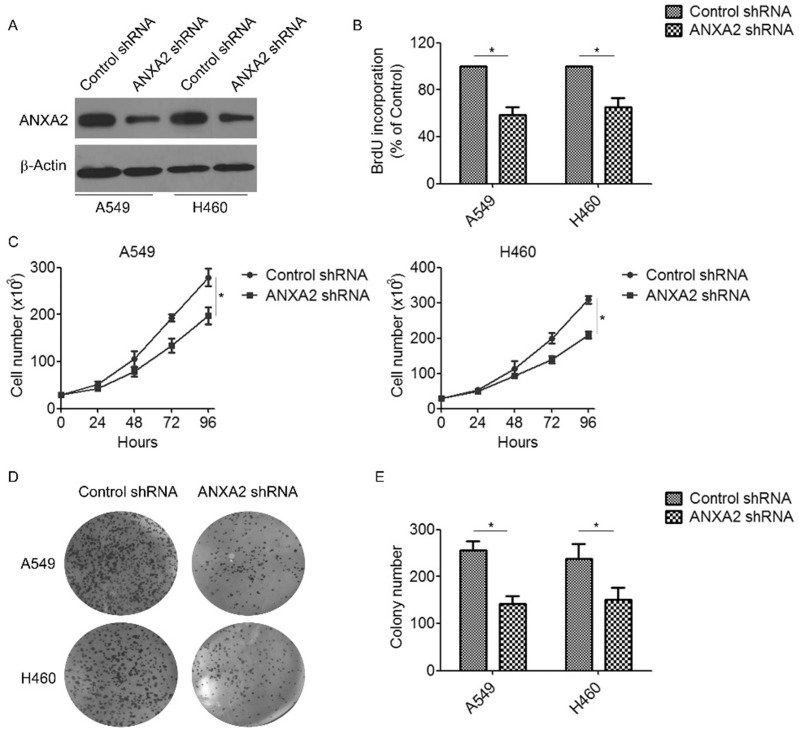
Annexin A2 has been involved in cancer cell adhesion, invasion and metastasis. However, the exact function and mechanism of Annexin A2 in tumor progression of NSCLCs have not been elucidated. In this study, we showed that Annexin A2 was evidently overexpressed in human NSCLCs cell lines and NSCLCs tissues. Clinicopathologic analysis showed that Annexin A2 expression was significantly correlated with clinical stage, and lymph node metastasis. Kaplan-Meier analysis revealed that patients with high Annexin A2 expression had poorer overall survival rates than those with low Annexin A2 expression. Moreover, we found that knockdown of Annexin A2 significantly suppressed cell proliferation and invasion of NSCLCs cells. Mechanistically, our studies showed that knockdown of Annexin A2 increased the expression of p53, which in turn, induced cell cycle G2 arrest and inhibited epithelial-to-mesenchymal transition (EMT). Taken together, these data suggest that Annexin A2 plays an important role in NSCLCs progression, which could serve as a potential prognosis marker and a novel therapeutic target for NSCLCs.

Keywords: Annexin A2; NSCLCs; cell proliferation; epithelial-to-mesenchymal transition; p53.


Conflict of interest statement

Competing Interests: The authors have declared that no competing interest exists.

Figures

Figure 1
Figure 1
Annexin A2 is overexpressed and associated with poor prognosis in human NSCLCs. (A) Annexin A2 expression in Beas-2B, A549, H460, H1299 and H1975 cells was analyzed by Western blot. β-actin was employed as an inner control. (B) Representative immunohistochemical staining examples of Annexin A2 protein expression in adjacent normal tissues and NSCLCs tissues (100×, 400×). The NSCLCs tissue sections were quantitatively scored according to the percentage of positive cells and staining intensity as described in Materials and Methods. The percentage and intensity scores were multiplied to obtain a total score (range, 0-12), and the tumors were finally determined as negative (-), score 0; lower expression (+), score ≤4; moderate expression (++), score 5-8; and high expression (+++), score ≥9. (C) Annexin A2 protein scores in NSCLCs tissues and adjacent normal tissues. **p<0.01. (D) Kaplan-Meier OS curves of 71 NSCLCs patients relative to different expression levels of Annexin A2, p=0.0455.
Figure 2
Figure 2
Knockdown of Annexin A2 inhibits proliferation of NSCLCs cells. (A) A549 or H460 cells were transfected with Annexin A2 shRNA or control shRNA, Annexin A2 expression was analyzed by Western blot. β-actin was employed as an inner control. (B) A549 or H460 cells were transfected with Annexin A2 shRNA or control shRNA, cell proliferation was detected by BrdU incorporation assay. *p<0.05. (C) A549 or H460 cells were transfected with Annexin A2 shRNA or control shRNA, cell numbers were counted at indicated time by Coulter Counter. *p<0.05. (D-E) A549 or H460 cells were transfected with Annexin A2 shRNA or control shRNA. After 14 days, the cells were fixed in methanol and stained with crystal violet. Colonies were photographed and counted. *p<0.05.
Figure 3
Figure 3
Knockdown of Annexin A2 induces G2 arrest in NSCLCs cells. (A) A549 or H460 cells were transfected with Annexin A2 shRNA or control shRNA, the cell cycle stages were determined using PI staining followed by flow cytometry 3 days post-transfection. One representative data set is shown. (B) Distribution of cells in different phases of the cell cycle is shown from three individual experiments. *p<0.05. (C) A549 or H460 cells were transfected with Annexin A2 shRNA or control shRNA, expression of p21, p27, Cyclin B1, CDK1 and CDK2 was analyzed by Western blot. β-actin was employed as an inner control. (D) Bands of Western blot were analyzed by ImageJ software. Results were obtained from the ratio of target band to β-actin. *p<0.05.
Figure 4
Figure 4
Knockdown of Annexin A2 suppresses invasion and migration of NSCLCs cells. (A-B) A549 or H460 cells were transfected with Annexin A2 shRNA or control shRNA, cell migration ability was measured by Transwell assay. **p<0.01. (C) H460 cells were transfected with Annexin A2 shRNA or control shRNA, cell migration ability was measured by wound healing scratch assay. (D) A549 or H460 cells were transfected with Annexin A2 shRNA or control shRNA, expression of Vimentin, E-cadherin, N-cadherin, Zeb1, Snail and Slug was analyzed by Western blot. β-actin was employed as an inner control. (E) Bands of Western blot were analyzed by ImageJ software. Results were obtained from the ratio of target band to β-actin. *p<0.05.
Figure 5
Figure 5
Knockdown of Annexin A2 induces cell cycle G2 arrest and suppresses EMT via inhibition of p53. (A) A549 or H460 cells were transfected with Annexin A2 shRNA or control shRNA, p53 expression was analyzed by Western blot. β-actin was employed as an inner control. (B) Bands of Western blot were analyzed by ImageJ software. Results were obtained from the ratio of target band to β-actin. *p<0.05. (C) A549 cells were transfected with control shRNA, Annexin A2 shRNA or Annexin A2 shRNA and p53 siRNA, expression of p53, p27, E-cadherin, N-cadherin and Snail was analyzed by Western blot. β-actin was employed as an inner control. (D) Bands of Western blot were analyzed by ImageJ software. Results were obtained from the ratio of target band to β-actin. *p<0.05. (E) A549 cells were transfected with control shRNA, Annexin A2 shRNA or Annexin A2 shRNA and p53 siRNA, the cell cycle stages were determined using PI staining followed by flow cytometry 3 days post-transfection. One representative data set is shown. (F) Distribution of cells in different phases of the cell cycle is shown from three individual experiments. *p<0.05. (G-H) A549 cells were transfected with control shRNA, Annexin A2 shRNA or Annexin A2 shRNA and p53 siRNA, cell migration ability was measured by Transwell assay. **p<0.01.

References

    1. Siegel RL, Miller KD, Jemal A. Cancer Statistics, 2017. CA Cancer J Clin. 2017;67:7–30. - PubMed
    1. Brambilla E, Travis WD, Colby TV. et al. The new World Health Organization classification of lung tumours. Eur Respir J. 2001;18:1059–68. - PubMed
    1. Wang T, Nelson RA, Bogardus A. et al. Five-year lung cancer survival: which advanced stage nonsmall cell lung cancer patients attain long-term survival? Cancer. 2010;116:1518–25. - PubMed
    1. Gerke V, Creutz CE, Moss SE. Annexins: linking Ca2+ signalling to membrane dynamics. Nat Rev Mol Cell Biol. 2005;6:449–61. - PubMed
    1. Gerke V, Moss SE. Annexins: from structure to function. Physiol Rev. 2002;82:331–71. - PubMed