

Inferences about spatiotemporal variation in dengue virus transmission are sensitive to assumptions about human mobility: a case study using geolocated tweets from Lahore, Pakistan
- PMID: 30854281
- PMCID: PMC6404370
- DOI: 10.1140/epjds/s13688-018-0144-x
Inferences about spatiotemporal variation in dengue virus transmission are sensitive to assumptions about human mobility: a case study using geolocated tweets from Lahore, Pakistan
Abstract
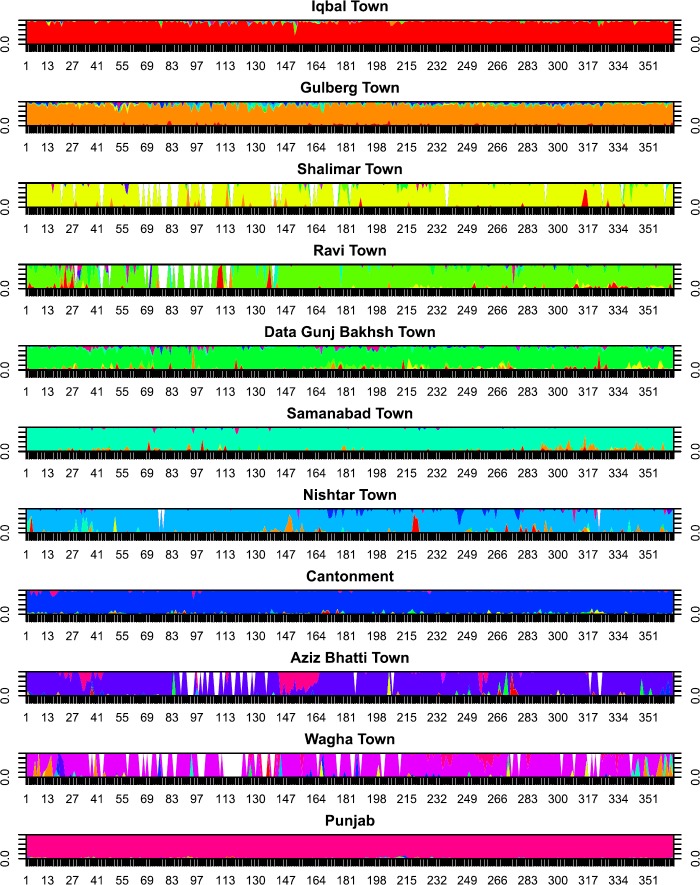
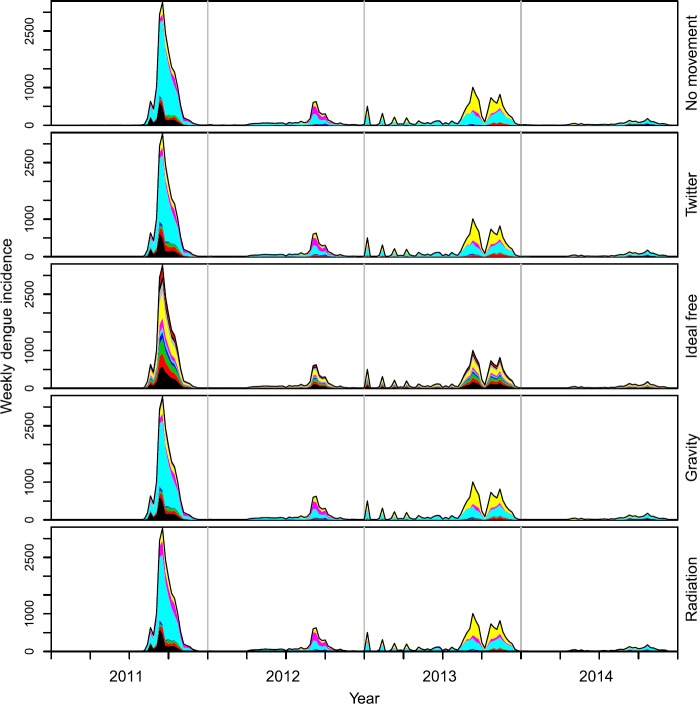
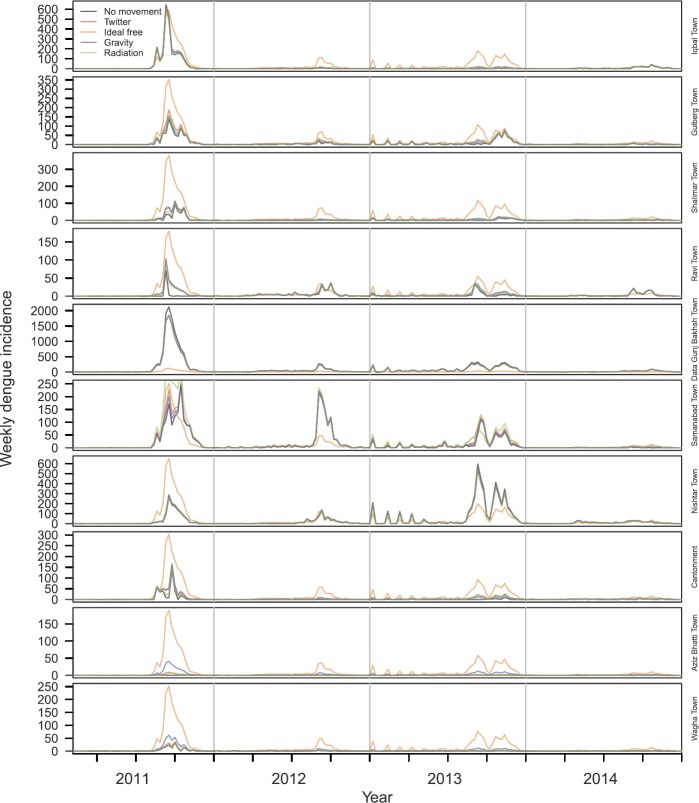
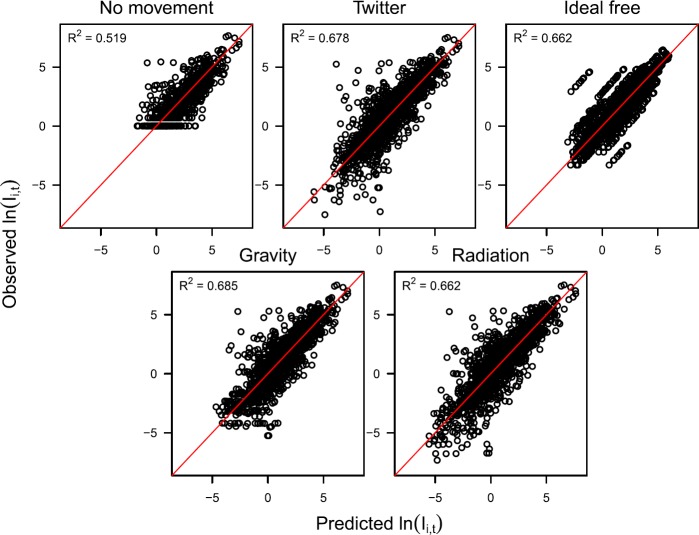
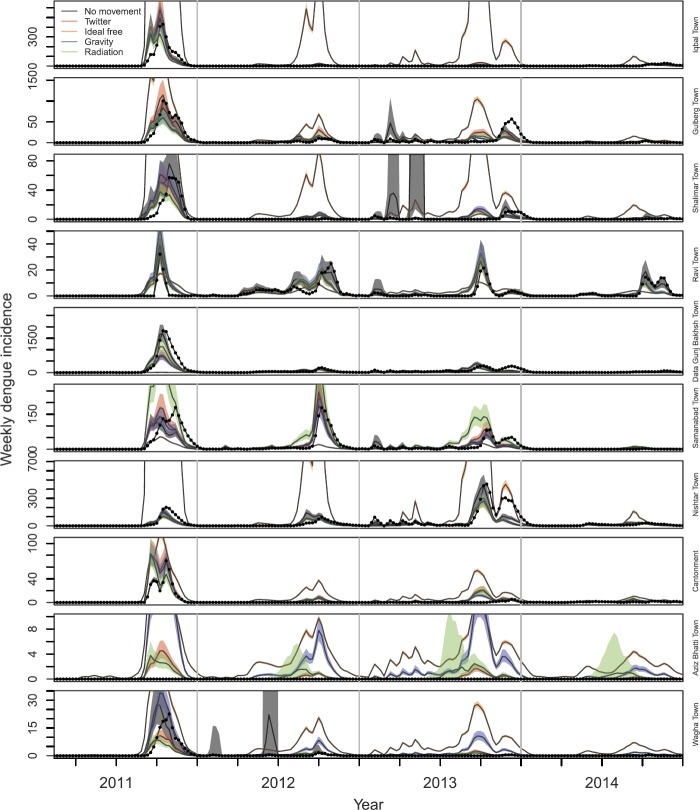
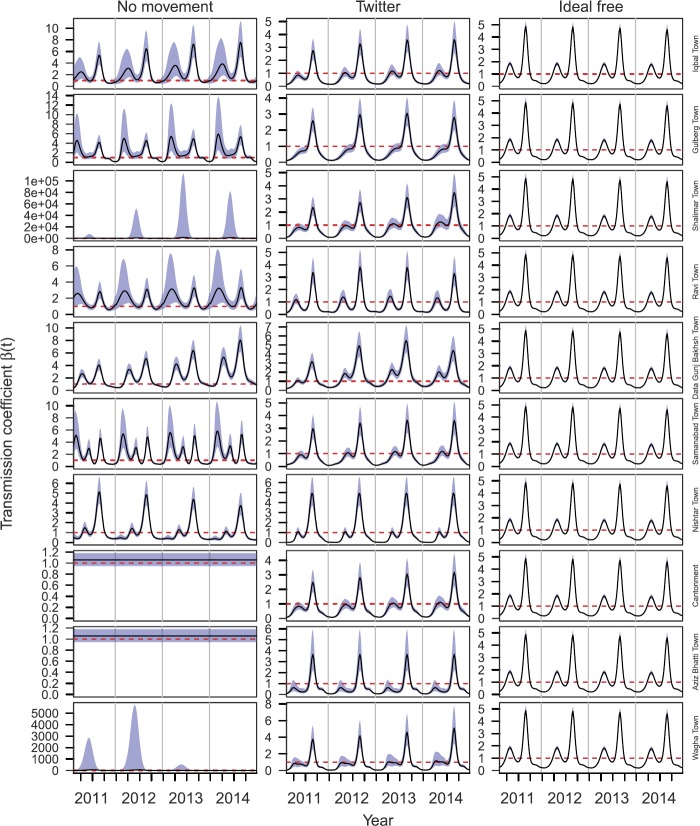
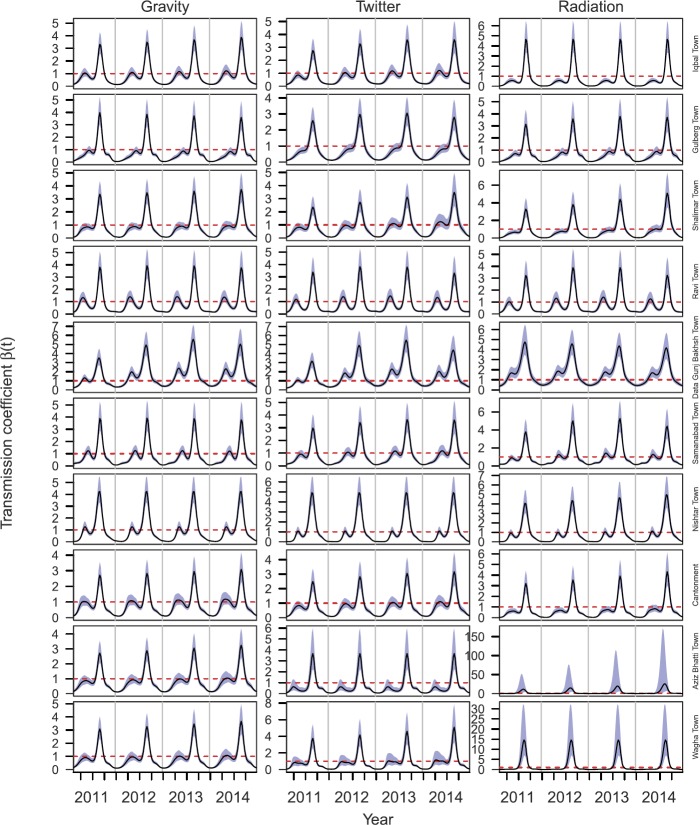
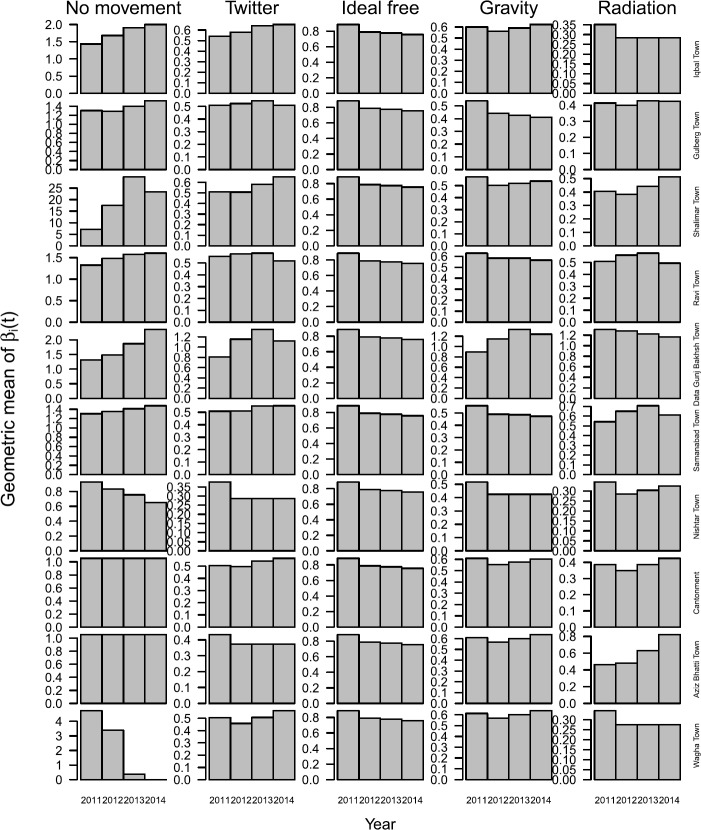
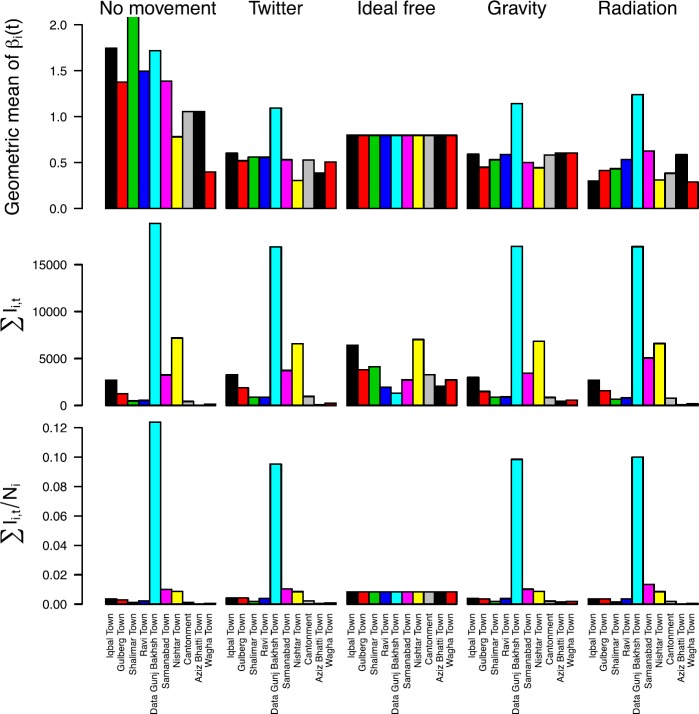
Billions of users of mobile phones, social media platforms, and other technologies generate an increasingly large volume of data that has the potential to be leveraged towards solving public health challenges. These and other big data resources tend to be most successful in epidemiological applications when utilized within an appropriate conceptual framework. Here, we demonstrate the importance of assumptions about host mobility in a framework for dynamic modeling of infectious disease spread among districts within a large urban area. Our analysis focused on spatial and temporal variation in the transmission of dengue virus (DENV) during a series of large seasonal epidemics in Lahore, Pakistan during 2011-2014. Similar to many directly transmitted diseases, DENV transmission occurs primarily where people spend time during daytime hours, given that DENV is transmitted by a day-biting mosquito. We inferred spatiotemporal variation in DENV transmission under five different assumptions about mobility patterns among ten districts of Lahore: no movement among districts, movement following patterns of geo-located tweets, movement proportional to district population size, and movement following the commonly used gravity and radiation models. Overall, we found that inferences about spatiotemporal variation in DENV transmission were highly sensitive to this range of assumptions about intra-urban human mobility patterns, although the three assumptions that allowed for a modest degree of intra-urban mobility all performed similarly in key respects. Differing inferences about transmission patterns based on our analysis are significant from an epidemiological perspective, as they have different implications for where control efforts should be targeted and whether conditions for transmission became more or less favorable over time.
Electronic supplementary material: The online version of this article (10.1140/epjds/s13688-018-0144-x) contains supplementary material.
Keywords: Big data; Disease dynamics; Geo-located tweets; Gravity model; Human mobility; Radiation model; Spatiotemporal analysis; Twitter data.
Conflict of interest statement
The authors declare no competing interests.
Figures
References
-
- Akram W, Hafeez F, Ullah UN, Kim YK, Hussain A, Lee JJ. Seasonal distribution and species composition of daytime biting mosquitoes. Entomol Res. 2009;39:107–113. doi: 10.1111/j.1748-5967.2009.00204.x. - DOI
-
- Alexander L, Jiang S, Murga M, González MC. Origin—destination trips by purpose and time of day inferred from mobile phone data. Transp Res, Part C, Emerg Technol. 2015;58:240–250. doi: 10.1016/j.trc.2015.02.018. - DOI
-
- Bassolas A, Lenormand M, Tugores A, Gonçalves B, Ramasco JJ. Touristic site attractiveness seen through Twitter. EPJ Data Sci. 2016;5:12. doi: 10.1140/epjds/s13688-016-0073-5. - DOI
-
- Beiró MG, Panisson A, Tizzoni M, Cattuto C. Predicting human mobility through the assimilation of social media traces into mobility models. EPJ Data Sci. 2016;5:30. doi: 10.1140/epjds/s13688-016-0092-2. - DOI
LinkOut - more resources
Full Text Sources