Review
. 2019 Feb 22:7:48.
doi: 10.3389/fchem.2019.00048. eCollection 2019.

Breakthrough Potential in Near-Infrared Spectroscopy: Spectra Simulation. A Review of Recent Developments

Affiliations
Review

Breakthrough Potential in Near-Infrared Spectroscopy: Spectra Simulation. A Review of Recent Developments

Krzysztof B Beć et al. Front Chem. .

Abstract

Near-infrared (12,500-4,000 cm-1; 800-2,500 nm) spectroscopy is the hallmark for one of the most rapidly advancing analytical techniques over the last few decades. Although it is mainly recognized as an analytical tool, near-infrared spectroscopy has also contributed significantly to physical chemistry, e.g., by delivering invaluable data on the anharmonic nature of molecular vibrations or peculiarities of intermolecular interactions. In all these contexts, a major barrier in the form of an intrinsic complexity of near-infrared spectra has been encountered. A large number of overlapping vibrational contributions influenced by anharmonic effects create complex patterns of spectral dependencies, in many cases hindering our comprehension of near-infrared spectra. Quantum mechanical calculations commonly serve as a major support to infrared and Raman studies; conversely, near-infrared spectroscopy has long been hindered in this regard due to practical limitations. Advances in anharmonic theories in hyphenation with ever-growing computer technology have enabled feasible theoretical near-infrared spectroscopy in recent times. Accordingly, a growing number of quantum mechanical investigations aimed at near-infrared region has been witnessed. The present review article summarizes these most recent accomplishments in the emerging field. Applications of generalized approaches, such as vibrational self-consistent field and vibrational second order perturbation theories as well as their derivatives, and dense grid-based studies of vibrational potential, are overviewed. Basic and applied studies are discussed, with special attention paid to the ones which aim at improving analytical spectroscopy. A remarkable potential arises from the growing applicability of anharmonic computations to solving the problems which arise in both basic and analytical near-infrared spectroscopy. This review highlights an increased value of quantum mechanical calculations to near-infrared spectroscopy in relation to other kinds of vibrational spectroscopy.

Keywords: NIRS; anharmonic methods; near-infrared; spectra simulation; theoretical spectroscopy.


Figures

Graphical Abstract
Graphical Abstract
The properties of near-infrared spectroscopy create unique synergy with quantum mechanical spectra simulations.
Figure 1
Figure 1
The spectrum of absorption coefficient of liquid water.
Figure 2
Figure 2
NIR spectra of diluted methanol; experimental (5 10−3 M CCl4) and simulated by the use of anharmonic calculations (GVPT2 scheme on DFT-B2PLYP/SNST level of electronic theory and CPCM solvation model of CCl4) (Beć et al., 2016a). Reproduced by permission of the PCCP Owner Societies.
Figure 3
Figure 3
Band assignments in the experimental and calculated NIR spectra of low concentration (5 10−3 M CCl4) ethanol. The calculated NIR spectrum is based on the CPCM-B2PLYP-D/SNST level of theory. Details of the 5,200–4,600 cm−1 region (Beć et al., 2016a). Reproduced by permission of the PCCP Owner Societies.
Figure 4
Figure 4
Experimental and simulated (harmonic: B2PLYP/def2-TZVP; VPT2: B3LYP/SNST; CPCM) NIR spectra of butyl alcohols; (A) 1-butanol; (B) 2-butanol; (C) iso-butanol; (D) tert-butyl alcohol. The contributions of the spectral lineshapes corresponding to conformational isomers presented as well (colored lines). Reprinted with permission from Grabska et al. (2017a). Copyright 2017 American Chemical Society.
Figure 5
Figure 5
Experimental (0.2 M; CCl4) and simulated (VPT2//B3LYP/SNST+CPCM) NIR spectra of (A) cyclohexanol and (B) phenol. Reprinted with permission from Elsevier (Beć et al., 2018a).
Figure 6
Figure 6
Experimental (solution; CCl4) and modeled spectrum of acetic acid. Band fitting results for the two combination bands involving OH stretching modes of acetic acid cyclic dimer. Reprinted with permission from Beć et al. (2016c). Copyright 2016 American Chemical Society.
Figure 7
Figure 7
Band assignments proposed for NIR spectra of MCFAs in medium to high concentration (CCl4); (A) hexanoic acid, (B) sorbic acid. Reprinted with permission from Elsevier (Grabska et al., 2017d).
Figure 8
Figure 8
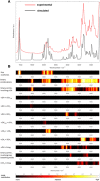
Simulated NIR spectra of CXXXOX (X = H, D) molecules. Reprinted with permission from Grabska et al. (2017b). Copyright 2017 American Chemical Society.
Figure 9
Figure 9
Convolution of NIR bands on the example of spectra simulation for vinylacetic acid. All bands are presented in common intensity, note an extensive band overlay. Reprinted with permission from Grabska et al. (2017c). Copyright 2017 American Chemical Society.
Figure 10
Figure 10
Vibrational potential and vibrational states [B3LYP/6-311G(d,p)] of the OH stretching mode of the main (equatorial-gauche) conformer of cyclohexanol. Reprinted with permission from Elsevier (Beć et al., 2018a).
Figure 11
Figure 11
Generalized contributions into NIR spectra of the selected types of modes involved in the binary combinations as uncovered by quantum mechanical spectra simulation of linoleic and palmitic acid. (Reprinted with permission from Grabska et al. (2018). Copyright (2018) American Chemical Society).
Figure 12
Figure 12
The experimental FT-NIR spectrum of aqueous malic acid in comparison with the PT2-VSCF derived line spectrum. Reprinted from Schmutzler et al. (2013). Reprinted with permission from Nova Science Publishers, Inc.].
Figure 13
Figure 13
The experimental (powder) and theoretical NIR spectrum of rosmarinic acid obtained in anharmonic GVPT2//DFT-B3LYP/N07D simulation (Kirchler et al., 2017b). Reproduced by permission of The Royal Society of Chemistry.
Figure 14
Figure 14
A set of the experimental NIR spectra of thymol; solid state and melted (neat liquid, 333 K) as well as diluted in CCl4 (100 and 10 mg mL−1 CCl4). Highlighted are the wavenumber regions qualitatively independent of sample phase and concentration; (A) 6,000–5,600 cm−1; (B) 4,490–4,000 cm−1 (Reprinted with permission from Beć et al., 2018b).
Figure 15
Figure 15
The analysis of mode contribution into NIR spectrum of thymol (solution; 100 mg mL−−1 CCl4) based on the simulated data (DVPT2//DFT-B3LYP/SNST+CPCM). (A) Experimental and simulated outlines. (B) Contributions of selected modes as described on the figure (Reprinted with permission from Beć et al., 2018b).

Similar articles

Cited by

References

    1. Ahmad M. (ed.). (2017). Fatty Acids. Oxford: Academic Press; AOCS Press.
    1. Alcalà M., Blanco M., Moyano D., Broad N. W., O'Brien N., Friedrich D., et al. (2013). Qualitative and quantitative pharmaceutical analysis with a novel handheld miniature near-infrared spectrometer. J. Near Infrared Spectrosc. 21, 445–447. 10.1255/jnirs.1084 - DOI
    1. Altinpinarn S., Sorak D., Siesler H. W. (2013). Near infrared spectroscopic analysis of hydrocarbon contaminants in soil with a hand-held spectrometer. J. Near Infrared Spectrosc. 21, 511–521. 10.1255/jnirs.1079 - DOI
    1. Barone V. (2005). Anharmonic vibrational properties by a fully automated second-order perturbative approach. J. Chem. Phys. 122, 14108–14118. 10.1063/1.1824881 - DOI - PubMed
    1. Beć K. B., Futami Y., Wójcik M. J., Nakajima T., Ozaki Y. (2016c). Spectroscopic and computational study of acetic acid and its cyclic dimer in the near-infrared region. J. Phys. Chem. A 120, 6170–6183. 10.1021/acs.jpca.6b04470 - DOI - PubMed

LinkOut - more resources