. 2019 Mar 6;5(3):eaav2448.
doi: 10.1126/sciadv.aav2448. eCollection 2019 Mar.

Chromatin capture links the metabolic enzyme AHCY to stem cell proliferation

Affiliations

Chromatin capture links the metabolic enzyme AHCY to stem cell proliferation

Sergi Aranda et al. Sci Adv. .

Abstract

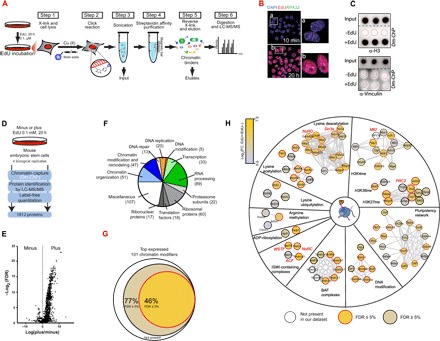
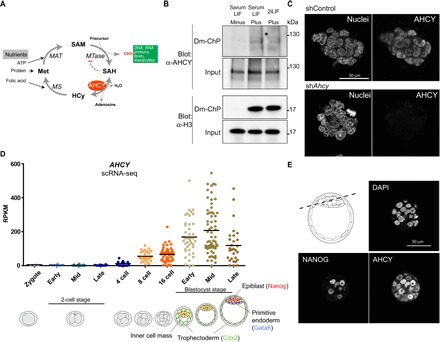
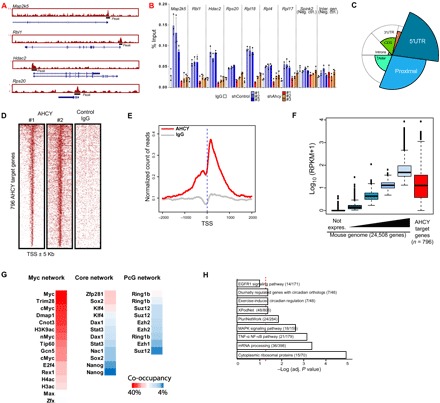
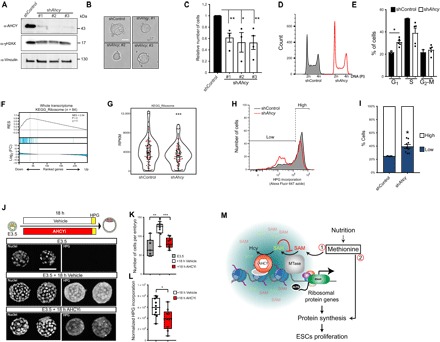
Profiling the chromatin-bound proteome (chromatome) in a simple, direct, and reliable manner might be key to uncovering the role of yet uncharacterized chromatin factors in physiology and disease. Here, we have designed an experimental strategy to survey the chromatome of proliferating cells by using the DNA-mediated chromatin pull-down (Dm-ChP) technology. Our approach provides a global view of cellular chromatome under normal physiological conditions and enables the identification of chromatin-bound proteins de novo. Integrating Dm-ChP with genomic and functional data, we have discovered an unexpected chromatin function for adenosylhomocysteinase, a major one-carbon pathway metabolic enzyme, in gene activation. Our study reveals a new regulatory axis between the metabolic state of pluripotent cells, ribosomal protein production, and cell division during the early phase of embryo development, in which the metabolic flux of methylation reactions is favored in a local milieu.


Figures

Fig. 1
Fig. 1. Dm-ChP for chromatin-bound proteome profiling.
(A) Schematic representation of the Dm-ChP technique for chromatin-bound proteome profiling. Cells were incubated with a very low amount of EdU during a long pulse (0.1 μM EdU for 20 hours) to label the whole genome. The DNA and associated proteins were cross-linked with 1% formaldehyde (FA) for 10 min, and the cells were lysed (step 1). The EdU-labeled DNA was conjugated to a biotin group by a Click reaction (step 2) and then fragmented by sonication (step 3). Labeled DNA fragments were isolated using streptavidin magnetic beads (step 4) and eluted using Laemmli buffer (step 5). Eluted samples were analyzed by Western blot or high-resolution MS (step 6). μM, micromolar. LC-MS/MS, liquid chromatography–tandem mass spectrometry (B) ESCs were pulsed with EdU at the times indicated and then stained with an anti-RP32 antibody, and EdU was detected by a Click reaction. Insets show magnifications of the image. DAPI, 4′,6-diamidino-2-phenylindole. (C) Input material and eluates prepared by Dm-ChP from nonincubated (−EdU) and EdU-incubated mouse ESCs (+EdU) were analyzed in triplicate by dot blot using the indicated antibodies. Dashed red circles indicate the position of the dotted samples. (D) Experimental scheme for the proteomic survey of pluripotent ESCs using Dm-ChP with high-resolution MS (Dm-ChP–MS). (E) Volcano plot of the 1812 proteins identified in the proteomic analysis in ESCs. Proteins enriched in EdU-ESCs are shown on the right, and those enriched in (non-EdU) ESCs are shown on the left. FDR, false discovery rate. (F) Pie chart representing the functional groups, by manual curation, of the 488 chromatin-bound proteins found in ESCs by Dm-ChP–MS and Significance Analysis of INTeractome (SAINT). The number of proteins is indicated in parentheses. (G) Venn diagram indicating the overlap between the manually curated list of previously reported chromatin modifiers [from (–65)] and our Dm-ChP–MS dataset. The list includes the top expressed chromatin modifiers in mouse ESCs (RPKM > 50). RPKM, Reads Per Kilobase Million. (H) Selected functional protein networks associated with chromatin organization and remodeling, DNA modification, and pluripotency. Related subnetworks are depicted separately according to their functional roles. The legend indicates the color code for the log2 of the fold changes in +EdU/−EdU conditions and the presence and significance of each protein in our dataset. Selected protein complexes are indicated in red. ACF (ID_925), adenosine 5′-triphosphate–dependent chromatin assembly factor complex; Mll2 (ID_6460), mixed-lineage leukemia 2 complex; NoRC (ID_5694), nucleolar remodeling complex; NuRD (ID_61), nucleosome remodeling deacetylase complex; PRC2 (ID_996), polycomb repressive complex 2; Sin3A (ID_283), paired amphipathic helix protein Sin3a complex; WSTF (ID_236), Williams syndrome transcription factor–containing complex (abbreviations for protein complexes are given with the identifier number of the archetypic complex at the CORUM database). ADP, adenosine 5′-diphosphate.
Fig. 2
Fig. 2. The AHCY enzyme is recruited to chromatin in pluripotent ESCs.
(A) Scheme of the methionine (Met) metabolic pathway. AHCY is depicted in red. MAT, methionine adenosyltransferase; MS, methionine synthase; MTase; methyltransferase; HCy, Homocysteine. (B) Input and chromatin isolated by Dm-ChP from ESCs, under serum-containing or 2iLIF culture conditions, with nonincubated (minus) or EdU-incubated cells (plus), were analyzed by Western blot using the indicated antibodies. H3 was used as a control of efficient chromatin purification by Dm-ChP. Note that specific AHCY bands correspond to the dimer in size that is resistant to reverse cross-linking by heating. (C) shControl and shAhcy-KD ESCs were stained with a specific anti-AHCY antibody and show the loss of a specific nuclear signal in all three shAhcy-KD cells. Nuclei were counterstained with DAPI. (D) Single-cell expression values of Ahcy during mouse development, from zygote to the late blastocyst stage. Each dot represents a cell from the original data of (33). scRNA-seq, single cell RNA-seq. (E) Representative confocal section covering the inner cell mass and the trophectoderm layers of mouse late preimplantation blastocysts (E4.5) immunostained for AHCY or NANOG.
Fig. 3
Fig. 3. AHCY occupies transcription start sites (TSS) of highly expressed genes in ESCs.
(A) Genomic visualization of AHCY ChIP-seq at several target sites. (B) AHCY ChIP-seq validation by ChIP-qPCR at TSS of AHCY target genes (Map2k5, Rbl1, Hdac2, Rps20, Rpl18, Rpl4, and Rpl17) and AHCY nontarget genomic regions (TSS of Spink2 and intergenic region at Chr15) as a negative control. ChIP-qPCRs were performed in shControl cells (n = 3) and shAhcy-KD ESCs with three independent shRNAs, showing the specific reduction in AHCY binding in shAhcy-KD ESCs (mean ± SD of three technical replicates). IgG, immunoglobulin G. (C) Genomic distribution of ChIP-seq peaks of AHCY. The spie chart represents the distribution of AHCY peaks corrected by the genome-wide distribution of each gene genomic feature (indicated in the background circle distribution). The spie charts indicate that AHCY preferentially occupies TSS neighborhood regions, including 5′ untranslated region (5′UTR) and proximal promoter regions. (D) Heat map showing the AHCY ChIP-seq occupancy profile around TSS (±5 kb) in two independent ChIP-seq replicates, with IgG as a negative control. (E) Meta-gene plot showing the AHCY ChIP-seq occupancy profile (red line) around TSS (±2 kb). IgG distribution is indicated by the gray line. (F) Box plots indicating the gene expression for the whole transcriptome in naïve ESCs, fractionated into five groups, from non-expressed genes (black box plot) to the highly expressed genes (light blue box plot). The red box plot indicates the expression of AHCY target genes. (G) Percentage of AHCY co-occupancy with chromatin factors from Myc, core, and PcG networks. (H) Pathway enrichment analysis of AHCY target genes. EGFR1, epidermal growth factor receptor 1; MAPK, mitogen-activated protein kinase; TNF-α, tumor necrosis factor–α; and NF-κB, nuclear factor κB.
Fig. 4
Fig. 4. AHCY promotes the expression of ribosomal protein genes, protein synthesis, and proliferation in ESCs.
(A) Total cell extracts from shControl- or shAhcy (three independent shRNAs)–infected cells were analyzed by Western blot with the indicated antibodies. The protein vinculin was used as a loading control. (B) Images of ESC colonies growing under naïve culture conditions, displaying the typical dome shape in both shControl and shAhcy-KD ESCs. Scale bar, 100 μm. (C) Histogram indicating the relative number of shControl and shAhcy-KD ESCs after 48 hours of growing under naïve conditions (mean ± SE, n = 4 for shControl, shAhcy#1, and shAhcy#3 and n = 3 for shAhcy#2; *P ≤ 0.05, **P ≤ 0.01, two-tailed Student’s t test). (D) Cell cycle profile of shControl and shAhcy-KD ESCs analyzed by fluorescence-activated cell sorting (FACS). PI, propidium iodide. (E) Histogram indicating the percentage of shControl and shAhcy-KD ESCs in different phases of the cell cycle (mean ± SE; *P ≤ 0.05, two-tailed Student’s t test; n = 2 shControl and n = 5 shAhcy). (F) Gene set enrichment analysis (GSEA) plots for the gene expression data generated by RNA-seq from cells infected with shControl (n = 2) or shAhcy (n = 5). The complete mouse genome was ranked according to their log2 fold change expression between shControl- and shAhcy-infected cells. Genes down-regulated in shAhcy are distributed on the left of the plot, and those up-regulated are distributed on the right. The top significant KEGG (Kyoto Encyclopedia of Genes and Genomes) pathway is shown together with the computed nominal P value, the q value, and the normalized enrichment score (NES). Distribution of ribosomal protein genes is indicated in blue lines, as well as the curve for the evolution of the gene density. (G) Violin plots indicating the expression of ribosomal protein genes calculated from RNA-seq. Each dot represents average expression of a ribosomal protein gene. Red dots indicate the ribosomal protein genes targeted by AHCY. ***P < 0.001, Wilcoxon matched pair signed-rank test. (H) Histogram indicates the relative incorporation of the methionine analog L-HPG in shControl and shAhcy-KD ESCs as analyzed by FACS. (I) Quantification of high and low percentage of L-HPG–incorporated cells (mean ± SE; *P ≤ 0.05, two-tailed Student’s t test; n = 3 shControl and n = 9 shAhcy). (J) Mouse preimplantation embryos (E3.5) were cultured ex vivo in the presence of 3-deazaadenosine (3-DZA) or DMSO (as vehicle) for 18 hours. Embryos were then pulsed once with L-HPG and labeled using the Click reaction. Developmental progression of embryos was evaluated by (K) counting the number of cells per embryo or (L) quantifying the total L-HPG incorporation per embryo and normalizing this by the number of cells. *P < 0.05, **P < 0.01, ***P < 0.001, Mann-Whitney test two-tailed; n = 3 for E3.5, and n = 10 for 18-hour vehicle and n = 9 for 18-hour AHCYi. (M) Model for the AHCY-dependent proliferation control of pluripotent cells. Nutrients are the primary source of cellular methionine, which, in turn, can be incorporated into the newly synthetized proteins (1) or it can be used to produce SAM as a methyl donor for MTases (2). Elevated levels of SAH produced by the transfer of the methyl group can inhibit the MTases. AHCY is recruited to highly transcribed genes, such as ribosomal protein genes, to favor the efficient methylation reactions at these loci and the production of mature transcripts in an efficient manner. Elevated ribosomal protein production sustains the rate of protein synthesis and proliferation in ESCs.

References

    1. Erdel F., Rippe K., Formation of chromatin subcompartments by phase separation. Biophys. J. 114, 2262–2270 (2018). - PMC - PubMed
    1. Stunnenberg H. G.; International Human Epigenome Consortium, Hirst M., The International Human Epigenome Consortium: A blueprint for scientific collaboration and discovery. Cell 167, 1145–1149 (2016). - PubMed
    1. Skipper M., Eccleston A., Gray N., Heemels T., Le Bot N., Marte B., Weiss U., Presenting the epigenome roadmap. Nature 518, 313 (2015). - PubMed
    1. Wierer M., Mann M., Proteomics to study DNA-bound and chromatin-associated gene regulatory complexes. Hum. Mol. Genet. 25, R106–R114 (2016). - PMC - PubMed
    1. Sirbu B. M., Couch F. B., Feigerle J. T., Bhaskara S., Hiebert S. W., Cortez D., Analysis of protein dynamics at active, stalled, and collapsed replication forks. Genes Dev. 25, 1320–1327 (2011). - PMC - PubMed

Publication types