

Magnetization Transfer MRI of Breast Cancer in the Community Setting: Reproducibility and Preliminary Results in Neoadjuvant Therapy
- PMID: 30854441
- PMCID: PMC6403021
- DOI: 10.18383/j.tom.2018.00019
Magnetization Transfer MRI of Breast Cancer in the Community Setting: Reproducibility and Preliminary Results in Neoadjuvant Therapy
Abstract
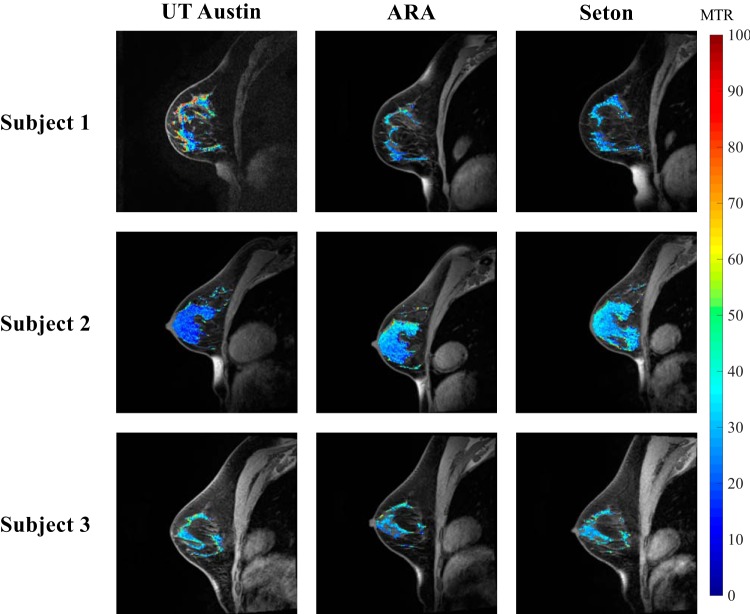
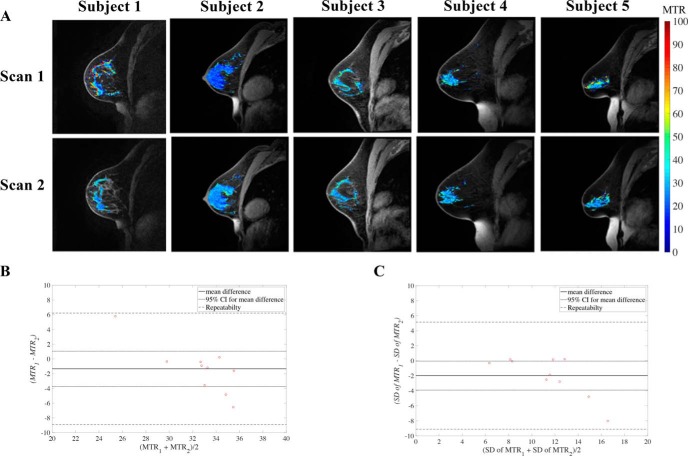
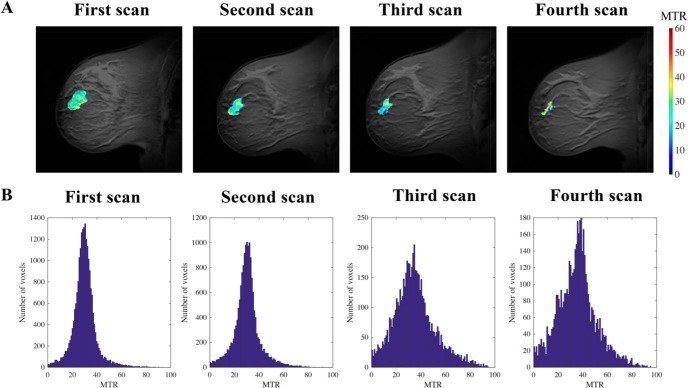
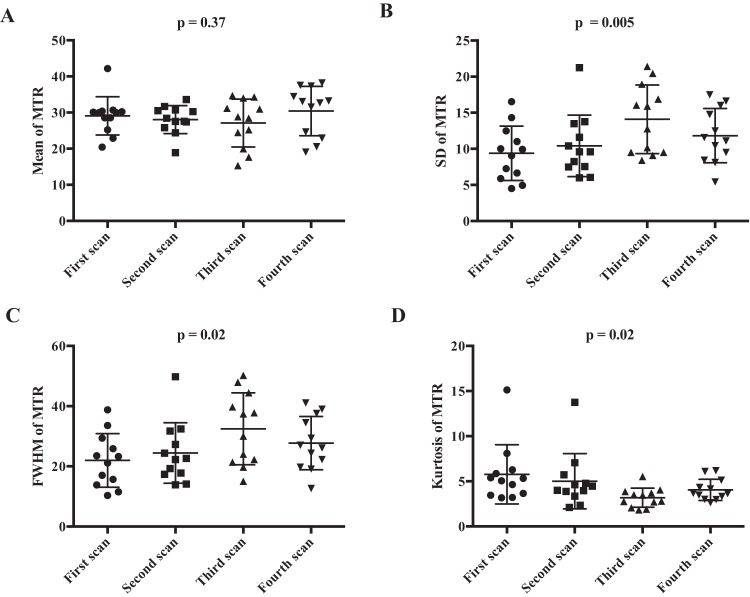
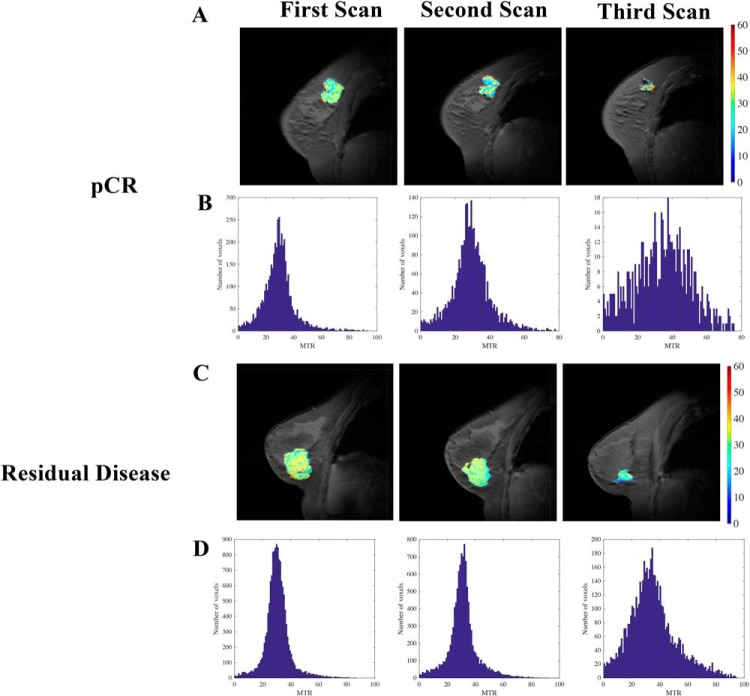
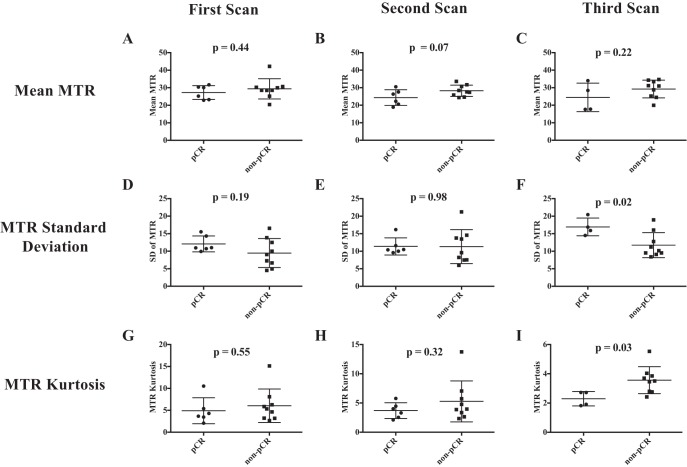
Repeatability and reproducibility of magnetization transfer magnetic resonance imaging of the breast, and the ability of this technique to assess the response of locally advanced breast cancer to neoadjuvant therapy (NAT), are determined. Reproducibility scans at 3 different 3 T scanners, including 2 scanners in community imaging centers, found a 16.3% difference (n = 3) in magnetization transfer ratio (MTR) in healthy breast fibroglandular tissue. Repeatability scans (n = 10) found a difference of ∼8.1% in the MTR measurement of fibroglandular tissue between the 2 measurements. Thus, MTR is repeatable and reproducible in the breast and can be integrated into community imaging clinics. Serial magnetization transfer magnetic resonance imaging performed at longitudinal time points during NAT indicated no significant change in average tumoral MTR during treatment. However, histogram analysis indicated an increase in the dispersion of MTR values of the tumor during NAT, as quantified by higher standard deviation (P = .005), higher full width at half maximum (P = .02), and lower kurtosis (P = .02). Patients' stratification into those with pathological complete response (pCR; n = 6) at the conclusion of NAT and those with residual disease (n = 9) showed wider distribution of tumor MTR values in patients who achieved pCR after 2-4 cycles of NAT, as quantified by higher standard deviation (P = .02), higher full width at half maximum (P = .03), and lower kurtosis (P = .03). Thus, MTR can be used as an imaging metric to assess response to breast NAT.
Keywords: MT-MRI; MTR; NAT; repeatability; reproducibility.
Figures
Similar articles
-
Quantitative magnetic resonance imaging and tumor forecasting of breast cancer patients in the community setting.Nat Protoc. 2021 Nov;16(11):5309-5338. doi: 10.1038/s41596-021-00617-y. Epub 2021 Sep 22. Nat Protoc. 2021. PMID: 34552262 Free PMC article. Review.
-
Comparison of automated breast volume scanning with conventional ultrasonography, mammography, and MRI to assess residual breast cancer after neoadjuvant therapy by molecular type.Clin Radiol. 2023 May;78(5):e393-e400. doi: 10.1016/j.crad.2022.12.002. Epub 2023 Jan 13. Clin Radiol. 2023. PMID: 36822980
-
Magnetization transfer ratio: a potential biomarker for the assessment of postradiation fibrosis in patients with rectal cancer.Invest Radiol. 2014 Jan;49(1):29-34. doi: 10.1097/RLI.0b013e3182a3459b. Invest Radiol. 2014. PMID: 24002079 Clinical Trial.
-
The rate of breast fibroglandular enhancement during dynamic contrast-enhanced MRI reflects response to neoadjuvant therapy.Eur J Radiol. 2021 Mar;136:109534. doi: 10.1016/j.ejrad.2021.109534. Epub 2021 Jan 9. Eur J Radiol. 2021. PMID: 33454460 Free PMC article.
-
Pathologic Evaluation of Breast Cancer after Neoadjuvant Therapy.J Pathol Transl Med. 2016 May;50(3):173-80. doi: 10.4132/jptm.2016.02.02. Epub 2016 Apr 11. J Pathol Transl Med. 2016. PMID: 27068026 Free PMC article. Review.
Cited by
-
Bimodal magnetic resonance and optical imaging of extracellular matrix remodelling by orthotopic ovarian tumours.Br J Cancer. 2020 Jul;123(2):216-225. doi: 10.1038/s41416-020-0878-7. Epub 2020 May 11. Br J Cancer. 2020. PMID: 32390007 Free PMC article.
-
Current and Emerging Magnetic Resonance-Based Techniques for Breast Cancer.Front Med (Lausanne). 2020 May 12;7:175. doi: 10.3389/fmed.2020.00175. eCollection 2020. Front Med (Lausanne). 2020. PMID: 32478083 Free PMC article. Review.
-
Quantitative Imaging Enters the Clinical Arena: A Personal Viewpoint.Tomography. 2020 Jun;6(2):56-59. doi: 10.18383/j.tom.2020.00028. Tomography. 2020. PMID: 32548280 Free PMC article.
-
Quantitative magnetic resonance imaging and tumor forecasting of breast cancer patients in the community setting.Nat Protoc. 2021 Nov;16(11):5309-5338. doi: 10.1038/s41596-021-00617-y. Epub 2021 Sep 22. Nat Protoc. 2021. PMID: 34552262 Free PMC article. Review.
References
-
- Sled JG. Modelling and interpretation of magnetization transfer imaging in the brain. Neuroimage. 2018;182:128–135. - PubMed
-
- Bonini RH, Zeotti D, Saraiva LA, Trad CS, Filho JM, Carrara HH, de Andrade JM, Santos AC, Muglia VF. Magnetization transfer ratio as a predictor of malignancy in breast lesions: preliminary results. Magn Reson Med. 2008;59:1030–1034. - PubMed
-
- Wolff SD, Balaban RS. Magnetization transfer contrast (MTC) and tissue water proton relaxation in vivo. Magn Reson Med. 1989;10:135–144. - PubMed
-
- Henkelman RM, Stanisz GJ, Graham SJ. Magnetization transfer in MRI: a review. NMR Biomed. 2001;14:57–64. - PubMed
-
- Filippi M, Rocca MA. Magnetization transfer magnetic resonance imaging in the assessment of neurological diseases. J Neuroimaging. 2004;14:303–313. - PubMed
Publication types
MeSH terms
Grants and funding
LinkOut - more resources
Full Text Sources
Medical
