

ePAD: An Image Annotation and Analysis Platform for Quantitative Imaging
- PMID: 30854455
- PMCID: PMC6403025
- DOI: 10.18383/j.tom.2018.00055
ePAD: An Image Annotation and Analysis Platform for Quantitative Imaging
Abstract
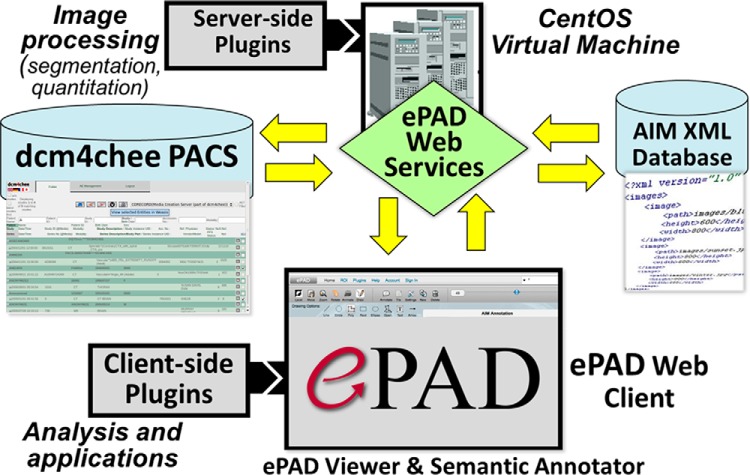
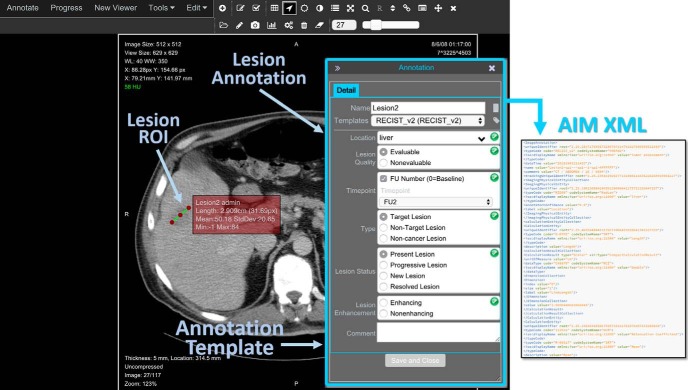
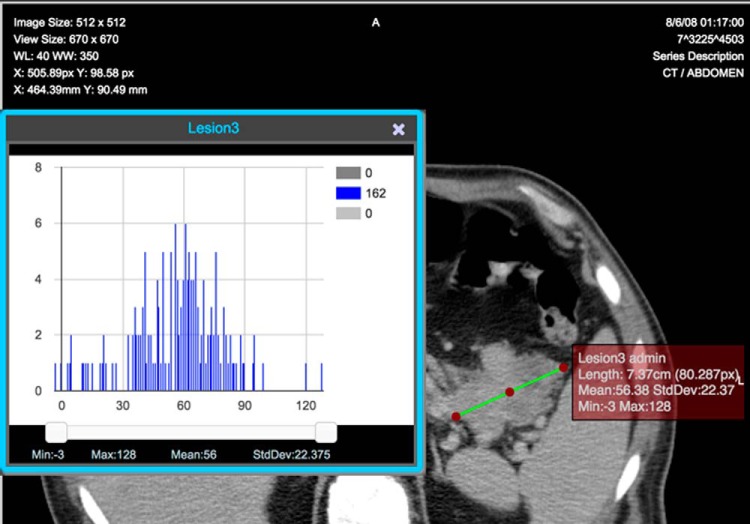
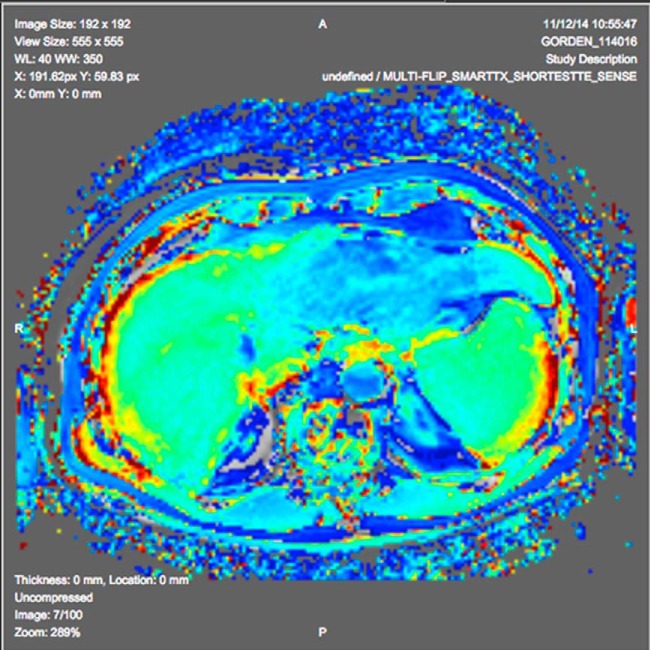
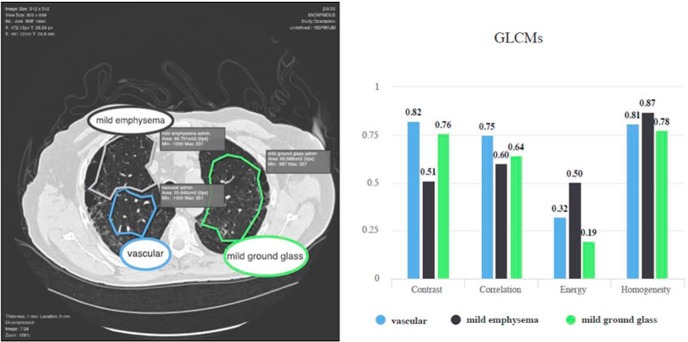
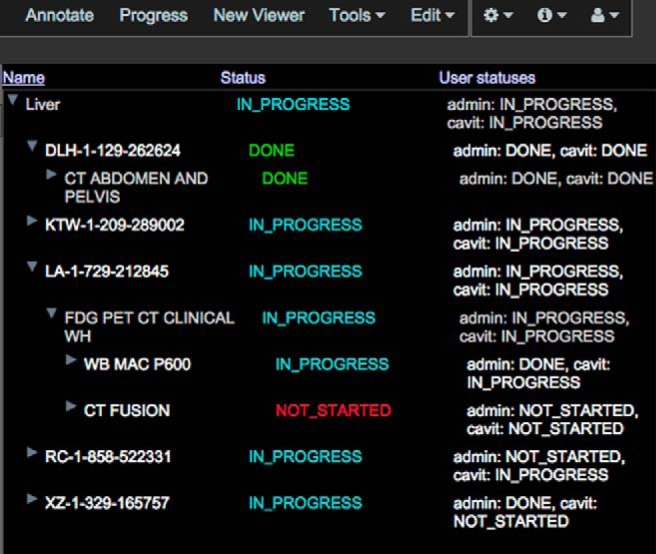
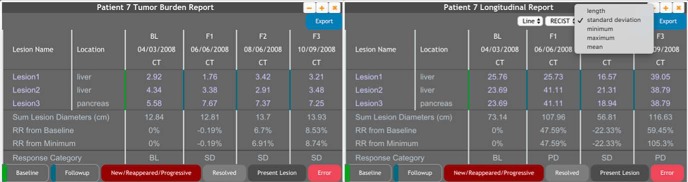
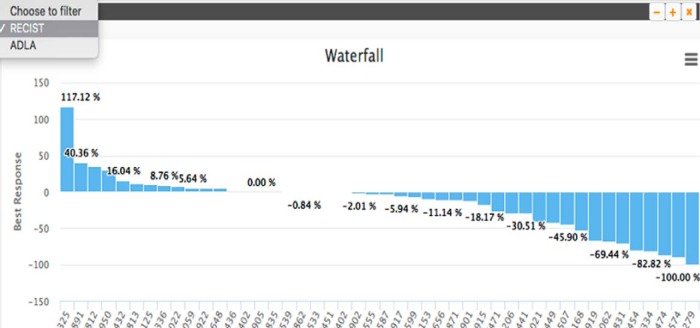
Medical imaging is critical for assessing the response of patients to new cancer therapies. Quantitative lesion assessment on images is time-consuming, and adopting new promising quantitative imaging biomarkers of response in clinical trials is challenging. The electronic Physician Annotation Device (ePAD) is a freely available web-based zero-footprint software application for viewing, annotation, and quantitative analysis of radiology images designed to meet the challenges of quantitative evaluation of cancer lesions. For imaging researchers, ePAD calculates a variety of quantitative imaging biomarkers that they can analyze and compare in ePAD to identify potential candidates as surrogate endpoints in clinical trials. For clinicians, ePAD provides clinical decision support tools for evaluating cancer response through reports summarizing changes in tumor burden based on different imaging biomarkers. As a workflow management and study oversight tool, ePAD lets clinical trial project administrators create worklists for users and oversee the progress of annotations created by research groups. To support interoperability of image annotations, ePAD writes all image annotations and results of quantitative imaging analyses in standardized file formats, and it supports migration of annotations from various propriety formats. ePAD also provides a plugin architecture supporting MATLAB server-side modules in addition to client-side plugins, permitting the community to extend the ePAD platform in various ways for new cancer use cases. We present an overview of ePAD as a platform for medical image annotation and quantitative analysis. We also discuss use cases and collaborations with different groups in the Quantitative Imaging Network and future directions.
Keywords: AIM (Annotation and Image Markup); DICOM SR (DICOM Structure Report); biomarker evaluation; feature extraction; medical image annotation.
Figures
References
-
- Garrett MD, Workman P. Discovering novel chemotherapeutic drugs for the third millennium. Eur J Cancer. 1999;35:2010–2030. - PubMed
-
- Hanahan D, Weinberg RA. The hallmarks of cancer. Cell. 2000;100:57–70. - PubMed
-
- NIH Clinical Trials Working Group. Final CTWG report to the National Cancer Advisory Board, “Restructuring the National Cancer Clinical Trials Enterprise”. http://integratedtrials.nci.nih.gov/ict/CTWG_report_June2005.pdf; Accessed: December 21, 2008.
-
- El-Maraghi RH, Eisenhauer EA. Review of phase II trial designs used in studies of molecular targeted agents: outcomes and predictors of success in phase III. J Clin Oncol. 2008;26:1346–1354. - PubMed
-
- Taylor PT, Haverstick D. Re: New guidelines to evaluate the response to treatment in solid tumors (ovarian cancer). J Natl Cancer Inst. 2005;97:151. - PubMed
Publication types
MeSH terms
Grants and funding
LinkOut - more resources
Full Text Sources
Research Materials
