. 2019 May 1;22(5):358-369.
doi: 10.1093/ijnp/pyz012.

One-Year Treatment with Olanzapine Depot in Female Rats: Metabolic Effects

Affiliations

One-Year Treatment with Olanzapine Depot in Female Rats: Metabolic Effects

Kari M Ersland et al. Int J Neuropsychopharmacol. .

Abstract

Background: Antipsychotic drugs can negatively affect the metabolic status of patients, with olanzapine as one of the most potent drugs. While patients are often medicated for long time periods, experiments in rats typically run for 1 to 12 weeks, showing olanzapine-related weight gain and increased plasma lipid levels, with transcriptional upregulation of lipogenic genes in liver and adipose tissue. It remains unknown whether metabolic status will deteriorate with time.

Methods: To examine long-term metabolic effects, we administered intramuscular long-acting injections of olanzapine (100 mg/kg BW) or control substance to female rats for up to 13 months.

Results: Exposure to olanzapine long-acting injections led to rapid weight gain, which was sustained throughout the experiment. At 1, 6, and 13 months, plasma lipid levels were measured in separate cohorts of rats, displaying no increase. Hepatic transcription of lipid-related genes was transiently upregulated at 1 month. Glucose and insulin tolerance tests indicated insulin resistance in olanzapine-treated rats after 12 months.

Conclusion: Our data show that the continuous increase in body weight in response to long-term olanzapine exposure was accompanied by surprisingly few concomitant changes in plasma lipids and lipogenic gene expression, suggesting that adaptive mechanisms are involved to reduce long-term metabolic adverse effects of this antipsychotic agent in rats.

Keywords: diabetes; long-term; olanzapine; rat; weight gain.


Figures

Figure 1.
Figure 1.
Schematic overview of the experimental setup. The study initially included 56 control rats and 54 olanzapine-treated rats. (a) Long-acting injections (LAI) of olanzapine are indicated by vertical bars, and time points of sacrifice are illustrated by number of treatment months. Olanzapine-treated rats (n = 10) and vehicle-treated rats (n = 10) were sacrificed at each indicated time point. (b) After 13 months of olanzapine treatment, the remaining 50 rats were subdivided into 5 groups: ad libitum-fed vehicle-treated rats (n = 12), ad libitum- and pair-fed (both n = 7) subchronic olanzapine-treated rats, and ad libitum- and pair-fed (both n = 12) chronic olanzapine-treated rats. Grey vertical bars illustrate LAI during the experiment, and the black arrow indicates the last injected dose.
Figure 2.
Figure 2.
Cumulative body weight gain. Average weight gain in grams (± SEM). Data for all rats alive at any given time point are included. Note that for each time point where rats were sacrificed (marked with †), these rats were eliminated from the weight estimates. A drop in cumulative weight gain for olanzapine-exposed animals can be observed around day 75, due to possible signs of toxicity, e.g., sedation. Repeated-measures ANOVA was used to analyze differences in cumulative body weight gain between olanzapine- and vehicle- exposed animals: ***P ≤ .001, compared with vehicle.
Figure 3.
Figure 3.
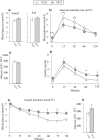
Glucose and insulin tolerance. Glucose and insulin tolerance tests (GTT/ITT) were performed 3 weeks apart in the same rats treated either with vehicle (VEH; n = 10) or olanzapine LAI (OLZ; n = 10). (a) Fed and fasted blood glucose was measured from whole blood before and after a 2- (GTT) or 6- (ITT) hour fast, respectively. (b) GTT showing whole blood glucose concentrations during the first 2 hours after administration of 2 mg glucose per gram of total body mass by oral gavage. (c) Area under the curve (AUC) calculated from blood glucose concentrations during the GTT. (d) Plasma insulin concentrations during the GTT. (e) ITT showing blood glucose during the first 90 minutes after an i.p. injection of 0.75 U/kg BW insulin. (f) AUC calculated from blood glucose concentrations during the ITT. Statistically significant change between fasted and fed blood glucose was assessed using the 2-sided Student’s t test. Two-way repeated-measures ANOVA or mixed-effects model, and Sidak’s multiple comparison test was used to analyze the glucose measurements during the GTT and ITT, in addition to insulin measurements taken during the GTT. * P ≤ .05.
Figure 4.
Figure 4.
Liver and periovarian white adipose tissue weight. Weights are given as percentage body weight (±SEM) at the 4 different time points of sacrifice. OLZ, olanzapine; VEH, vehicle. Data for ad libitum-fed olanzapine-treated rats are shown at 13 months. The 2-sided Student’s t test was used to assess statistically significant alterations in weight: *uncorrected P ≤ .05, ***uncorrected P ≤ .001, compared with vehicle.
Figure 5.
Figure 5.
Expression of genes encoding rate-limiting lipogenic enzymes in liver and periovarian white adipose tissue. At each time point, quantitative real-time PCR (qPCR) was performed. Fold change is expressed relative to vehicle, which is always normalized to 1. Fold changes are given as mean ± SEM. Acc1, acetyl-CoA carboxylase 1; Fasn, fatty acid synthase; Hmgcr, HMG-CoA reductase. The 2-sided Student’s t test was used to assess statistically significant alterations in expression levels: *uncorrected P ≤ .05, compared with vehicle.
Figure 6.
Figure 6.
Expression of genes encoding rate-limiting lipogenic enzymes in liver and periovarian white adipose tissue 5 days after a first-ever injection of olanzapine LAI in rats treated as controls for 12.5 months. Acc1, acetyl-CoA carboxylase 1; Fasn: fatty acid synthase; Hmgcr: HMG-CoA reductase; OLZ ad lib: olanzapine-treated rats with free access to chow; OLZ pair-fed: olanzapine-treated rats with restricted access to chow; VEH, vehicle. Fold changes are given as mean ± SEM. One-way ANOVA, followed by Dunnett’s multiple comparisons test, was used to assess statistical significance. **Dunnett’s adjusted P ≤ .01, ***Dunnett’s adjusted P ≤ .001.

Similar articles

Cited by

References

    1. Albaugh VL, Judson JG, She P, Lang CH, Maresca KP, Joyal JL, Lynch CJ (2011) Olanzapine promotes fat accumulation in male rats by decreasing physical activity, repartitioning energy and increasing adipose tissue lipogenesis while impairing lipolysis. Mol Psychiatry 16:569–581. - PMC - PubMed
    1. Albaugh VL, Vary TC, Ilkayeva O, Wenner BR, Maresca KP, Joyal JL, Breazeale S, Elich TD, Lang CH, Lynch CJ (2012) Atypical antipsychotics rapidly and inappropriately switch peripheral fuel utilization to lipids, impairing metabolic flexibility in rodents. Schizophr Bull 38:153–166. - PMC - PubMed
    1. Aleixandre de Artinano A, Miguel Castro M (2009) Experimental rat models to study the metabolic syndrome. Br J Nutr 102:1246–1253. - PubMed
    1. Aravagiri M, Teper Y, Marder SR (1999) Pharmacokinetics and tissue distribution of olanzapine in rats. Biopharm Drug Dispos 20:369–377. - PubMed
    1. Benarroch L, Kowalchuk C, Wilson V, Teo C, Guenette M, Chintoh A, Nesarajah Y, Taylor V, Selby P, Fletcher P, Remington GJ, Hahn MK (2016) Atypical antipsychotics and effects on feeding: from mice to men. Psychopharmacology (Berl) 233:2629–2653. - PubMed

Publication types

MeSH terms