. 2019 May 21;47(9):4476-4494.
doi: 10.1093/nar/gkz163.

GSK3β-SCFFBXW7α mediated phosphorylation and ubiquitination of IRF1 are required for its transcription-dependent turnover

Affiliations

GSK3β-SCFFBXW7α mediated phosphorylation and ubiquitination of IRF1 are required for its transcription-dependent turnover

Alexander J Garvin et al. Nucleic Acids Res. .

Abstract

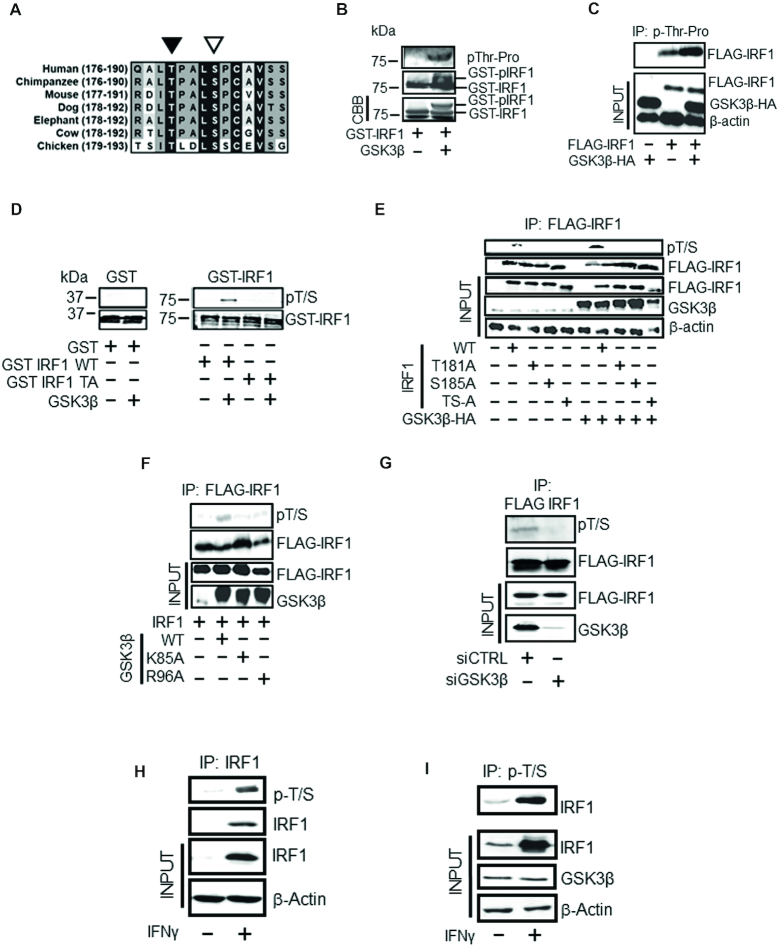
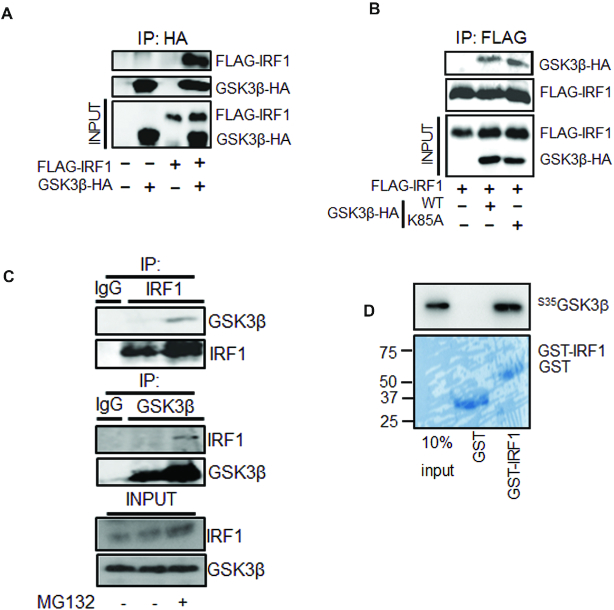
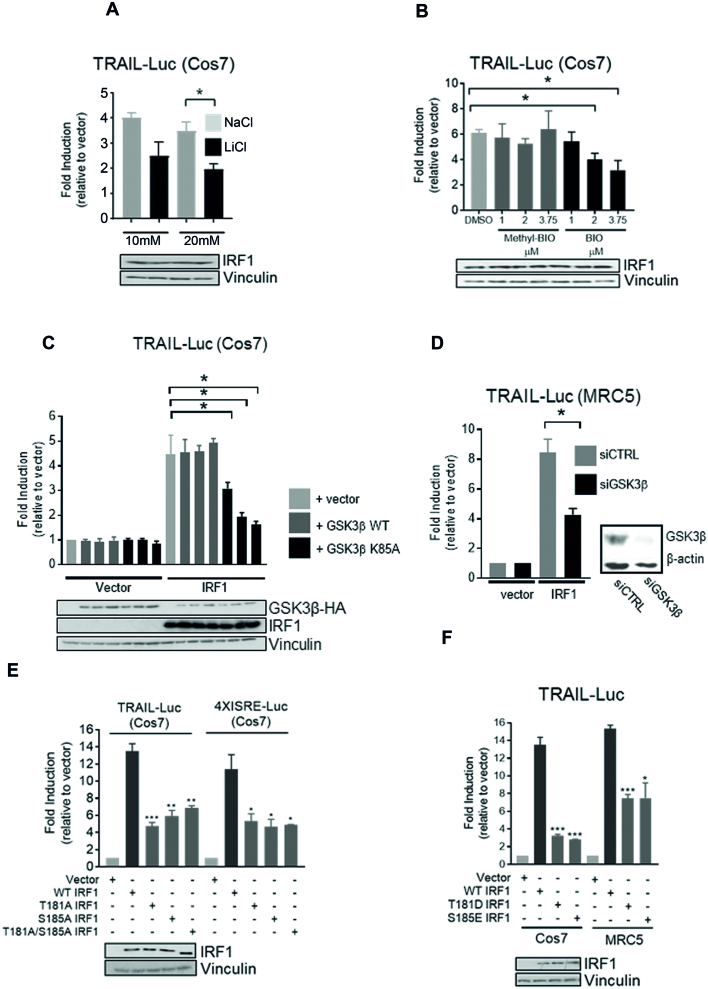
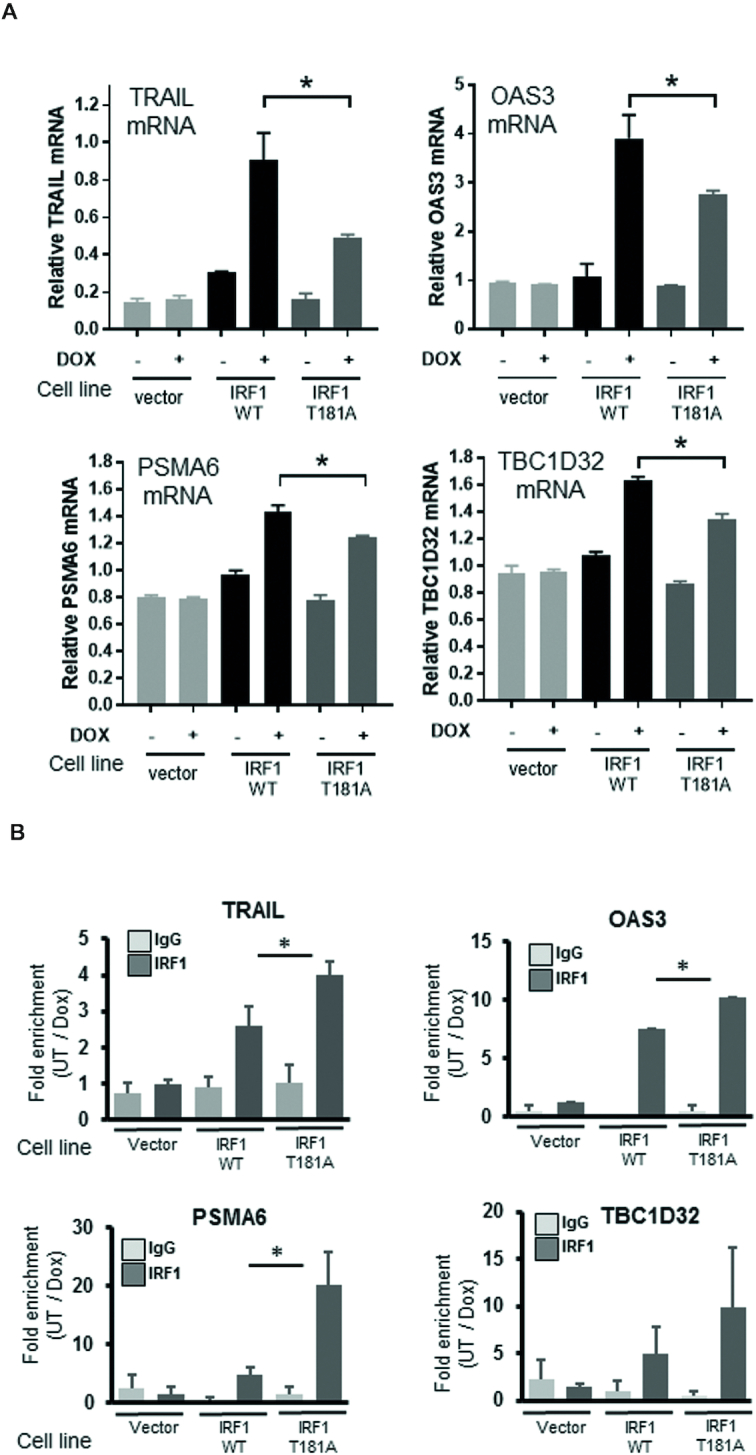
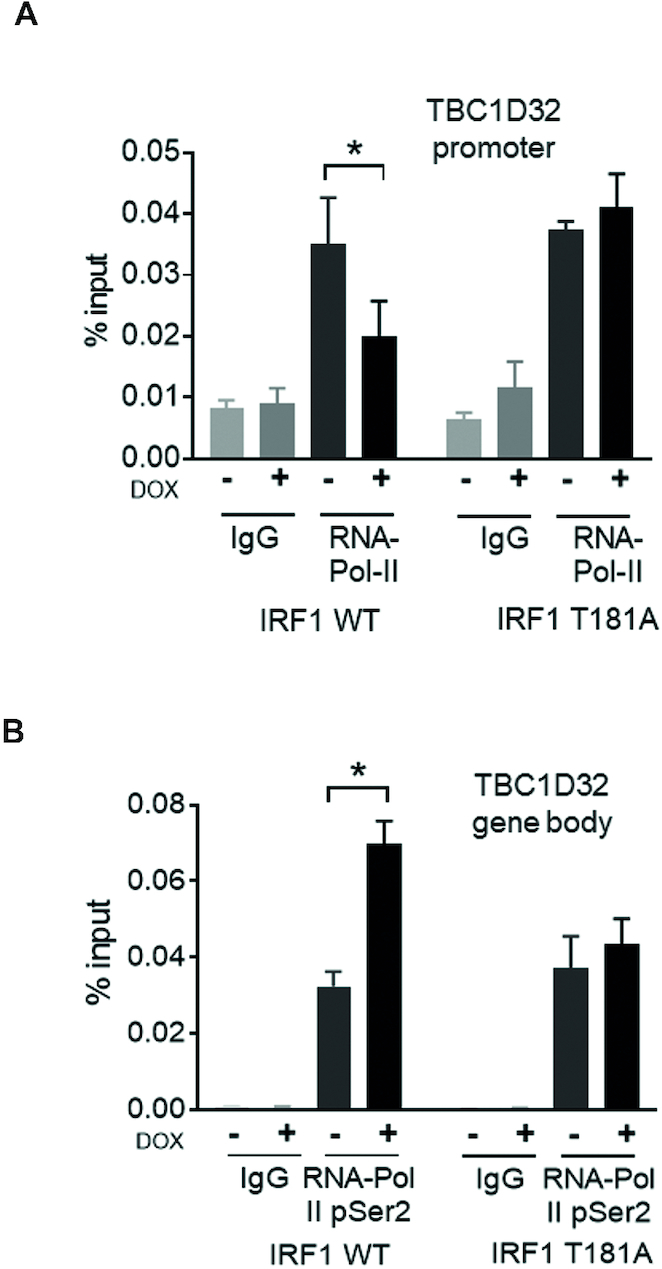
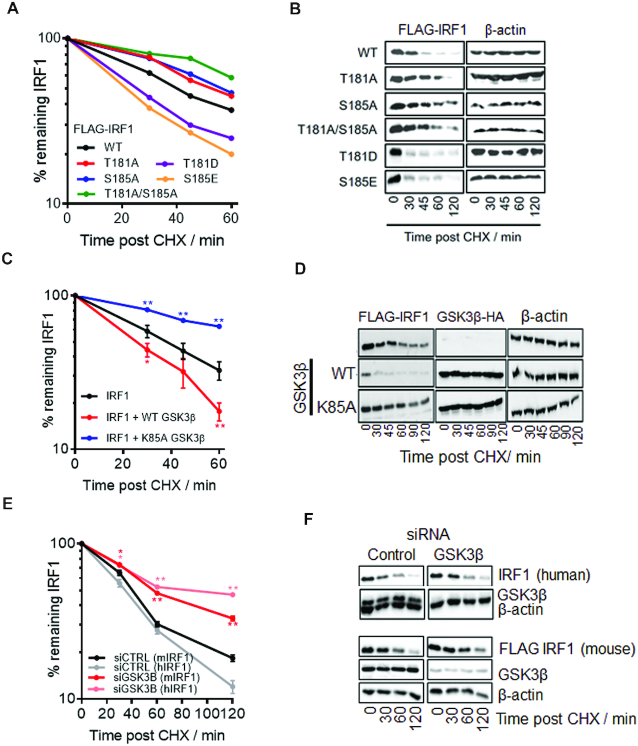
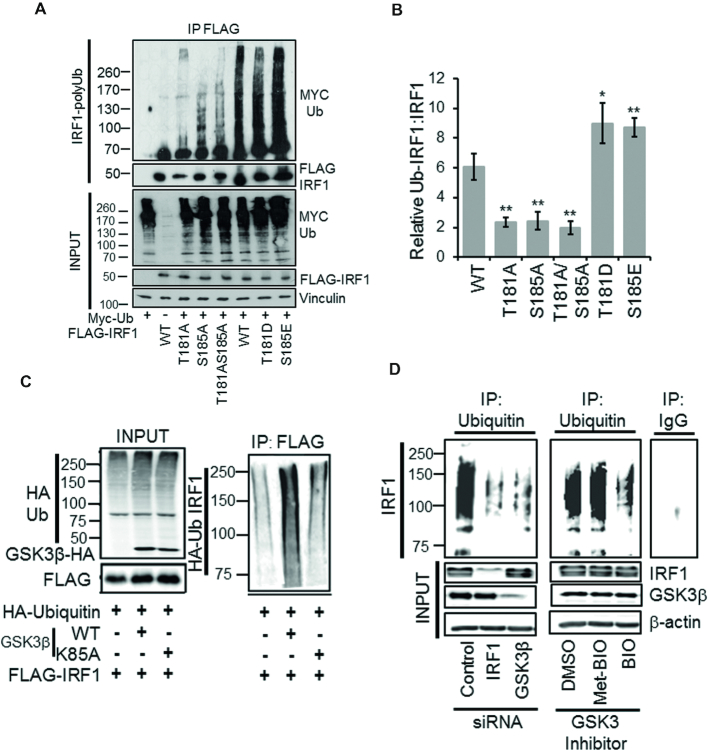
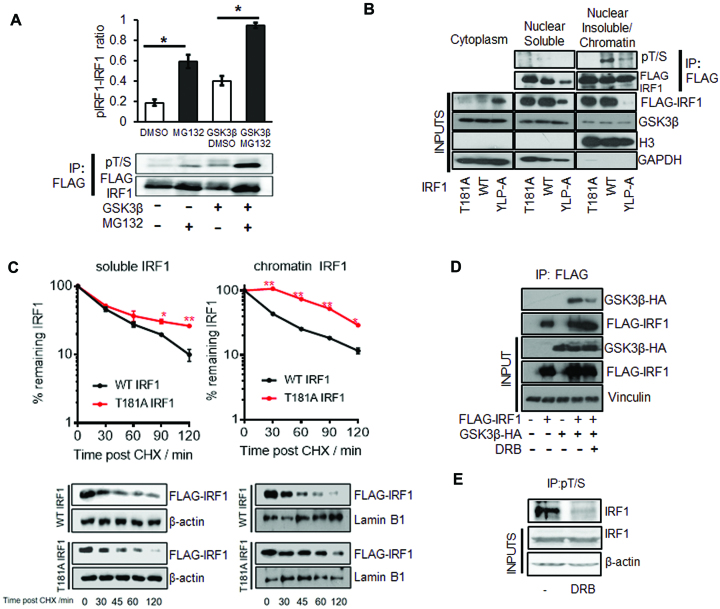
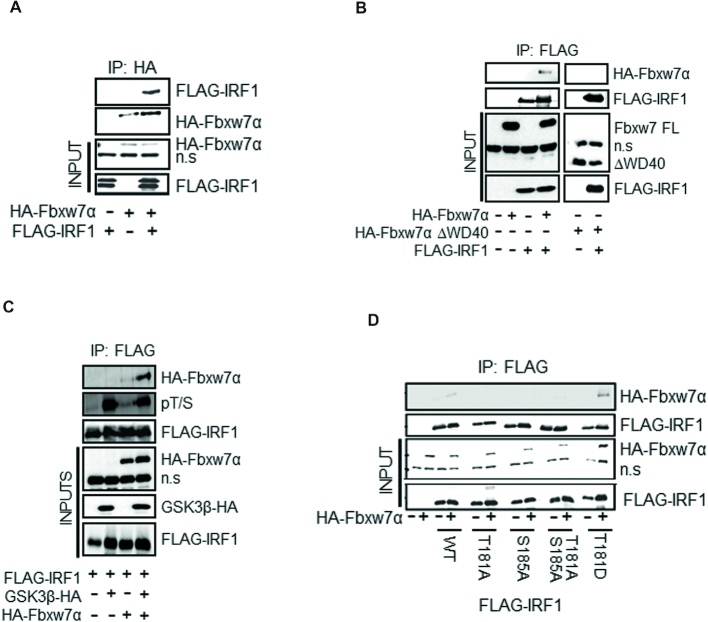
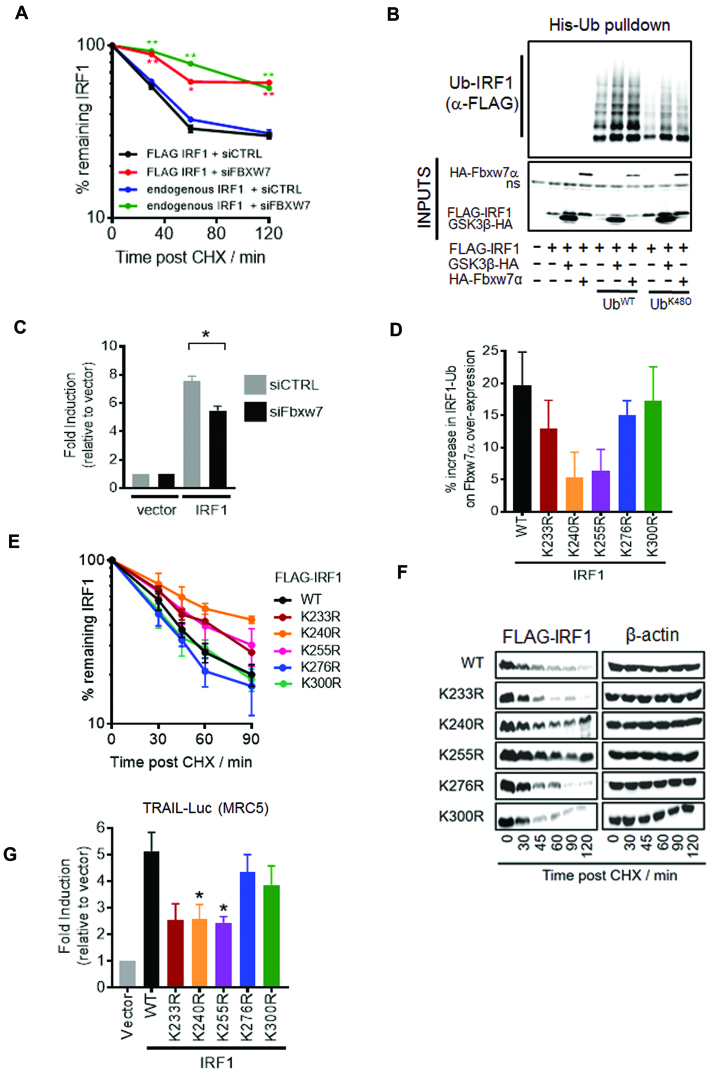
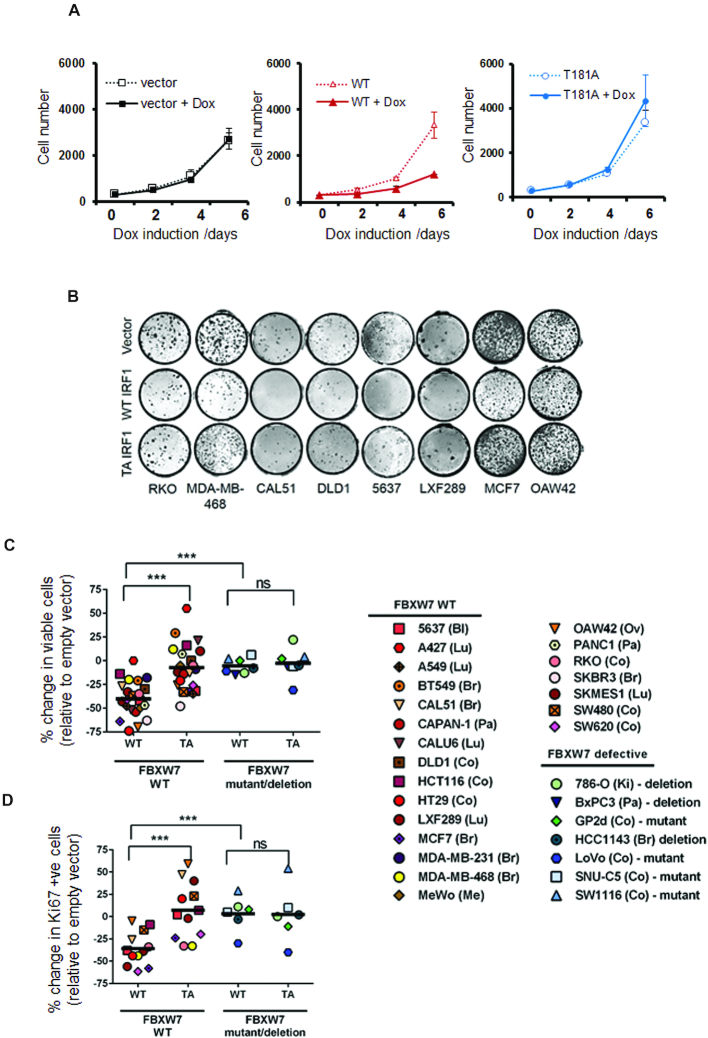
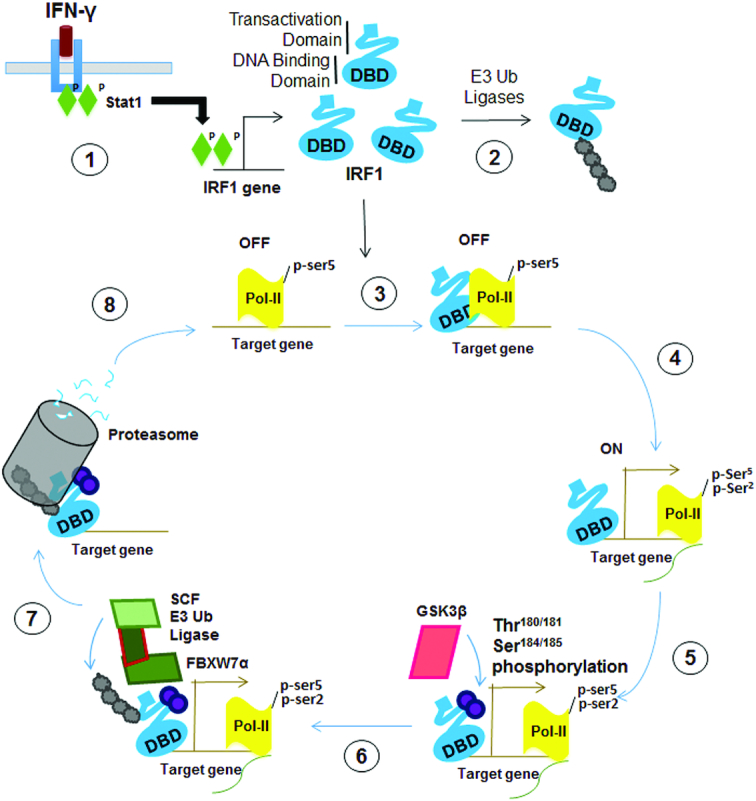
IRF1 (Interferon Regulatory Factor-1) is the prototype of the IRF family of DNA binding transcription factors. IRF1 protein expression is regulated by transient up-regulation in response to external stimuli followed by rapid degradation via the ubiquitin-proteasome system. Here we report that DNA bound IRF1 turnover is promoted by GSK3β (Glycogen Synthase Kinase 3β) via phosphorylation of the T181 residue which generates a phosphodegron for the SCF (Skp-Cul-Fbox) ubiquitin E3-ligase receptor protein Fbxw7α (F-box/WD40 7). This regulated turnover is essential for IRF1 activity, as mutation of T181 results in an improperly stabilized protein that accumulates at target promoters but fails to induce RNA-Pol-II elongation and subsequent transcription of target genes. Consequently, the anti-proliferative activity of IRF1 is lost in cell lines expressing T181A mutant. Further, cell lines with dysfunctional Fbxw7 are less sensitive to IRF1 overexpression, suggesting an important co-activator function for this ligase complex. As T181 phosphorylation requires both DNA binding and RNA-Pol-II elongation, we propose that this event acts to clear 'spent' molecules of IRF1 from transcriptionally engaged target promoters.


Figures

Figure 1.
Figure 1.
IRF1 is phosphorylated by GSK3β. (A) Sequence conservation of the putative GSK3β phospho-target sequence in different species. The phosphorylated T180 and the +4 priming site (S184) (T181/S185 in murine sequence) residues are indicated by black and white arrowheads, respectively. Residue numbers in parentheses. (B) In vitro kinase assay performed using recombinant GSK3β and purified GST-IRF1 protein as substrate. The reaction products were resolved by SDS PAGE and GST-IRF1 T181 phosphorylation revealed by western blotting using anti-pTP antibody (top panel). Altered migration of GST-IRF1 after phosphorylation by GSK3β was also visible after western blot detection using anti-IRF1 (middle panel), or by Coomassie brilliant blue (CBB) staining (bottom panel). The lowest band in the CBB panel is the loading dye front. (C) Lysates from HEK293 cells expressing GSK3β-HA and mouse FLAG-IRF1, immunoprecipitated with the p-TP antibody. Immunoprecipitated IRF1 was detected with anti-FLAG antibody. Inputs (10%) indicate the expression of transfected FLAG-IRF1 and GSK3β-HA proteins, and loading control β-actin. (D) In vitro kinase assay performed as in 1B but visualized by immunoblot with pT/S (pThr58/Ser62 c-Myc) and with GST tag control. The T181A mutant is included to demonstrate specificity of the antibody. Note: the GST and GST-IRF1 samples were run in parallel on separate SDS-PAGE gels. (E) Lysates of HEK293 cells expressing FLAG-IRF1 WT or mutants together with GSK3β-HA or empty vector were immunoprecipitated with anti-FLAG beads. IRF1 T181/S185 dual phosphorylation was detected by western blotting with pT/S antibody (top panel). Successful IP of IRF1 proteins in the extracts was confirmed by re-probing with anti-FLAG antibody (second panel). Inputs (10%) are shown in the lower three panels and indicate the levels of IRF1 (anti-FLAG), GSK3β (anti-HA) and loading control β-actin. (F) As for E), but with GSK3β kinase inactive (K85A) and priming mutants (R96A). (G) HEK293 cells treated with siRNAs to deplete GSK3β (or control) for 24 hr prior to transfection with FLAG-IRF1 for a further 48 hr. Lysates were immunoprecipitated and probed with pT/S antibody and FLAG to show IP efficiency. (H) Extracts from MRC5 cells treated for 3 hr with IFNγ (1000U / mL) or vehicle were immunoprecipitated with anti-IRF1 and probed with pT/S. Input lysates (10%) are shown below. (I) H3396 lysates (IFNγ treated as for H) immunoprecipitated with pT/S followed by probe with IRF1. Input lysates (10%) are shown below against IRF1, GSK3β and β-actin.
Figure 2.
Figure 2.
IRF1 interacts with GSK3β. (A) Extracts from HEK293 cells expressing FLAG-IRF1 and GSK3β-HA were immunoprecipitated with anti-HA. Shown are western blots used to reveal co-precipitated GSK3β-HA or FLAG-IRF1 proteins. Expression levels in the inputs (10%) are shown in the bottom panels. (B) As for (A), but using anti-FLAG immunoprecipitation and including kinase inactive GSK3β-HA (K85A) (C) Extracts from H3396 cells pre-treated with MG132 (10 μM) or DMSO for 3hr, immunoprecipitated with IgG, anti-IRF1 or anti-GSK3β antibodies to reveal endogenous complexes. (D) GST pulldown experiment using bacterially expressed, partially purified GST (27kda) or GST-IRF1 (63 KDa) immobilized on glutathione sepharose beads and incubated with in vitro transcribed/translated 35[S]-methionine-labelled GSK3β-HA. Proteins retained on the beads were visualized by autoradiography. 10% input of radiolabeled product is shown as input. Lower panel shows a parallel CBB stained gel to show loading.
Figure 3.
Figure 3.
GSK3β is required for IRF1 transcriptional activity. (A) Reporter assays in Cos7 cells transfected with IRF1 and TRAIL promoter reporter for 48 h. Cells were treated with NaCl (to control for osmolality) or LiCl for 24 h prior to lysis. Data is expressed as fold luciferase induction by IRF1 over empty vector (pCDNA3.1). All reporter assay data is from three independent experiments assayed in triplicate. Error bars denote SEM and * denotes statistical significance (P < 0.05) as determined by Students t-test between NaCl and LiCl treatments. Panel below shows IRF1 expression. (B) As for (A) but treatment with vehicle (DMSO), GSK3 Inhibitor BIO or the inactive analog Methyl-BIO (1, 2.5 and 3.75 μM/1 h). (C) Reporter assays using Cos7 cells transfected with TRAIL reporter construct, pcDNA3 (vector), or IRF1 and increasing concentrations of GSK3β-HA WT or GSK3β-HA K85A mutant. (D) Reporter assays in MRC5 cells transfected with control or GSK3β siRNAs (10 nM/16 h) followed by transfection with TRAIL promoter reporter and IRF1 for 24 h. (E) Reporter assay in Cos7 cells transfected with the TRAIL or 4XISRE-Luc reporters in conjunction with IRF1 WT, T181A, S185A and T181A/S185A constructs. Statistical difference is between WT and mutant IRF1. (F) As for (E) but with T181D and S185E mutants in Cos7 and MRC5 cells.
Figure 4.
Figure 4.
T181 is required for full IRF1 transactivation of target genes. (A) IRF1 target gene mRNA expression determined by qRT-PCR. H3396-Tet-Off cells expressing empty vector (pCDNA4-TO), WT or T181A IRF1, were induced with 2 μg/ml Dox for 36 hr. TRAIL, OAS3, PSMA6 and TBC1D32 mRNA is expressed relative to β-actin. Statistical significance was determined between Dox-induced WT and T181A IRF1 expressing cells. (B) ChIP analysis performed on the cell lines from (A) using either control rabbit IgG antibody or IRF1 M20 (mouse-specific) antibody to prevent any endogenous IRF1 immunoprecipitation. Data is shown as fold enrichment between cells treated with Dox (36 h 2 μg/ml) or vehicle.
Figure 5.
Figure 5.
T181 is required for IRF1 to promote RNA Pol-II elongation on target promoters. (A) H3396 cells expressing Tet-inducible IRF1 WT or T181A were treated with vehicle or induced with Dox for 36 hr. ChIP was performed using anti-total RNA-Pol-II, or IgG antibodies (as control). QPCR was performed to detect enrichment at the TBC1D32 promoter region containing the IRF1 binding site. (B) ChIP performed as in A, but using anti-phospho-Ser2 RNA Pol-II antibody and QPCR performed using primers from within the TBC1D32 gene body to detect the elongating form of RNA-Pol-II.
Figure 6.
Figure 6.
Phosphorylation of T181/S185 by GSK3β promotes IRF1 degradation. (A) Cycloheximide (CHX) chase to detect turnover of IRF1 proteins. MRC5 cells expressing IRF1 WT or mutants were treated with CHX to prevent further protein synthesis. Whole cell extracts were prepared at the times indicated post CHX treatment and subjected to western blotting, using anti-IRF1 antibody. IRF1 expression was quantified using densitometry (ImageJ) and expressed relative to β-actin levels; untreated was set at 100%. Data is from three independent experiments performed in duplicate. Also see Supplementary Figure S3A for t-test significance. (B) Western blot of IRF1 CHX chases related to (A). (C) CHX chase in MRC5 cells expressing IRF1 and GSK3β, calculated as for (A). Error bars = s.e.m., Student's t-test shows significance between empty vector + IRF1 and GSK3β + IRF1. (D) Western blot of IRF1 and GSK3β related to (D). (E) MRC5 cells transfected with controL (siCTRL) or GSK3β siRNAs (10 nM) for 24 h followed by transfection with FLAG-IRF1 for 48 hr. Parallel siRNA transfected samples were treated with IFNγ (1000 U/ml 3 h) to induce endogenous IRF1 expression and subjected to CHX chase for indicated times. Lysates were probed with FLAG to detect exogenous IRF1 and IRF1 C20 (human specific) antibody to detect the endogenous IRF1. Error bars = s.e.m., Student's t-test shows significance between siCTRL and siGSK3β for mouse and human IRF1. (F) Western blots from (E) probed for FLAG (exogenous mouse IRF1) and human IRF1 (C20 antibody is non-cross reactive with murine IRF1), GSK3β (knockdown efficiency) and β-actin loading control.
Figure 7.
Figure 7.
GSK3β promotes IRF1 ubiquitination. (A) Ubiquitination of IRF1; HEK293 cells expressing FLAG-IRF1, and MYC-Ub were treated with MG132 (10 μM) for 6 h prior to IP for FLAG-IRF1 and probe with myc (Ub-IRF1). Input lysates were probed with anti-FLAG, anti-myc and anti-vinculin. (B) Quantification of relative levels of ubiquitination of IRF1 proteins. Data is expressed as the relative levels of the IRF1-Ub species versus the IRF1 from inputs (to account for differences in expression). Data is from three experiments. Error bars denote SEM. Significant differences were determined by Student's t-test comparing WT to each mutant. (C) HEK293 cells expressing HA-Ub, FLAG-IRF1 WT, GSK3β-HA WT and GSK3β -HA K85A were lysed 48 hr post transfection in SDS denaturing buffer, boiled and diluted 10-fold in PBS and immunoprecipitated with FLAG. The resulting high molecular weight Ub modified IRF1 was detected by HA western blot. Input panel shows expression of transfected proteins. (D) Ubiquitin immunoprecipitation of endogenous IRF1 in MRC5 lysates from cells siRNA depleted of IRF1 or GSK3β, or pre-treated with GSK3 Inhibitor BIO, or its inactive analog met-BIO (10 μM for 1 h). MG132 (10 μM for 5 h) was added prior to lysis to prevent degradation of ubiquitinated IRF1. Ub-IRF1 smears were detected by blot against human IRF1 using the C-20 antibody. Knockdown efficiencies for IRF1 and GSK3β are shown in the input panel. Control IgG immunoprecipitation is shown on the adjacent panel.
Figure 8.
Figure 8.
IRF1 phosphorylated at T181/S185 is linked to transcription and degradation. (A) HEK293 cells expressing FLAG-IRF1 with GSK3β-HA or empty vector were treated with 10 μM MG132 or DMSO for 6 hr prior to lysis. Following immunoprecipitation with anti-FLAG beads, western blots were performed using the anti-pT/S antibody and re-probed with anti-FLAG to determine total IRF1 protein, and a representative blot is shown. The ratio phospho-IRF1 to total IRF1 was quantified by densitometry, and data from three independent experiments are shown. Error bars denote SEM and * indicates P>0.05 by Students t-test. (B) Extracts from HEK293 cells expressing WT, T181A or YLP-A IRF1 proteins were separated into cytoplasmic, nuclear and chromatin fractions. Nuclear and chromatin lysates were immunoprecipitated with anti-FLAG after adjustment for IRF1 expression levels and blotted with the anti-pT/S antibody. Lower panels show expression of IRF1 mutants in fractions and GAPDH as a cytoplasmic marker and Histone H3 as a chromatin marker. (C) HEK293 cells expressing WT or T181A IRF1 were CHX chased for indicated times, lysates were prepared in 200 mM NaCl buffer (nuclear soluble) and insoluble pellets (chromatin) were further digested by incubation in 500 mM NaCl buffer supplemented with DNase I. The two separated fractions were probed for FLAG-IRF1. Panel below shows western blots related to panels above, β-actin was used as a soluble and Lamin B1 as an insoluble loading control. Statistical difference is between WT and T181A IRF1. (D) HEK293 cells expressing FLAG-IRF1 and GSK3β-HA for 48 hr were treated with DRB (1 μM/1 h) prior to lysis and immunoprecipitation with FLAG. Inputs are shown below. (E) H3396 cells were pre-treated with DRB (1 μM/1 h) to inhibit transcription prior to immunoprecipitation with pT/S and blot with IRF1 antibody.
Figure 9.
Figure 9.
Fbxw7α interacts with phosphorylated IRF1 via T181. (A) Co-immunoprecipitation of HA-Fbxw7α in extracts of HEK293 cells, and western blots using anti-HA antibody to detect associated FLAG-IRF1. Cells were treated with MG132 for 6 h prior to lysis. Blots were re-probed with anti-HA to determine IP efficiency n.s. = non-specific band is indicated. (B) Co-IP experiment as in (A) but with anti-FLAG antibody to IP and western blot with anti-HA to detect complex formation with HA-Fbxw7α or a mutant lacking the WD40 domain (HA-Fbxw7α ΔWD40). (C) HA-Fbxw7α, GSK3β-HA and FLAG-IRF1 were co-expressed in HEK293 for 48 h, 6 h prior to lysis cells were treated with 10 μM MG132. Lysates were immunoprecipitated with anti-FLAG and probed with anti-HA to detect Fbxw7α interaction. The blots were also probed with the anti-pT/S antibody and FLAG to determine relative levels of IRF1 phosphorylation. (D) Immunoprecipitations as for (B) but with the inclusion of IRF1 T181A, S185A, T181A/S185A and T181D mutants.
Figure 10.
Figure 10.
Fbxw7α regulates IRF1 ubiquitination, half-life and transcriptional activity. (A) MRC5 cells transfected with control or Fbxw7 siRNAs (10 nM) for 24 hr followed by transfection with FLAG-IRF1 for 48 hr. Parallel siRNA transfected samples were treated with IFNγ (1000U/ml 3 hr) to induce endogenous IRF1 expression and subjected to CHX chase for indicated times. Lysates were probed with FLAG to detect exogenous IRF1 and IRF1 C20 antibody to detect the endogenous IRF1. Errors bars = s.e.m., Student's t-test shows significance between siCTRL and siFbxw7 for mouse and human IRF1. (B) HEK293 cells expressing FLAG-IRF1, GSK3β-HA and 6xHis-Ub (WT or K48 only) for 48 h prior to a 6 h 10 μM MG132 treatment. Lysates were prepared in 8M urea buffer and incubated with nickel agarose to enrich His-Ub modified proteins. Pulldowns were probed with anti-FLAG to detect Ub-IRF1. 10% inputs show expression of transfected proteins. (C) Reporter assay in MRC5 cells transfected with the TRAIL promoter-Luciferase reporter. Cells were transfected with the indicated siRNAs overnight prior to transfection with reporter and IRF1 expression vector for 24 h prior to lysis. Error bar denotes SEM and * statistical significance P(>0.05) as determined by Students t-test between control and Fbxw7 siRNA treated cells. (D) Quantification of relative ubiquitination of indicated IRF1 K→R mutants. HEK293 cells expressing FLAG-IRF1, HA-Fbxw7α and 6xHis-UbWT for 48 h prior to a 6 h 10 μM MG132 treatment. Lysates were prepared in 8M urea buffer and incubated with nickel agarose to enrich His-Ub modified proteins. Pulldowns were probed with anti-FLAG to detect Ub-IRF1. Data is shown as % increase in ubiquitination between empty vector and HA-Fbxw7α expressing pulldowns. See Supplementary Figure S5D for western blot panels. (E) CHX chase of MRC5 transfected with indicated IRF1 mutants as for A). (F) Western blot related to (E). (G) Reporter assay in MRC5 cells transfected with the TRAIL promoter-Luciferase reporter. Cells were transfected with the indicated IRF1 expression vector for 48 hr prior to lysis. Error bar denotes SEM and * statistical significance P(>0.05) as determined by Student's t-test.
Figure 11.
Figure 11.
T181 is required for IRF1 anti-proliferative activity in cancer cells. (A) H3396 KRAB-Tet stable inducible cell lines expressing IRF1, T181A or vector only were plated at equal concentrations and treated with Dox or vehicle. Proliferation was monitored for 6 days using cell counting. Graph shows the average of three independent experiments performed in quadruplicate ± standard deviation. (B) Indicated cell lines were transduced with pBABE-puro, IRF1 WT or IRF1 T181A, selected with puromycin for 48 h to remove uninfected cells and plated at 500 cells/well on 48-well plates in quadruplicate. Clones were left to grow for 10 days before crystal violet staining. Representative wells are shown. (C) Cell lines transduced with retroviruses as for (B) and allowed to grow in puromycin supplemented media for 7 days prior to trypan blue counting. Viable cells were counted from triplicate wells and the % change in viable cell number was calculated relative to empty vector. *** indicates a P value less than 0.001 between groups. Abbreviations, Bl (Bladder), Lu (Lung), Br (Breast), Pa (Pancreas), Co (Colorectal), Me (Melanoma), Ov (Ovarian), Ki (Kidney). (D) Cells treated as for (C) but plated on coverslips and assayed by indirect immunofluorescence for Ki67 expression after 7 days. Cells stained with strong nucleolar Ki67 were counted as proliferative. Proliferation was measured relative to empty vector transduced cells. Negative values indicate reduction in Ki67/proliferative cells.
Figure 12.
Figure 12.
Schematic depicting a proposed model of the regulation of IRF1 activity by GSK3 kinases. 1) External stimuli (such as IFNγ signalling activate STAT1 leading to increase expression of cellular IRF1 protein. 2) Steady state levels of IRF1 protein are maintained by the Ub proteasome system. Non-DNA bound IRF1 is ubiquitinated at lysine residues exposed within the DBD. 3) Nuclear IRF1 binds recognition sequences in target promoters. In many cases such as TBC1D32 gene, these IRF1-bound promoters are marked by high levels of pSer5 (initiating) modified RNA-Pol-II and are thus poised for transcription. Engagement with DNA shields the lysines within the DBD from recognition by E3 ligases and subsequent degradation by the proteasome. This allows time for further events that are necessary for transcription to occur. 4) Transcription is initiated, RNA-Pol-II is marked with pSer2 (elongating). 5) Successful initiation triggers phosphorylation of IRF1 at T181/S185 by GSK3β. It is not known how this phosphorylation senses RNA-Poll firing, perhaps a reorganization of proteins at the promoter unmasks epitopes in IRF1 allowing binding and phosphorylation. 6) Phosphorylation of IRF1 generates a phospho-degron recognized by SCFFbxw7α, which promotes K48 linked ubiquitination of IRF1. 7) IRF1 is degraded by the proteasome. It is not known if the degradation occurs while IRF1 is bound to DNA, or if a release of IRF1 occurs beforehand. 8) The previously occupied element is now free for additional molecules of IRF1 (or other proteins) to re-bind and begin a new cycle of transcription. Local concentrations of IRF1 protein – determined by the balance between de novo generation of IRF1 and degradation will help dictate whether this additional cycle occurs.

References

    1. Tanaka N., Ishihara M., Lamphier M.S., Nozawa H., Matsuyama T., Mak T.W., Aizawa S., Tokino T., Oren M., Taniguchi T.. Cooperation of the tumour suppressors IRF-1 and p53 in response to DNA damage. Nature. 1996; 382:816–818. - PubMed
    1. Clarke N., Jimenez-Lara A.M., Voltz E., Gronemeyer H.. Tumor suppressor IRF-1 mediates retinoid and interferon anticancer signaling to death ligand TRAIL. EMBO J. 2004; 23:3051–3060. - PMC - PubMed
    1. Savitsky D., Tamura T., Yanai H., Taniguchi T.. Regulation of immunity and oncogenesis by the IRF transcription factor family. Cancer Immunol. Immunother. 2010; 59:489–510. - PMC - PubMed
    1. Alsamman K., El-Masry O.S.. Interferon regulatory factor 1 inactivation in human cancer. Biosci. Rep. 2018; 38:BSR20171672. - PMC - PubMed
    1. Frontini M., Vijayakumar M., Garvin A., Clarke N.. A ChIPchip approach reveals a novel role for transcription factor IRF1 in the DNA damage response. Nucleic Acids Res. 2009; 37:1073–1085. - PMC - PubMed

Publication types

MeSH terms

Substances