

Pitfalls of using the risk ratio in meta-analysis
- PMID: 30854785
- PMCID: PMC6767076
- DOI: 10.1002/jrsm.1347
Pitfalls of using the risk ratio in meta-analysis
Abstract
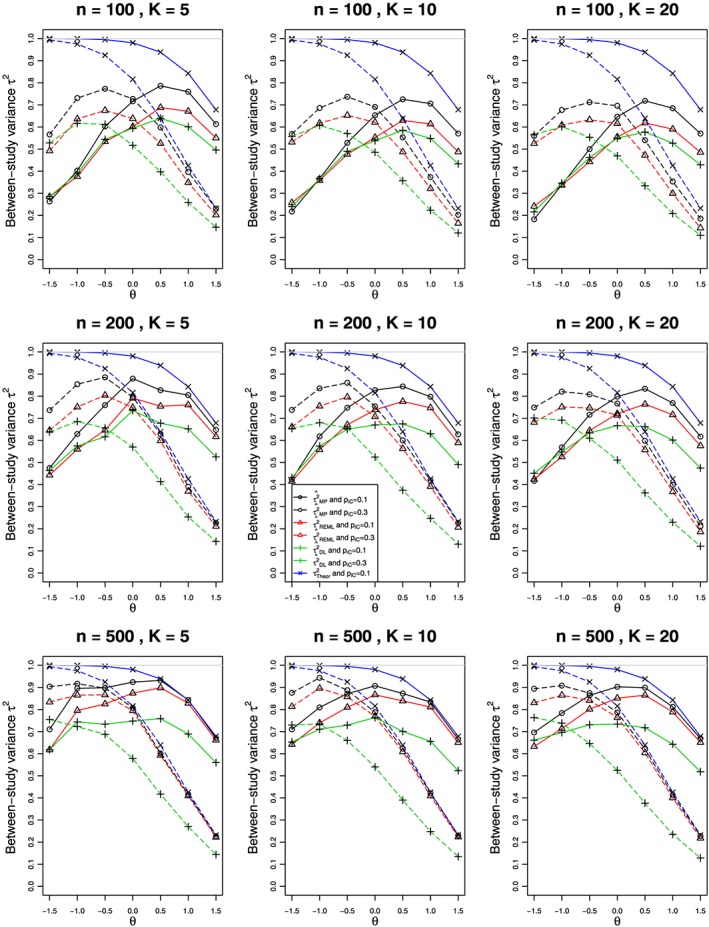
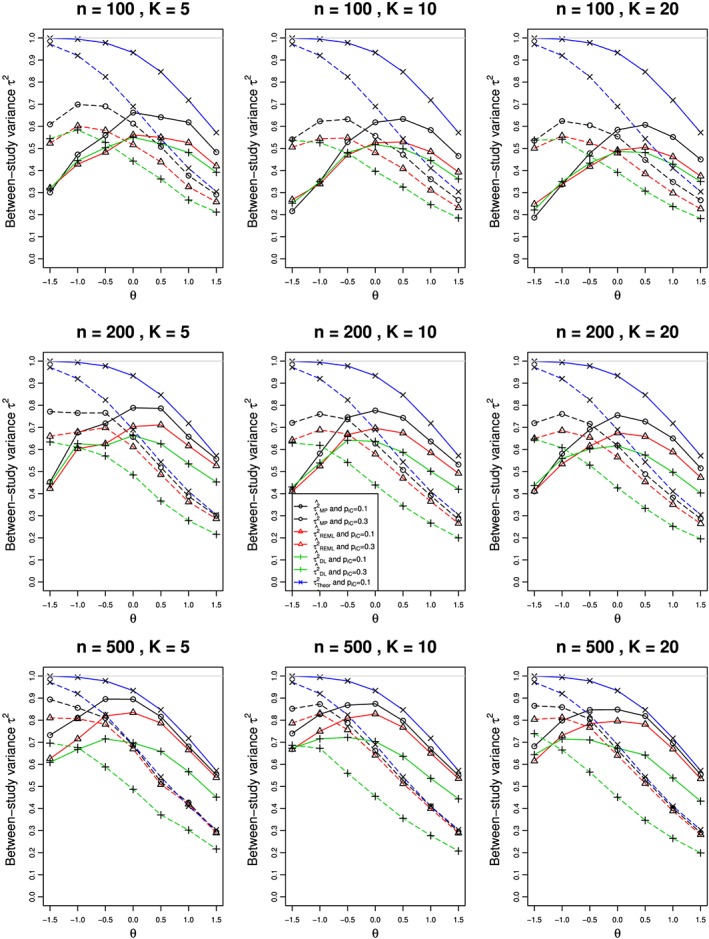
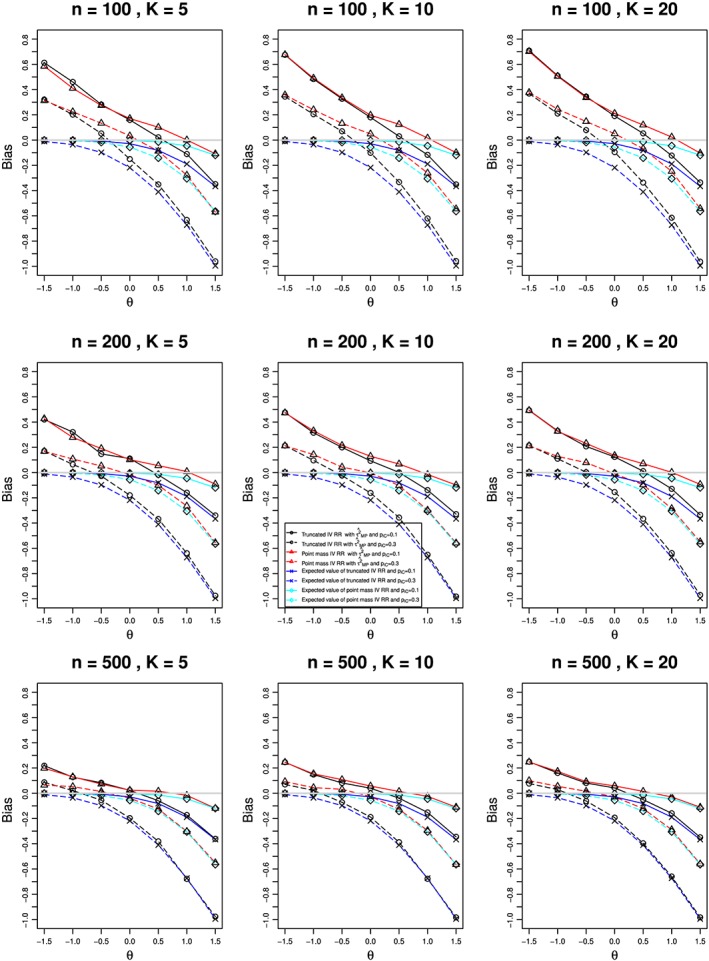
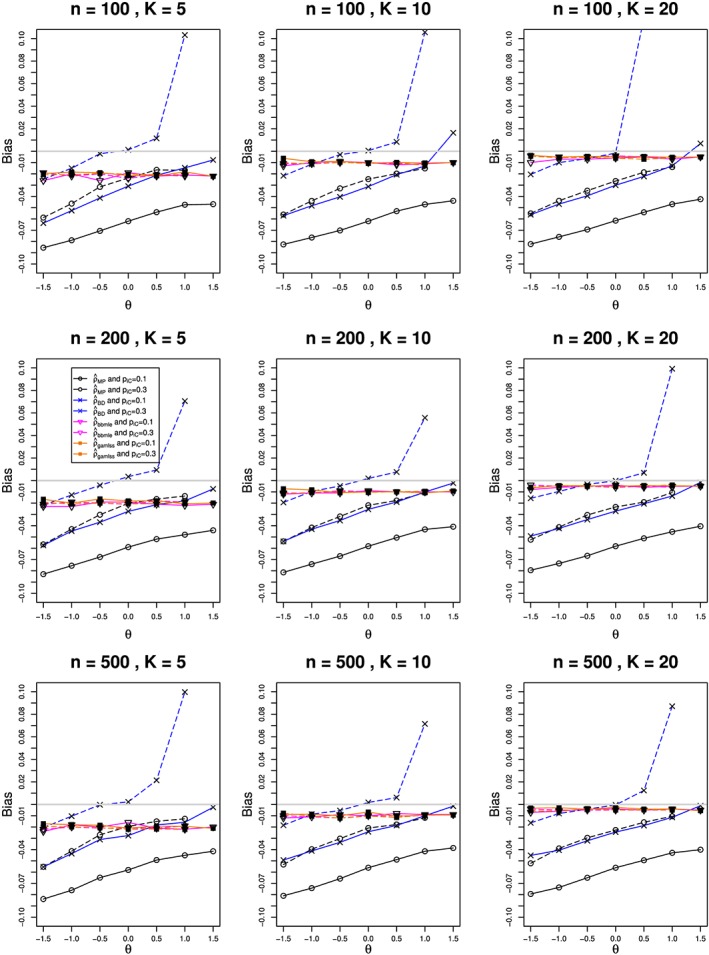
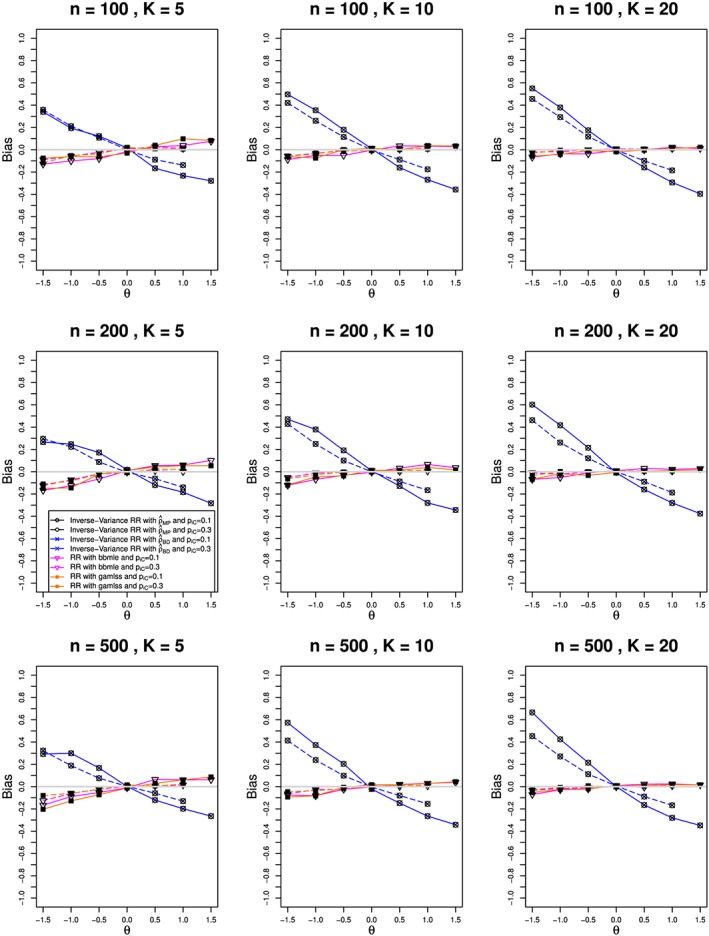
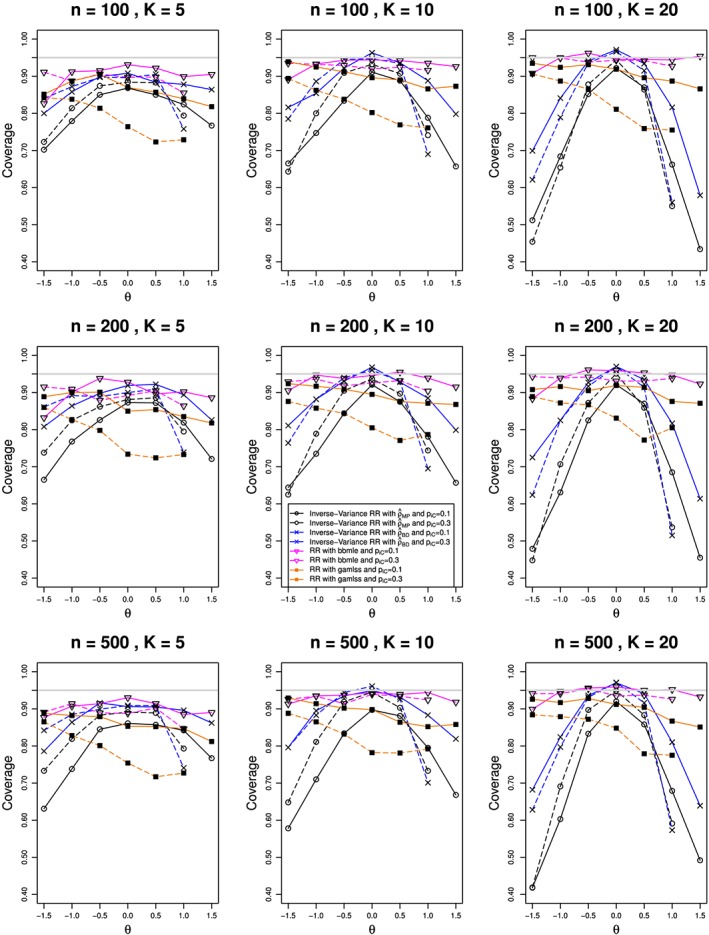
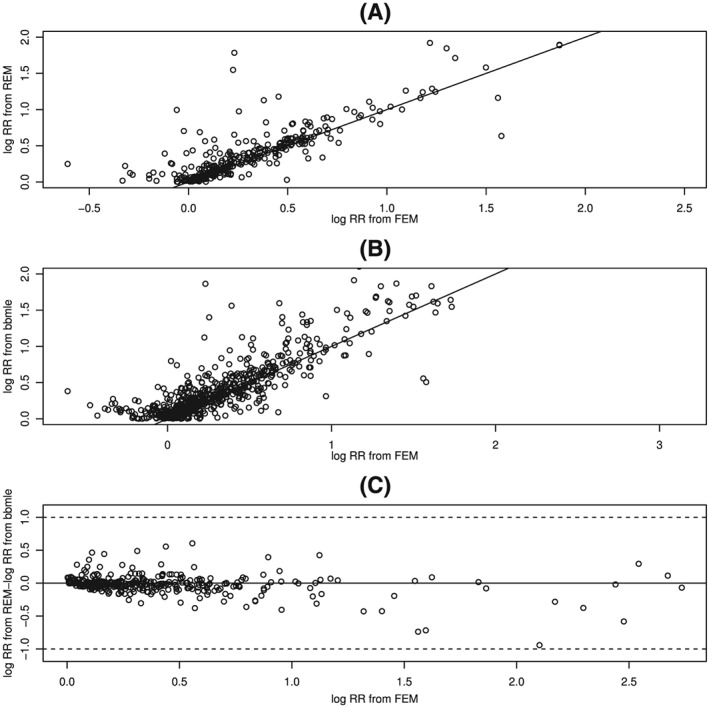
For meta-analysis of studies that report outcomes as binomial proportions, the most popular measure of effect is the odds ratio (OR), usually analyzed as log(OR). Many meta-analyses use the risk ratio (RR) and its logarithm because of its simpler interpretation. Although log(OR) and log(RR) are both unbounded, use of log(RR) must ensure that estimates are compatible with study-level event rates in the interval (0, 1). These complications pose a particular challenge for random-effects models, both in applications and in generating data for simulations. As background, we review the conventional random-effects model and then binomial generalized linear mixed models (GLMMs) with the logit link function, which do not have these complications. We then focus on log-binomial models and explore implications of using them; theoretical calculations and simulation show evidence of biases. The main competitors to the binomial GLMMs use the beta-binomial (BB) distribution, either in BB regression or by maximizing a BB likelihood; a simulation produces mixed results. Two examples and an examination of Cochrane meta-analyses that used RR suggest bias in the results from the conventional inverse-variance-weighted approach. Finally, we comment on other measures of effect that have range restrictions, including risk difference, and outline further research.
Keywords: beta-binomial model; log-binomial model; relative risk; response ratio; risk difference.
© 2019 The Authors Research Synthesis Methods Published by John Wiley & Sons Ltd.
Conflict of interest statement
The author reported no conflict of interest.
Figures
Similar articles
-
Methods for estimating between-study variance and overall effect in meta-analysis of odds ratios.Res Synth Methods. 2020 May;11(3):426-442. doi: 10.1002/jrsm.1404. Epub 2020 Apr 13. Res Synth Methods. 2020. PMID: 32112619
-
Meta-analysis of binary outcomes via generalized linear mixed models: a simulation study.BMC Med Res Methodol. 2018 Jul 4;18(1):70. doi: 10.1186/s12874-018-0531-9. BMC Med Res Methodol. 2018. PMID: 29973146 Free PMC article.
-
Random-effects meta-analysis models for the odds ratio in the case of rare events under different data-generating models: A simulation study.Biom J. 2023 Mar;65(3):e2200132. doi: 10.1002/bimj.202200132. Epub 2022 Oct 10. Biom J. 2023. PMID: 36216590
-
Efficacy and Adverse Effects of Tranylcypromine and Tricyclic Antidepressants in the Treatment of Depression: A Systematic Review and Comprehensive Meta-analysis.J Clin Psychopharmacol. 2020 Jan/Feb;40(1):63-74. doi: 10.1097/JCP.0000000000001153. J Clin Psychopharmacol. 2020. PMID: 31834088
-
Probiotics for preventing gestational diabetes.Cochrane Database Syst Rev. 2021 Apr 19;4(4):CD009951. doi: 10.1002/14651858.CD009951.pub3. Cochrane Database Syst Rev. 2021. PMID: 33870484 Free PMC article.
Cited by
-
Comparisons of various estimates of the statistic for quantifying between-study heterogeneity in meta-analysis.Stat Methods Med Res. 2024 May;33(5):745-764. doi: 10.1177/09622802241231496. Epub 2024 Mar 19. Stat Methods Med Res. 2024. PMID: 38502022 Free PMC article.
-
On the Q statistic with constant weights in meta-analysis of binary outcomes.BMC Med Res Methodol. 2023 Jun 21;23(1):146. doi: 10.1186/s12874-023-01939-z. BMC Med Res Methodol. 2023. PMID: 37344771 Free PMC article.
-
Trace amine-associated receptor 1 (TAAR1) agonists for psychosis: protocol for a living systematic review and meta-analysis of human and non-human studies.Wellcome Open Res. 2023 Aug 25;8:365. doi: 10.12688/wellcomeopenres.19866.1. eCollection 2023. Wellcome Open Res. 2023. PMID: 38634067 Free PMC article.
-
Safety and efficacy of remifentanil in patients undergoing bariatric and metabolic surgeries - A systematic review.Indian J Anaesth. 2025 Jan;69(1):123-131. doi: 10.4103/ija.ija_825_24. Epub 2025 Jan 11. Indian J Anaesth. 2025. PMID: 40046714 Free PMC article.
-
Vitamin D supplementation to prevent acute respiratory infections: systematic review and meta-analysis of stratified aggregate data.Lancet Diabetes Endocrinol. 2025 Apr;13(4):307-320. doi: 10.1016/S2213-8587(24)00348-6. Epub 2025 Feb 21. Lancet Diabetes Endocrinol. 2025. PMID: 39993397 Free PMC article.
References
-
- Fleiss JL, Levin B, Paik MC. Statistical Methods for Rates and Proportions. 3rd ed. Hoboken, NJ: John Wiley & Sons; 2003.
-
- Cornfield J. A method of estimating comparative rates from clinical data: application to cancer of the lung, breast and cervix. J Natl Cancer Inst. 1951;11:1269‐1275. - PubMed
-
- Jewell NP. Statistics for Epidemiology. Boca‐Raton: Chapman & Hall/CRC; 2004.
-
- Sinclair JC, Bracken MB. Clinically useful measures of effect in binary analyses of randomized trials. J Clin Epidemiol. 1994;47(8):881‐889. - PubMed
-
- Sackett DL, Deeks JJ, Altman DG. Down with odds ratios! Evid Based Med. 1996;1(6):164‐166.
MeSH terms
Substances
Grants and funding
LinkOut - more resources
Full Text Sources
Medical
Research Materials
