. 2019 Mar 11;129(4):1699-1712.
doi: 10.1172/JCI124196.

Human colon mucosal biofilms from healthy or colon cancer hosts are carcinogenic

Affiliations

Human colon mucosal biofilms from healthy or colon cancer hosts are carcinogenic

Sarah Tomkovich et al. J Clin Invest. .

Abstract

Mucus-invasive bacterial biofilms are identified on the colon mucosa of approximately 50% of colorectal cancer (CRC) patients and approximately 13% of healthy subjects. Here, we test the hypothesis that human colon biofilms comprise microbial communities that are carcinogenic in CRC mouse models. Homogenates of human biofilm-positive colon mucosa were prepared from tumor patients (tumor and paired normal tissues from surgical resections) or biofilm-positive biopsies from healthy individuals undergoing screening colonoscopy; homogenates of biofilm-negative colon biopsies from healthy individuals undergoing screening colonoscopy served as controls. After 12 weeks, biofilm-positive, but not biofilm-negative, human colon mucosal homogenates induced colon tumor formation in 3 mouse colon tumor models (germ-free ApcMinΔ850/+;Il10-/- or ApcMinΔ850/+ and specific pathogen-free ApcMinΔ716/+ mice). Remarkably, biofilm-positive communities from healthy colonoscopy biopsies induced colon inflammation and tumors similarly to biofilm-positive tumor tissues. By 1 week, biofilm-positive human tumor homogenates, but not healthy biopsies, displayed consistent bacterial mucus invasion and biofilm formation in mouse colons. 16S rRNA gene sequencing and RNA-Seq analyses identified compositional and functional microbiota differences between mice colonized with biofilm-positive and biofilm-negative communities. These results suggest human colon mucosal biofilms, whether from tumor hosts or healthy individuals undergoing screening colonoscopy, are carcinogenic in murine models of CRC.

Keywords: Bacterial infections; Colorectal cancer; Microbiology; Mouse models; Oncology.


Conflict of interest statement

Conflict of interest: CLS reports research support from Bristol Myers Squibb.

Figures

Figure 1
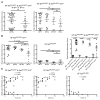
Figure 1. Biofilm-positive human colon tissue inocula are carcinogenic in mouse models.
(A and B) Colon tumor counts in GF (A) ApcMinΔ850/+;Il10–/– and ApcMinΔ850/+ and SPF (B) ApcMinΔ716/+ mice inoculated with biofilm-positive (BF+) human colon mucosal tissues or biofilm-negative (BF-bx) human colon mucosal tissues. n = 42 BF+ and n = 12 BF ApcMinΔ850/+;Il10–/– and ApcMinΔ850/+ mice. Black circles represent mice analyzed 12 weeks after inoculation. White circles represent mice harvested 13–20 weeks after inoculation (n = 9 mice). n = 33 BF+ and n = 9 BF for SPF ApcMinΔ716/+ mice. (C and D) Colon tumor counts in GF (C) ApcMinΔ850/+;Il10–/– and ApcMinΔ850/+ and SPF (D) ApcMinΔ716/+ mice inoculated with BF+ human mucosal tissues. For ApcMinΔ850/+;Il10–/– and ApcMinΔ850/+ mice, tumor counts from mice inoculated with BF+ human tumor (CRC patients) (BF+T, n = 25 mice), BF+ normal flanking tissues from CRC patients (BF+NF, n = 8 mice), BF+ colonoscopy mucosal biopsies from healthy subjects (BF+bx, n = 9 mice), and BF colonoscopy mucosal biopsies from healthy subjects (BF-bx, n = 12 mice) are displayed. For SPF ApcMinΔ716/+ mice, n = 12 (BF+T); n = 8 (BF+NF); n = 13 (BF+bx); n = 9 (BF-bx). BF+ conditions do not differ statistically from each other. (E) Survival curve of BF-bx and BF+T reassociated GF ApcMinΔ850/+;Il10–/– mice over 12 weeks, analyzed by log-rank (Mantel-Cox) test and the log-rank test for trend (n = 9 mice per group). Inoculums for reassociation experiments were homogenates of proximal (PC) or distal colon (DC) tissues of mice associated with microbes from human BF-bx or BF+T mucosal tissues (see Methods). (F) Colon tumor counts in reassociated GF ApcMinΔ850/+;Il10–/– mice. n = 9 (BF-bx distal colon); n = 7 (BF+T PC); n = 5 (BF+T distal colon), since some BF+T reassociated mice did not survive to the 12-week end point. For AD and F, data are displayed as mean ± SEM analyzed by Mann-Whitney U test. For C, D, and F, P < 0.0167 is considered statistically significant, based on Bonferroni’s correction for multiple comparisons.
Figure 2
Figure 2. Histopathology of colon tumors from mice associated with human biofilm-positive mucosal tissues.
(A) GF ApcMinΔ850/+;Il10–/– inoculated with human BF+T tissue homogenate develop carcinoma with submucosal invasion after 16 (left panels) or 20 (right panels) weeks. Original magnification, ×50; scale bar: 250 μm (upper panels). Bottom panels represent insets of top panel boxed areas demonstrating invasive adenocarcinoma. Original magnification, ×200; scale bar: 75 μm. In addition to high-grade glandular dysplasia in the mucosa, there were infiltrative glands in the submucosa (asterisks). These submucosal glands also displayed desmoplastic stromal changes (arrows). The overall features were diagnostic of invasive adenocarcinoma. (B) Colon histopathology of SPF ApcMinΔ716/+ mouse inoculated with BF+bx (top panel) or BF-bx (bottom panel) for 3 weeks. Top panel displays a large tumor with multifocal dysplasia and a region of intramucosal adenocarcinoma (inset). Original magnification, ×4; scale bars: 1 mm (upper panel). Original magnification, ×20; scale bars: 0.1 mm (lower panel).
Figure 3
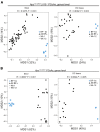
Figure 3. Colon inflammation induced by BF+ and BF human colon mucosal tissue inocula in GF ApcMinΔ850/+;Il10–/– and ApcMinΔ850/+ mouse models.
(A) Distal colon inflammation scoring (see Methods) for GF ApcMinΔ850/+;Il10–/– and ApcMinΔ850/+ mice inoculated with BF+ or BF human colon mucosal tissues. Both panels show BF human colonoscopy biopsies (BF-bx, n = 12 mice are shown). In the left panel, 3 BF+ groups (BF+bx, BF+NF, and BF+T) are combined into 1 group (BF+, n = 42 mice), and in the right panel, BF+ colon tumor (BF+T, n = 25 mice), BF+ normal flanking tissue from CRC patients (BF+NF, n = 8 mice), and BF+ colonoscopy biopsies from healthy subjects (BF+bx, n = 9 mice) are shown separately. Data displayed as mean ± SEM analyzed by Mann-Whitney U test. (B) Distal colon inflammation scoring analyzed by mouse genotype for GF ApcMinΔ850/+;Il10–/– and ApcMinΔ850/+ mice inoculated with BF+ or BF human colon mucosal tissues. Distal colon inflammation is displayed for inoculated ApcMinΔ850/+;Il10–/– mice (left panel) and ApcMinΔ850/+ (middle panel) only and is compared across the ApcMinΔ850/+;Il10–/– and ApcMinΔ850/+ mice genotypes (right panel). Data are displayed as mean ± SEM and were analyzed by Mann-Whitney U test. For the left panel, P < 0.0167 was considered statistically significant using Bonferroni’s correction. (C) Analysis of correlation between distal colon inflammation score and tumor numbers in ApcMinΔ850/+;Il10–/– and ApcMinΔ850/+ mice inoculated with BF+ or BF human colon mucosal tissues. Both mouse genotypes (left panel); ApcMinΔ850/+;Il10–/– mice only (middle panel); ApcMinΔ850/+ mice only (right panel). Colon tumor induction is increased in BF+ tissue types and correlates with distal colon inflammation only in ApcMinΔ850/+;Il10–/– mice (middle panel). Black circles represent mice analyzed at 12 weeks after inoculation. White circles represent mice harvested at 13–20 weeks after inoculation (n = 9 mice). Analyzed by Spearman’s rank order correlation.
Figure 4
Figure 4. Human BF+ colon tissue inocula induce colon inflammation in GF mouse models after 1 week.
(AC) Myeloid (A) and lymphoid (B and C) lamina propria immune cell infiltrates plotted as number of live cells per colon in GF C57BL/6 at 7 days after inoculation with slurries from biofilm-negative colon biopsies (BF-bx, red circles; n = 4), biofilm-positive colon biopsies (BF+bx, green squares; n = 4), or biofilm-positive colon tumors (BF+ T, blue triangles; n = 4). In C, number of IFN-γ+–producing (left graph) and IL-17+–producing (right graph) cells per colon were determined by intracellular staining and flow cytometry analysis. Overall significance across cell types was calculated using 2-way ANOVA with multi-comparison correction (Tukey’s test). (DF) Myeloid (D) and lymphoid (E and F) lamina propria immune cell infiltrates plotted as number of live cells per colon in GF ApcMinΔ850/– mice at 7 days after inoculation with buffer (sham control, black triangles; n = 2) or slurries from biofilm-negative colon biopsies (BF-bx, red circles, n = 2) or biofilm-positive colon tumors (BF+T, blue squares; n = 3). In F, number of IFN-γ+–producing (left graph) and IL-17+–producing (right graph) cells per colon were determined by intracellular staining and flow cytometry analysis. Overall significance across cell types was calculated using 2-way ANOVA with multi-comparison correction (Tukey’s test). Data are presented as mean ± SEM.
Figure 5
Figure 5. Human BF+ colon tissue inocula induce colon biofilms in mouse models.
(A) GF ApcMinΔ850/+;Il10–/– and ApcMinΔ850/+ mice 12 weeks after inoculation with BF+ human colon mucosal tissue inocula display distal colon biofilm formation except the BF+T–inoculated ApcMinΔ850/+;Il10–/– mouse. BF+T, BF+ colon tumor; BF+NF, BF+ normal flanking tissue from CRC patients; BF+bx, BF+ colonoscopy biopsy from healthy subjects. n = 1 mouse per genotype and per human tissue inoculum. Tissues analyzed by multiprobe FISH (see Methods) and counterstained with the nuclear stain DAPI (blue). Corresponding PAS stains are shown in Supplemental Figure 5. Scale bar: 100 μm. (B) Image from GF ApcMinΔ850/+;Il10–/– mouse demonstrating tissue bacterial invasion (arrows). Scale bars: 10 μm. (C) Two GF ApcMinΔ850/+;Il10–/– mice inoculated with BF colonoscopy biopsies from healthy subjects (BF-bx). Scale bar: 100 μm. Tissues analyzed by multiprobe FISH (see Methods).
Figure 6
Figure 6. Human BF+ tumor tissue inocula induce rapid formation of colon biofilms in mice.
(A) Biofilm analysis of distal colon of GF C57BL/6 mice inoculated for 1 week with BF or BF+ human colonoscopy biopsy inocula or human colon mucosal BF+T inoculum. Representative images from n = 3 (sham); n = 8 (BF-bx); n = 6 (BF+bx); n = 5 (BF+T). Top panels, FISH staining using all bacterial probe (red fluorescence, see Methods); bottom panels, PAS-stained sections show mucus staining. The inner mucus layer is outlined in yellow dashed lines in upper and lower panels. Only the human BF+T inoculum consistently induced robust bacterial invasion in the inner mucus layer (biofilm formation) of the distal mouse colon by 1 week. Scale bar: 100 μm. (B) Quantification of murine (C57BL/6) distal colon bacterial/epithelial cell contact from Figure 6A. Data are displayed as mean ± SEM and were analyzed by Mann-Whitney U test. P < 0.025 was considered significant with Bonferroni’s correction. Shams are presented for completeness, but were not included in the statistical analysis.
Figure 7
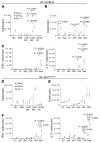
Figure 7. Human colon tissue biofilm status is associated with distinct microbiota changes in GF ApcMinΔ850/+;Il10–/– and ApcMinΔ850/+ mouse models after gavage.
(A and B) Genus level PCoAs of ApcMinΔ850/+;Il10–/– stool and distal colon tissue microbiota (A) and ApcMinΔ850/+mouse stool and distal colon tissue microbiota (B). The 3 BF+ groups (BF+bx, BF+NF, and BF+T) are combined into 1 group denoted BF+. Numbers in parentheses indicate the percentage of variation explained by that axis. The different symbols represent the 1-week (squares) and 12-week (circles) time points for the stool samples.
Figure 8
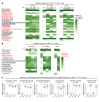
Figure 8. Human colon tissue biofilm status is associated with distinct microbiota genera in GF ApcMinΔ850/+;Il10–/– and ApcMinΔ850/+ mouse models after gavage.
(A and B) Heatmaps depicting mean log10 normalized relative abundances of all genera that were significantly different according to biofilm status in either the stool (red font), distal colon tissue (blue font), or both compartments (black font) of ApcMinΔ850/+;Il10–/– mice (A) and ApcMinΔ850/+ mice (B). The 11 genera common to both genotypes are underlined. Corresponding log10 normalized relative abundances of each inoculum are shown for comparison. (C) Box plots of the mean log10 normalized relative abundances of individual genera in ApcMinΔ850/+;Il10–/– stool that were significantly different in both the stool and distal colon compartments in both genotypes. All P values are Benjamini-Hochberg adjusted.

Comment in

References

    1. Sears CL, Garrett WS. Microbes, microbiota, and colon cancer. Cell Host Microbe. 2014;15(3):317–328. doi: 10.1016/j.chom.2014.02.007. - DOI - PMC - PubMed
    1. Tjalsma H, Boleij A, Marchesi JR, Dutilh BE. A bacterial driver-passenger model for colorectal cancer: beyond the usual suspects. Nat Rev Microbiol. 2012;10(8):575–582. doi: 10.1038/nrmicro2819. - DOI - PubMed
    1. Schwabe RF, Jobin C. The microbiome and cancer. Nat Rev Cancer. 2013;13(11):800–812. doi: 10.1038/nrc3610. - DOI - PMC - PubMed
    1. Wu S, et al. A human colonic commensal promotes colon tumorigenesis via activation of T helper type 17 T cell responses. Nat Med. 2009;15(9):1016–1022. doi: 10.1038/nm.2015. - DOI - PMC - PubMed
    1. Arthur JC, et al. Intestinal inflammation targets cancer-inducing activity of the microbiota. Science. 2012;338(6103):120–123. doi: 10.1126/science.1224820. - DOI - PMC - PubMed

Publication types