. 2019 Mar 11;15(3):e1006840.
doi: 10.1371/journal.pcbi.1006840. eCollection 2019 Mar.

Modeling differentiation-state transitions linked to therapeutic escape in triple-negative breast cancer

Affiliations

Modeling differentiation-state transitions linked to therapeutic escape in triple-negative breast cancer

Margaret P Chapman et al. PLoS Comput Biol. .

Erratum in

Abstract

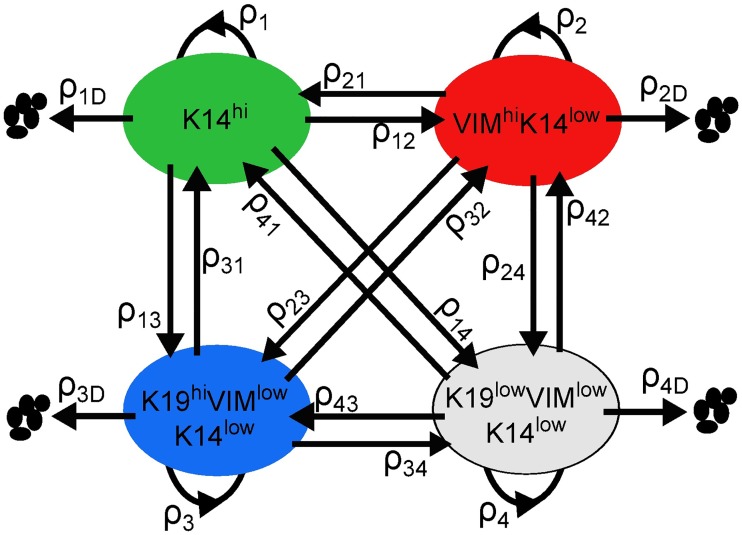
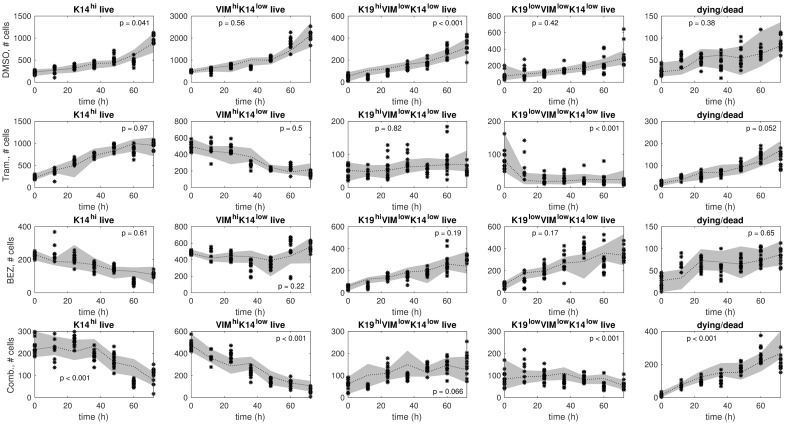
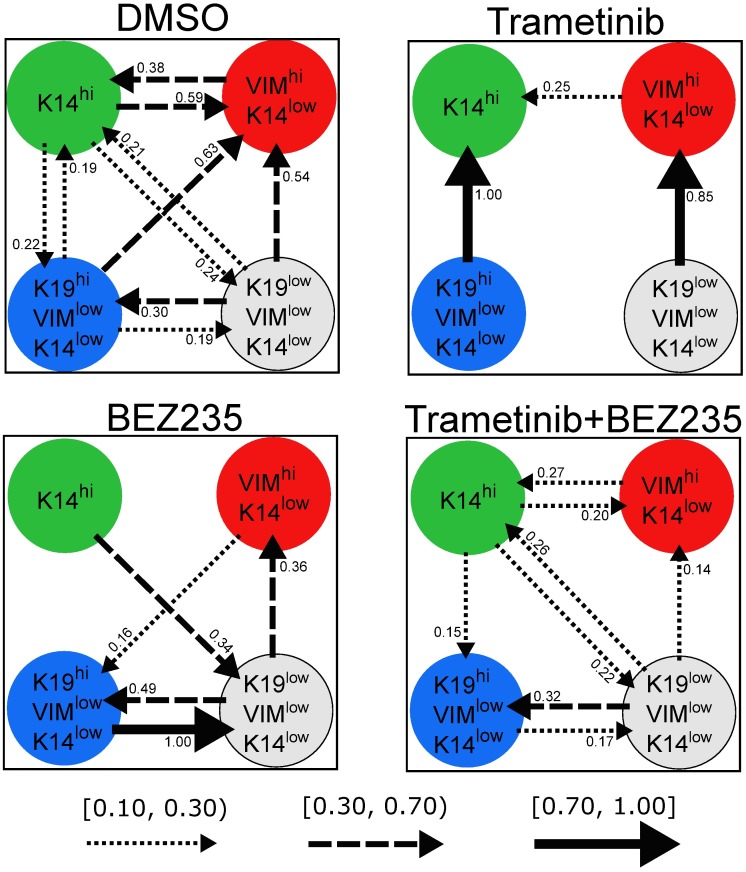
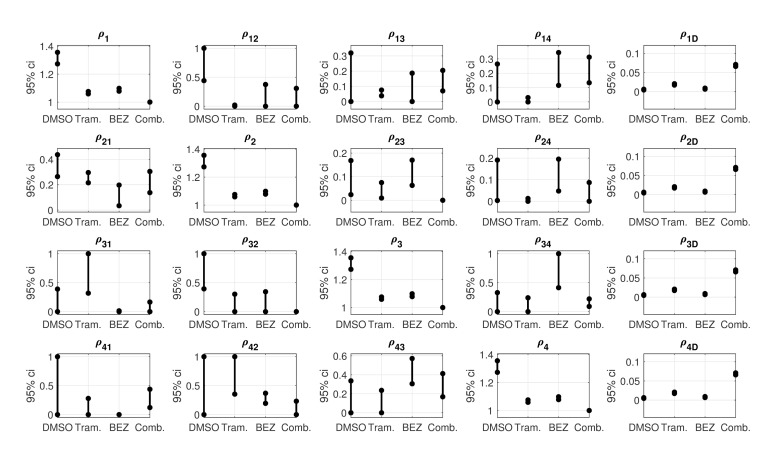
Drug resistance in breast cancer cell populations has been shown to arise through phenotypic transition of cancer cells to a drug-tolerant state, for example through epithelial-to-mesenchymal transition or transition to a cancer stem cell state. However, many breast tumors are a heterogeneous mixture of cell types with numerous epigenetic states in addition to stem-like and mesenchymal phenotypes, and the dynamic behavior of this heterogeneous mixture in response to drug treatment is not well-understood. Recently, we showed that plasticity between differentiation states, as identified with intracellular markers such as cytokeratins, is linked to resistance to specific targeted therapeutics. Understanding the dynamics of differentiation-state transitions in this context could facilitate the development of more effective treatments for cancers that exhibit phenotypic heterogeneity and plasticity. In this work, we develop computational models of a drug-treated, phenotypically heterogeneous triple-negative breast cancer (TNBC) cell line to elucidate the feasibility of differentiation-state transition as a mechanism for therapeutic escape in this tumor subtype. Specifically, we use modeling to predict the changes in differentiation-state transitions that underlie specific therapy-induced changes in differentiation-state marker expression that we recently observed in the HCC1143 cell line. We report several statistically significant therapy-induced changes in transition rates between basal, luminal, mesenchymal, and non-basal/non-luminal/non-mesenchymal differentiation states in HCC1143 cell populations. Moreover, we validate model predictions on cell division and cell death empirically, and we test our models on an independent data set. Overall, we demonstrate that changes in differentiation-state transition rates induced by targeted therapy can provoke distinct differentiation-state aggregations of drug-resistant cells, which may be fundamental to the design of improved therapeutic regimens for cancers with phenotypic heterogeneity.


Conflict of interest statement

The authors have declared that no competing interests exist.

Figures

Fig 1
Fig 1. Drug-specific model.
Live cells occupy four differentiation states and can transition, divide, or die. The dynamics parameters {ρij, ρi, ρiD}ij are the average rates of these actions taken by live cells in each differentiation state following treatment.
Fig 2
Fig 2. Ensemble model predictions in comparison to training data.
The training samples (black stars) and predictions by the model ensemble (gray bands) are shown for each treatment condition: DMSO (row 1), Trametinib (row 2), BEZ235 (row 3), and Trametinib+BEZ235 (row 4). The model ensemble is a collection of models that were identified from the training data via resampling residuals bootstrap [30] for each treatment condition. In each plot, we show a 95% confidence interval (gray band) around the median (black dotted line) of the ensemble model predictions. Higher p-values indicate better consistency between predictions and training data over the time horizon (12h, 24h, …, 72h).
Fig 3
Fig 3. Drug-specific transition gains.
For each treatment condition, values of the transition gains from the AM-optimized dynamics matrix are shown (units: #cellsat(k+1)multiplesof12hours#cellsatkmultiplesof12hours). Each transition gain from differentiation state i to differentiation state j of sufficient magnitude (ρij ≥ 0.10) is depicted as an arrow directed from i to j. Arrow style specifies gain magnitude. A dotted arrow means ρij ∈ [0.10, 0.30), a dashed arrow means ρij ∈ [0.30, 0.70), and a solid arrow means ρij ∈ [0.70, 1.00].
Fig 4
Fig 4. Uncertainty analysis of the dynamics parameters.
For each treatment condition, 95% confidence intervals computed from the model ensemble are shown. These intervals indicate variations of the dynamics parameters due to measurement noise. Non-overlapping intervals of a given parameter specify a statistically significant difference. For example, a statistically significant reduction in K14hi-to-VIMhiK14low transition was detected under Trametinib versus DMSO because the ρ12-interval for Trametinib is strictly below the ρ12-interval for DMSO. A p-value for each dynamics parameter is also provided in S2 Appendix.
Fig 5
Fig 5. Further investigations of Trametinib-induced K14hi enrichment hypothesis and Trametinib+BEZ235-induced VIMhiK14low de-enrichment hypothesis.
Top left: Trametinib K14hi live cell predictions by the AM-optimized dynamics matrix (pink band) are shown in comparison to test data (black stars). Top right: Trametinib K14hi live cell predictions by a dynamics matrix identified with additional constraints (pink band) in comparison to test data (black stars). The additional constraints are ρ12 ≥ 0.59, the value of ρ12 for DMSO, and ρ31 ≤ 0.19, the value of ρ31 for DMSO. (ρ12 is the K14hi-to-VIMhiK14low transition gain, and ρ31 is the K19hiVIMlowK14low-to-K14hi transition gain). Bottom left: Trametinib+BEZ235 VIMhiK14low live cell predictions by the AM-optimized dynamics matrix (pink band) are shown in comparison to test data (black stars). Bottom right: Trametinib+BEZ235 VIMhiK14low live cell predictions by a dynamics matrix identified with additional constraints (pink band) are shown in comparison to test data (black stars). In this setting, the additional constraints are ρ12 ≥ 0.59, the value of ρ12 for DMSO, and ρ32 ≥ 0.63, the value of ρ32 for DMSO. (ρ12 is the K14hi-to-VIMhiK14low transition gain, and ρ32 is the K19hiVIMlowK14low-to-VIMhiK14low transition gain). In each plot, the pink band extends between the maximum prediction and the minimum prediction out of four predictions in total at each time point (0h, 12h, …, 72h). The dotted line indicates the median of the predictions. Higher p-values indicate better consistency between predictions and test data over the time horizon (12h, 24h, …, 60h).
Fig 6
Fig 6. Death time series data for model training.
The YO-PRO-1 dye was used to quantify the proportion of dying cells every 12h in response to drug treatment [18]. The cells were treated with DMSO (baseline), 1μM Trametinib, 1μM BEZ235, or the combination of 1μM Trametinib + 1μM BEZ235.
Fig 7
Fig 7. Differentiation-state time series portion of the test data.
The sample mean and the sample standard deviation of fold change for each differentiation state are shown at each time point, computed from 4 samples. Fold change is fractiondifferentiationstatei,wellw,timek,therapyaveragefractiondifferentiationstatei,timek,DMSO, where fraction differentiation state i is the number of cells counted in that state divided by the population total.
Fig 8
Fig 8. Ensemble model predictions in comparison to test data.
The test samples (black stars) and ensemble model predictions (gray bands) are shown for each treatment condition: DMSO (row 1), Trametinib (row 2), BEZ235 (row 3), and Trametinib+BEZ235 (row 4). The model ensemble is a collection of models that were identified from the training data via resampling residuals bootstrap [30] for each treatment condition. In each plot, we show a 95% confidence interval (gray band) around the median (black dotted line) of the ensemble model predictions. Higher p-values indicate better consistency between predictions and test data over the time horizon (12h, 24h, …, 60h).
Fig 9
Fig 9. Single model predictions in comparison to test data, where the differentiation states are defined by K14 only.
The test samples (black stars) and single model predictions (pink bands) are shown for each treatment condition: DMSO (row 1), Trametinib (row 2), BEZ235 (row 3), and Trametinib+BEZ235 (row 4). The single model was identified on the training data using K14hi and K14low as the differentiation states for each treatment condition. The pink band extends between the maximum prediction and the minimum prediction out of four predictions in total at each time point (0h, 12h, …, 72h). The dotted line indicates the median of the predictions. Higher p-values indicate better consistency between predictions and test data over the time horizon (12h, 24h, …, 60h).

References

    1. Stratton MR, Campbell PJ, Futreal PA. The cancer genome. Nature. 2009;458(7239):719–724. 10.1038/nature07943 - DOI - PMC - PubMed
    1. Vogelstein B, Papadopoulos N, Velculescu VE, Zhou S, Diaz LA, Kinzler KW. Cancer Genome Landscapes. Science. 2013;339(6127):1546–1558. 10.1126/science.1235122 - DOI - PMC - PubMed
    1. Meacham CE, Morrison SJ. Tumour heterogeneity and cancer cell plasticity. Nature. 2013;501(7467):328–337. 10.1038/nature12624 - DOI - PMC - PubMed
    1. Easwaran H, Tsai HC, Baylin SB. Cancer Epigenetics: Tumor Heterogeneity, Plasticity of Stem-like States, and Drug Resistance. Molecular Cell. 2014;54(5):716–727. 10.1016/j.molcel.2014.05.015 - DOI - PMC - PubMed
    1. Sharma SV, Lee DY, Li B, Quinlan MP, Takahashi F, Maheswaran S, et al. A chromatin-mediated reversible drug-tolerant state in cancer cell subpopulations. Cell. 2010;141(1):69–80. 10.1016/j.cell.2010.02.027 - DOI - PMC - PubMed

Publication types

MeSH terms