. 2019 Mar 11;15(3):e1006895.
doi: 10.1371/journal.pcbi.1006895. eCollection 2019 Mar.

Latent goal models for dynamic strategic interaction

Affiliations

Latent goal models for dynamic strategic interaction

Shariq N Iqbal et al. PLoS Comput Biol. .

Abstract

Understanding the principles by which agents interact with both complex environments and each other is a key goal of decision neuroscience. However, most previous studies have used experimental paradigms in which choices are discrete (and few), play is static, and optimal solutions are known. Yet in natural environments, interactions between agents typically involve continuous action spaces, ongoing dynamics, and no known optimal solution. Here, we seek to bridge this divide by using a "penalty shot" task in which pairs of monkeys competed against each other in a competitive, real-time video game. We modeled monkeys' strategies as driven by stochastically evolving goals, onscreen positions that served as set points for a control model that produced observed joystick movements. We fit this goal-based dynamical system model using approximate Bayesian inference methods, using neural networks to parameterize players' goals as a dynamic mixture of Gaussian components. Our model is conceptually simple, constructed of interpretable components, and capable of generating synthetic data that capture the complexity of real player dynamics. We further characterized players' strategies using the number of change points on each trial. We found that this complexity varied more across sessions than within sessions, and that more complex strategies benefited offensive players but not defensive players. Together, our experimental paradigm and model offer a powerful combination of tools for the study of realistic social dynamics in the laboratory setting.


Conflict of interest statement

The authors have declared that no competing interests exist.

Figures

Fig 1
Fig 1. Penalty shot task and game play.
A: The two subjects viewed the same image on separate screens. One subject (at left here) played as the “shooter” and controlled the puck, while the other (at bottom here) played as the “goalie” and controlled the bar. B: Illustration of onscreen play for the two-player game. The puck (blue) is free to move in two dimensions, while the goalie (red) moves only up or down. Axes are x and y screen directions. Solid lines indicate player trajectories for a single trial. The goalie’s trajectory has been stretched along the x axis to indicate its movement through time. For animations of game play, see S1, S2, S3 and S4 Videos.
Fig 2
Fig 2. Variability in player behavior.
A: Example trajectories from a single shooter, illustrating the diversity of player movements. B: Percentage of trials won by shooter for each behavioral session. Colors indicate shooter identity. Task parameters (puck speed, goalie size) were altered on a per-session basis to balance game play between players. C: Correlations in game outcome. Scatter plot of the probability of a shooter win as a function of shooter win or loss on the previous trial. Each dot represents one behavioral session. Colors indicate shooter identity. Game outcomes did not differ markedly following wins or losses. D: Distribution of initial velocities over all shooters. Shooters tended to start by moving immediately rightward, toward the goal line, or directly downward. E: Distribution of final vertical positions. Final goalie positions were peaked around 0 and either end of the screen, while shooter final positions were more evenly distributed over the game space. F: Autocorrelation in initial movement and final position across trials. Shooters’ initial movement direction and both players’ final vertical positions exhibited weak correlation across trials, indicative of short-term patterns in strategy. Curves are averages across behavioral sessions. Colors indicate variable.
Fig 3
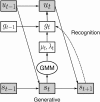
Fig 3. Model architecture.
Observable trajectories yt are generated sequentially from control signals ut, which in turn derive from goals gt. In the generative model, evolution of goals is determined by a Gaussian mixture model whose parameters are given by the output of a neural network using state variables st as input. The recognition model takes in the lagged history of yt and returns posterior samples of the goals.
Fig 4
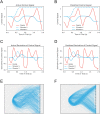
Fig 4. Model fits and generated data.
A: Actual control signals for both coordinates of puck (blue) and bar (red) for a single trial in the holdout set. B: Model predictions for control signals at the next time step given real data up to the current time. The fitted model’s predictions control closely track the real data. C, D: Plots of actual control derivatives and model-predicted derivatives for the same trial. On this scale, deviations become more apparent, but the model still closely fits the data. In both cases, model fits reflect the accuracy of the posterior map, not necessarily the generative model. E: Real puck trajectories (n = 500) drawn from a model fit to the last ten sessions of the experiment (only trials that last less than 256s are displayed, though longer trials were included in training). F: Puck trajectories (n = 500) generated from the model (only trials that last less than 256s are displayed). The model has accurately captured the qualitative features of real play.
Fig 5
Fig 5. Inferred goals predict game endpoints.
A, B: Predictive power (as measured by R2) for a model predicting final puck position as a function of either shooter gaze position, instantaneous velocity, game state, or inferred goal. C, D: Predictive power for a model predicting final puck position as a function of all variables with or without inferred goals. A, C: Aligned to trial start. B, D: Aligned to trial end. Game states consistently outperform the other variables. Inferred goals are just as predictive as the velocity of movement for the first 0.4s, but become more predictive thereafter. They remain more predictive than either measure until 0.3s before trial end, when gaze becomes a better predictor. In general, including inferred goal states in the model enhances the predictive power.
Fig 6
Fig 6. Model comparison.
A: Difference between actual and predicted control derivatives for a trial (the one in Fig 4) in all three observed dimensions in the proposed model. B: Puck trajectories (n = 100) generated from the proposed model (only trials that last less than 256s are displayed). C: Completed trajectories (n = 100) by the proposed model from 715s of a trial in the holdout set (only trials that last less than 256s are displayed). D, E, F: the same figures based on the model with single Gaussian distribution. G, H, I: the same figures based on the linear model.
Fig 7
Fig 7. Effects of goal states.
A: Completed puck trajectories (n = 200) for the trial in Fig 6C with the goal state at 715s for goalie is set at the bottom of the screen (only trials that last less than 256s are displayed). B: Completed puck trajectories (n = 200) for the same trial with the goal state at 715s for goalie is set at the top of the screen (only trials that last less than 256s are displayed).
Fig 8
Fig 8. Number of change points as a measure of strategic complexity.
A: At a given game state, each player’s energy function (blue, shooter; red, goalie) captures the evolution of his goal in the next time step. Here, the goalie’s energy function is unimodal, while the shooter’s energy function consists of a tightly clustered handful of potential targets. Gray area indicates the visible screen (game area) during the task. White indicates offscreen regions. We use the number of change points in each player’s control signal as a proxy for this complexity. B, C: Histograms of change points for all trials (B) and session means (C) for both players. D: Evolution of strategic complexity across sessions. Over the course of the experiment, the average number of shooters’ change points per trial increased. E, F: Correlation of average number of change points of shooter (E) and goalie (F) with shooter’s win rates. Each dot indicates a single session. Both shooters and goalies benefited from more change points.

References

    1. Dunbar R. The social brain hypothesis. brain. 1998;9(10):178–190.
    1. Camerer C. Behavioral game theory: Experiments in strategic interaction. Princeton University Press; 2003.
    1. Sanfey AG. Social decision-making: insights from game theory and neuroscience. Science. 2007;318(5850):598–602. 10.1126/science.1142996 - DOI - PubMed
    1. Rilling JK, Sanfey AG. The neuroscience of social decision-making. Annual review of psychology. 2011;62:23–48. 10.1146/annurev.psych.121208.131647 - DOI - PubMed
    1. Chang SW, Brent LJ, Adams GK, Klein JT, Pearson JM, Watson KK, et al. Neuroethology of primate social behavior. Proceedings of the National Academy of Sciences. 2013;110(Supplement 2):10387–10394. 10.1073/pnas.1301213110 - DOI - PMC - PubMed

Publication types