. 2019 Mar 11;14(3):e0213594.
doi: 10.1371/journal.pone.0213594. eCollection 2019.

Development of CRISPR/Cas9-mediated gene disruption systems in Giardia lamblia

Affiliations

Development of CRISPR/Cas9-mediated gene disruption systems in Giardia lamblia

Zi-Qi Lin et al. PLoS One. .

Abstract

Giardia lamblia becomes dormant by differentiation into a water-resistant cyst that can infect a new host. Synthesis of three cyst wall proteins (CWPs) is the fundamental feature of this differentiation. Myeloid leukemia factor (MLF) proteins are involved in cell differentiation, and tumorigenesis in mammals, but little is known about its role in protozoan parasites. We developed a CRISPR/Cas9 system to understand the role of MLF in Giardia. Due to the tetraploid genome in two nuclei of Giardia, it could be hard to disrupt a gene completely in Giardia. We only generated knockdown but not knockout mutants. We found that knockdown of the mlf gene resulted in a significant decrease of cwp gene expression and cyst formation, suggesting a positive role of MLF in encystation. We further used mlf as a model gene to improve the system. The addition of an inhibitor for NHEJ, Scr7, or combining all cassettes for gRNA and Cas9 expression into one plasmid resulted in improved gene disruption efficiencies and a significant decrease in cwp gene expression. Our results provide insights into a positive role of MLF in inducing Giardia differentiation and a useful tool for studies in Giardia.


Conflict of interest statement

The authors have declared that no competing interests exist.

Figures
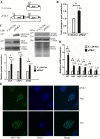
Fig 1
Fig 1. Induction of cwp1-3 and myb2 gene expression in the MLF overexpressing cell line.
(A) Diagrams of the 5’Δ5N-Pac and pPMLF plasmid. The pac gene (open box) is under the control of the 5’- and 3’-flanking regions of the gdh gene (striated box). In construct pPMLF, the mlf gene is under the control of its own 5’-flanking region (open box) and the 3’-flanking region of the ran gene (dotted box). The filled black box indicates the coding sequence of the HA epitope tag. (B) MLF overexpression increased cyst formation. The 5’Δ5N-Pac and pPMLF stable transfectants were cultured in growth medium and then subjected to cyst count as described under “Material and Methods”. The sum of total cysts is expressed as relative expression level over control. Values are shown as means ± S. E. *, P <0.05. (C) Overexpression of MLF increased the levels of CWP1 and MYB2 proteins. The 5’Δ5N-Pac and pPMLF stable transfectants were cultured in growth medium and then subjected to SDS-PAGE and Western blot analysis. The blot was probed with anti-HA, anti-MLF, anti-CWP1, anti-MYB2, and anti-RAN antibodies, respectively. Equal amounts of protein loading were confirmed by SDS-PAGE and Coomassie Blue staining. A similar level of the RAN protein was detected. The intensity of bands from three Western blot assays was quantified using Image J. The ratio of each target protein over the loading control RAN is calculated. Fold change is calculated as the ratio of the difference between pPMLF cell line and the control cell line, to which a value of 1 was assigned. Results are expressed as mean ± SD. *P<0.05. (D) Quantitative real-time PCR analysis of gene expression in the MLF-overexpressing cell lines. The 5’Δ5N-Pac and pPMLF stable transfectants were cultured in growth medium and then subjected to quantitative real-time PCR analysis using primers specific for mlf, cwp1, cwp2, cwp3, myb2, ran, and 18S ribosomal RNA genes, respectively. Transcript levels were normalized to 18S ribosomal RNA levels. Fold changes in mRNA expression are shown as the ratio of transcript levels in the pPMLF cell line relative to the 5’Δ5N-Pac cell line. Results are expressed as the means ± S. E. of at least three separate experiments. *, P <0.05. Similar levels of the ran mRNAs were detected. (E) Localization of MLF. The pPMLF stable transfectants were cultured in growth (Veg, vegetative growth, upper panel) or encystation medium for 24 h (Enc, encystation, lower panel) and then subjected to immunofluorescence analysis using anti-HA antibody for detection. The left panel shows that the MLF-HA protein is localized to the MLF-vesicles (MVs) in the cytoplasm of vegetative and encysting trophozoites. MLF also localized to sucking disc edge in an encysting trophozoite. The middle panels show the DAPI staining of cell nuclei and differential interference contrast images. The right panel shows the merged images.
Fig 2
Fig 2. Strategies 1 to 3 for MLF knock out.
(A) Strategy 1, diagrams of the pgCas9 and pMLFko plasmids. In construct pgCas9, the cas9 gene is under the control of gdh promoter (striated box) and 3’ untranslated region of the ran gene (dotted box) and its product has a C-terminal nuclear localization signal (filled gray box) and an HA tag (filled black box). In construct pMLFko, a single gRNA is driven by the Giardia U6 promoter. The single gRNA includes a guide sequence targeting 20-nucleotides of the mlf gene (nt 115–134), which is located upstream three nucleotides of protospacer-adjacent motif (NGG sequence). pMLFko also has the HR template cassette which contains the 5’ and 3’ flanking region of the mlf gene as homologous arms and the pac selectable marker. The Cas9/gRNA cutting site in the genomic mlf gene is indicated by a red arrow. After introducing a double-stranded DNA break in the mlf gene, replacement of the genomic mlf gene with the pac gene will occur by HR. The pgCas9 and pMLFko constructs were transfected into G. lamblia WB trophozoites and MLFko stable transfectants were established under puromycin selection. The control cell line is trophozoites transfected with double amounts of 5’Δ5N-Pac plasmid and selected with puromycin. PCR1/2 were used for identification of knockout clones. Puromycin was removed from the MLFko and control cell lines to obtain the MLFko–pu and control–pu cell lines, respectively. (B) Strategy 2, diagrams of the pgCas9 and pMLFko plasmids, which are the same as in Fig 2A. These two constructs were transfected into trophozoites. An NHEJ inhibitor, SCR7, was added into the culture to increase HR. The MLFkoSC stable transfectants were established under puromycin selection. The control cell line is trophozoites transfected with double amounts of 5’Δ5N-Pac plasmid and selected with puromycin. (C) Strategy 3, diagrams of the pgCas9MLFko plasmid, which contains all the elements, including the expression cassettes of Cas9 and gRNA, and the HR template cassette which contains the 5’ and 3’ flanking region of the mlf gene as homologous arms and the pac selectable marker. After introducing a double-stranded DNA break in the mlf gene (red arrow), replacement of the genomic mlf gene with the pac gene will occur by HR. The pgCas9MLFko plasmid was transfected into trophozoites. An NHEJ inhibitor, SCR7, was added to increase HR. The Cas9MLFko stable transfectants were established under puromycin selection. The control cell line is trophozoites transfected with 5’Δ5N-Pac plasmid and selected with puromycin. In another experiment, puromycin was removed from the Cas9MLFko cell line to obtain the Cas9MLFko–pu cell line. The control cell line is wild type nontransfected WB trophozoites.
Fig 3
Fig 3. Decrease of mlf, cwp1-3, myb2, wrky, pax1, and cdk2 gene expression by MLF knock down during encystation using strategy 1.
(A) Partial replacement of the mlf gene with the pac gene in the MLFko cell line confirmed by PCR. Puromycin was kept in the MLFko and control cell lines as described in Fig 2A. Genomic DNA was isolated from MLFko and control cell lines cultured in growth medium (vegetative growth, Veg). PCR was performed using primers specific for mlf (PCR1), pac (PCR2), cwp1, cwp2, and ran genes, respectively. Products from the cwp1, cwp2, and ran genes are internal controls. (B) Partial disruption of mlf gene in the MLFko cell line confirmed by real-time PCR. Real-time PCR was performed using genomic DNA and primers specific for mlf, cwp1, cwp2, and ran genes, respectively. The mlf, cwp1, and cwp2 DNA levels were normalized to the ran DNA level.–Fold changes in DNA levels are shown as the ratio of DNA levels in MLFko cell line relative to control cell line. Results are expressed as the means ± S. E. (error bars) of at least three separate experiments. *, P <0.05. (C) Cyst formation decreased by MLF knock down in the MLFko cell line during encystation. The control and MLFko cell lines were cultured in encystation medium and then subjected to cyst count as described under “Material and Methods” and Fig 1B. (D) Decrease of number of MVs by MLF knock down in the MLFko cell line. The control and MLFko cell lines were cultured in encystation medium and then subjected to immunofluorescence analysis using anti-MLF antibody for detection. MVs in MLFko and control cell lines were quantitated using Imaris software. MLF localized to fewer MVs in the MLFko cell line relative to the control cell line. *, P <0.05 (n = 30–70 cells/condition). (E) Knock down of mlf gene decreased the levels of CWP1, MYB2, and other proteins in the MLFko cell line. The control and MLFko cell lines were cultured in encystation medium and then subjected to SDS-PAGE and Western blot analysis as described in Fig 1C. The blot was probed with anti-MLF, anti-CWP1, anti-MYB2, anti-WRKY, anti-PAX1, anti-CDK2, and anti-RAN antibodies, respectively. The intensity of bands from three Western blot assays was quantified using Image J. The ratio of each target protein over the loading control RAN is calculated. Fold change is calculated as the ratio of the difference between MLFko cell line and the control cell line, to which a value of 1 was assigned. Results are expressed as mean ± SD. *P<0.05. (F) Decrease of multiple gene expression by MLF knock down in the MLFko cell line. The control and MLFko cell lines were cultured in encystation medium and then subjected to quantitative real-time RT-PCR analysis using primers specific for mlf, cwp1, cwp2, cwp3, myb2, wrky, pax1, cdk2, ran, and 18S ribosomal RNA genes, respectively. Transcript levels were normalized to 18S ribosomal RNA levels.–Fold changes in mRNA expression are shown as the ratio of transcript levels in the MLFko cell line relative to the control cell line. Results are expressed as the means ± S. E. of at least three separate experiments. *, P <0.05. The ran mRNAs slightly decreased.
Fig 4
Fig 4. Decrease of cyst formation and number of MVs by MLF knock down after the removal of puromycin during vegetative growth using strategy 1.
(A) Partial replacement of the mlf gene with the pac gene in the MLFko–pu cell line confirmed by PCR. Puromycin was removed from the MLFko and control cell lines to obtain the MLFko–pu and control–pu cell lines, respectively, as described in Fig 2A. Genomic DNA was isolated from MLFko–pu and control -pu cell lines cultured in growth medium (vegetative growth, Veg). PCR was performed using primers specific for mlf (PCR1), pac (PCR2), cwp1, cwp2, and ran genes, respectively, as described in Fig 3A. (B) Partial disruption of the mlf gene in the MLFko -pu cell line confirmed by real-time PCR. Real-time PCR was performed using genomic DNA and primers specific for mlf, cwp1, cwp2, and ran genes, respectively, as described in Fig 3B. (C) Cyst formation decreased by MLF knock down in the MLFko–pu cell line. The control–pu and MLFko–pu cell lines were cultured in growth medium and then subjected to cyst count as described under “Material and Methods” and Fig 1B. (D) Decrease of number of MVs by MLF knock down in the MLFko–pu cell line. The control–pu and MLFko–pu cell lines were cultured in growth medium and then subjected to immunofluorescence analysis using anti-MLF antibody for detection. MLF localized to fewer MVs in the MLFko–pu cell line relative to the control–pu cell line. The left panel shows that the MLF protein is localized to the vesicles in the cytoplasm. The middle panels show the DAPI staining of cell nuclei and differential interference contrast images. The right panel shows the merged images.
Fig 5
Fig 5. Increase of MLF knock down efficiency during vegetative growth using strategy 2 compared to strategy 1.
(A) Increased disruption of the mlf gene in the MLFkoSC cell line relative to the MLFko cell line confirmed by real-time PCR. Genomic DNA was isolated from MLFko and MLFkoSC cell lines cultured in growth medium (vegetative growth, Veg). Real-time PCR was performed using primers specific for mlf, cwp1, cwp2, and ran genes, respectively, as described in Fig 3B. (B) MLF knock down decreased cyst formation in the MLFkoSC cell line relative to the MLFko cell line. The MLFko and MLFkoSC cell lines were cultured in growth medium and then subjected to cyst count as described under “Material and Methods” and Fig 1B. (C) Decrease of number of MVs by MLF knock down in the MLFkoSC cell line relative to the MLFko cell line. The MLFko and MLFkoSC cell lines were cultured in growth medium and then subjected to immunofluorescence analysis using anti-MLF antibody for detection as described in Fig 3D. (D) Knock down of mlf gene decreased the levels of CWP1, MYB2, and other proteins in MLFkoSC cell line relative to the MLFko cell line. The MLFko and MLFkoSC cell lines were cultured in growth medium and then subjected to SDS-PAGE and Western blot analysis as described in Fig 1C. The blot was probed with anti-MLF, anti-CWP1, anti-MYB2, anti-WRKY, anti-PAX1, anti-CDK2, and anti-RAN antibodies, respectively. The intensity of bands from three Western blot assays was quantified using Image J. The ratio of each target protein over the loading control RAN is calculated. Fold change is calculated as the ratio of the difference between MLFkoSC cell line and the MLFko cell line, to which a value of 1 was assigned. Results are expressed as mean ± SD. *P<0.05. (E) Decrease of multiple gene expression by MLF knock down in MLFkoSC cell line relative to the MLFko cell line. The MLFko and MLFkoSC cell lines were cultured in growth medium and then subjected to quantitative real-time RT-PCR analysis using primers specific for mlf, cwp1, cwp2, cwp3, myb2, wrky, pax1, cdk2, ran, and 18S ribosomal RNA genes, respectively, as described in Fig 3F.
Fig 6
Fig 6. Decrease of cwp1, cwp2, and myb2 gene expression by MLF knock down during vegetative growth using strategy 3.
(A) Partial replacement of the mlf gene with the pac gene in the Cas9MLFko cell line confirmed by PCR. The pgCas9MLFko plasmid was transfected into trophozoites as described in Fig 2C. Genomic DNA was isolated from Cas9MLFko and control cell lines cultured in growth medium (vegetative growth, Veg). PCR was performed using primers specific for mlf (PCR1), pac (PCR2), cwp1, cwp2, and ran genes, respectively, as described in Fig 3A. (B) Partial disruption of the mlf gene in the Cas9MLFko cell line confirmed by real-time PCR. Real-time PCR was performed using genomic DNA and primers specific for mlf, cwp1, cwp2, and ran genes, respectively, as described in Fig 3A. (C) Cyst formation decreased by MLF knock down in the Cas9MLFko cell line. The control and Cas9MLFko cell lines were cultured in growth medium and then subjected to cyst count as described under “Material and Methods” and Fig 1B. (D) Knock down of mlf gene decreased the levels of MLF and CWP1 proteins in the Cas9MLFko cell line. The control and Cas9MLFko cell lines were cultured in growth medium and then subjected to SDS-PAGE and Western blot analysis as described in Fig 1C. The blot was probed with anti-HA, anti-MLF, anti-CWP1, and anti-RAN antibodies, respectively. The intensity of bands from three Western blot assays was quantified using Image J. The ratio of each target protein over the loading control RAN is calculated. Fold change is calculated as the ratio of the difference between Cas9MLFko cell line and the control cell line, to which a value of 1 was assigned. Results are expressed as mean ± SD. *P<0.05. (E) Decrease of mlf, cwp1, and cwp2 gene expression by MLF knock down in the Cas9MLFko cell line. The control and Cas9MLFko cell lines were cultured in growth medium and then subjected to quantitative real-time RT-PCR analysis using primers specific for mlf, cwp1, cwp2, ran, and 18S ribosomal RNA genes, respectively, as described in Fig 3F. (F) RT-PCR analysis of gRNA expression in the in the Cas9MLFko cell line. The control and Cas9MLFko cell lines were cultured in growth medium and then subjected to RT-PCR analysis using primers specific for gRNA, and 18S ribosomal RNA genes, respectively. Similar levels of the 18S ribosomal RNA were detected. (G) Localization of Cas9-HA to the nuclei and cytoplasm in the Cas9MLFko cell line. The control and Cas9MLFko cell lines were cultured in growth medium and then subjected to immunofluorescence analysis using anti-HA antibody for detection. Cas9-HA localized to the nuclei and cytoplasm in the Cas9MLFko cell line but no signal was detected in the control cell line. The left panel shows that the Cas9-HA protein is localized to the nuclei and cytoplasm, but no signal was detected in the control cell line. The middle panel shows the DAPI staining of cell nuclei. The right panel shows the merged images.
Fig 7
Fig 7. MLF increases and induces cyst formation during encystation.
(A) Disruption of the mlf gene by CRISPR/Cas9 system. A single gRNA includes a guide sequence targets the 20-nucleotides of the mlf gene which is located upstream three nucleotides of protospacer-adjacent motif (PAM, NGG sequence). An HR template cassette contains the 5’ and 3’ flanking region of the mlf gene as homologous arms and the pac selectable marker. Cas9 can form a complex with gRNA to target DNA by recognizing PAM sequence. After cleavage of DNA by Cas9/gRNA complex, dsDNA break will form and then replacement of the genomic mlf gene with the pac gene will occur by HR. (B) Increase of encystation-induced pathway during encystation. The gene encoding key components of the cyst wall, cwp1, is up-regulated by MYB2, WRKY, and PAX1 transcription factors during encystation. These transcription factors can bind to AT-rich initiator (Inr) of the cwp1 promoter. They can also activate mlf gene expression. The increase of MLF also can increase the levels of CWP1, MYB2, WRKY, PAX1, and CDK2. MLF was present in vegetative trophozoite stage at a lower level. During encystation, more MLF is produced by these transcription factors. MLF may further induce encystation by increasing this encystation-induced pathway in Giardia. The increase of transcription factors may further induce CWP1 and MLF expression, resulting in more cyst formation during encystation.

Similar articles

Cited by

References

    1. Adam RD. Biology of Giardia lamblia. Clin Microbiol Rev. 2001;14(3):447–475. 10.1128/CMR.14.3.447-475.2001 - DOI - PMC - PubMed
    1. Hunter P.R, Thompson RC. The zoonotic transmission of Giardia and Cryptosporidium. Int J Parasitol. 2005;35(11–12):1181–1190. 10.1016/j.ijpara.2005.07.009 - DOI - PubMed
    1. Hanevik K, Dizdar V, Langeland N, Hausken T. Development of functional gastrointestinal disorders after Giardia lamblia infection. BMC Gastroenterol. 2009;9:27 10.1186/1471-230X-9-27 - DOI - PMC - PubMed
    1. Miyamoto Y, Eckmann L. Drug Development Against the Major Diarrhea-Causing Parasites of the Small Intestine, Cryptosporidium and Giardia. Front Microbiol. 2015;6:1208 10.3389/fmicb.2015.01208 - DOI - PMC - PubMed
    1. Berkman DS, Lescano AG, Gilman RH, Lopez SL, Black MM. Effects of stunting, diarrhoeal disease, and parasitic infection during infancy on cognition in late childhood: a follow-up study. Lancet. 2002;359(9036):564–571. - PubMed

Publication types

Substances