Meta-Analysis
. 2019 Mar 1;111(3):245-255.
doi: 10.1093/jnci/djy221.

Systematic Review and Meta-Analysis of the Magnitude of Structural, Clinical, and Physician and Patient Barriers to Cancer Clinical Trial Participation

Affiliations
Meta-Analysis

Systematic Review and Meta-Analysis of the Magnitude of Structural, Clinical, and Physician and Patient Barriers to Cancer Clinical Trial Participation

Joseph M Unger et al. J Natl Cancer Inst. .

Abstract

Background: Barriers to cancer clinical trial participation have been the subject of frequent study, but the rate of trial participation has not changed substantially over time. Studies often emphasize patient-related barriers, but other types of barriers may have greater impact on trial participation. Our goal was to examine the magnitude of different domains of trial barriers by synthesizing prior research.

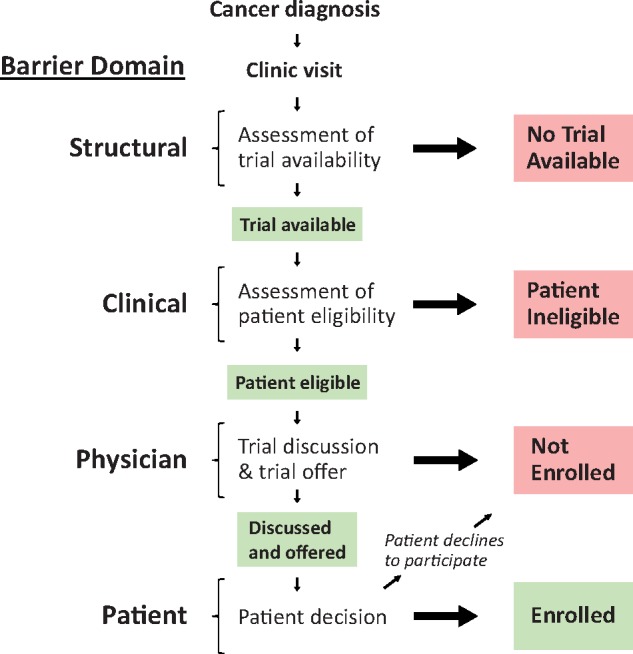
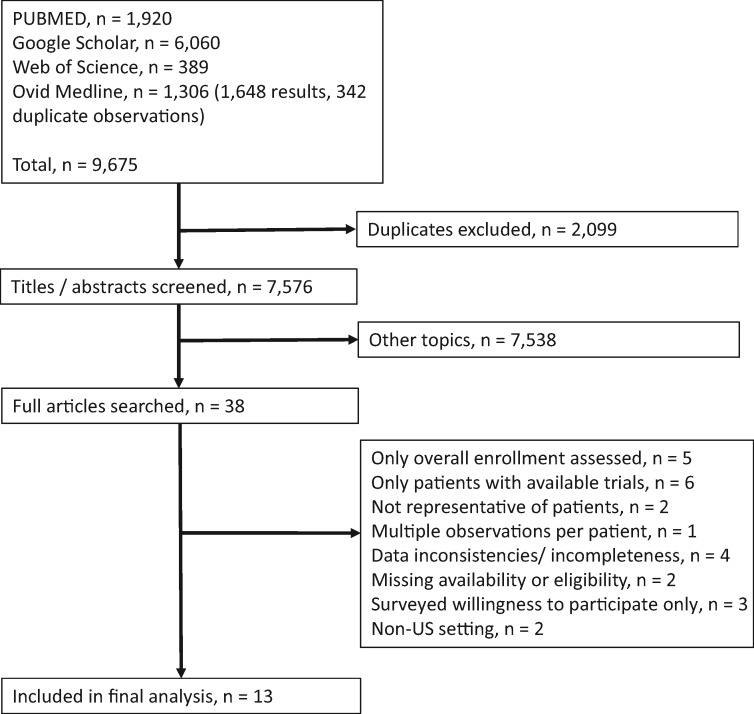
Methods: We conducted a systematic review and meta-analysis of studies that examined the trial decision-making pathway using a uniform framework to characterize and quantify structural (trial availability), clinical (eligibility), and patient/physician barrier domains. The systematic review utilized the PubMed, Google Scholar, Web of Science, and Ovid Medline search engines. We used random effects to estimate rates of different domains across studies, adjusting for academic vs community care settings.

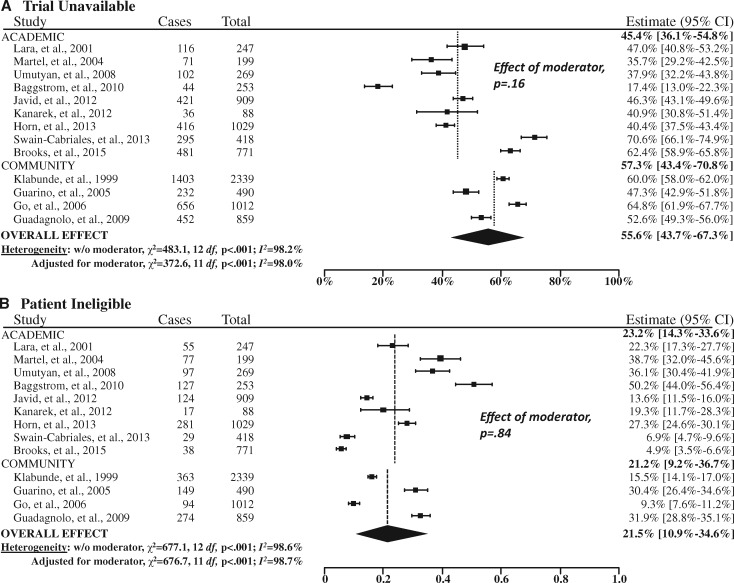
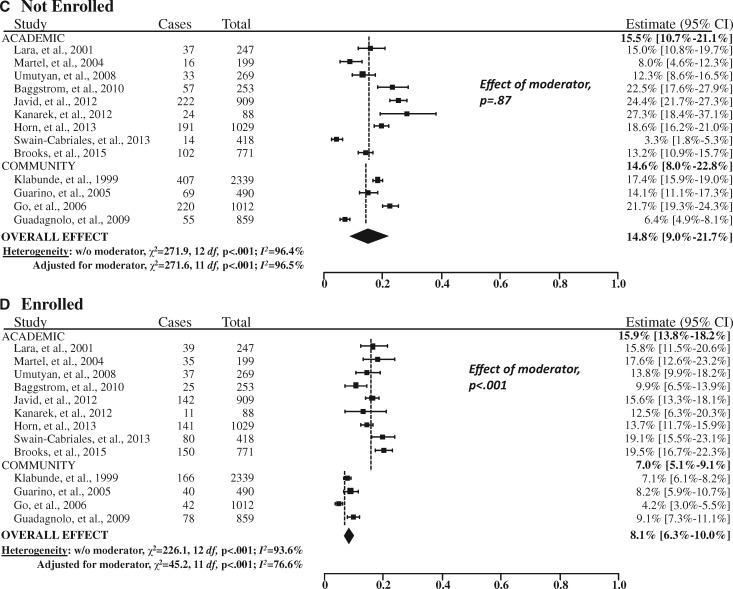
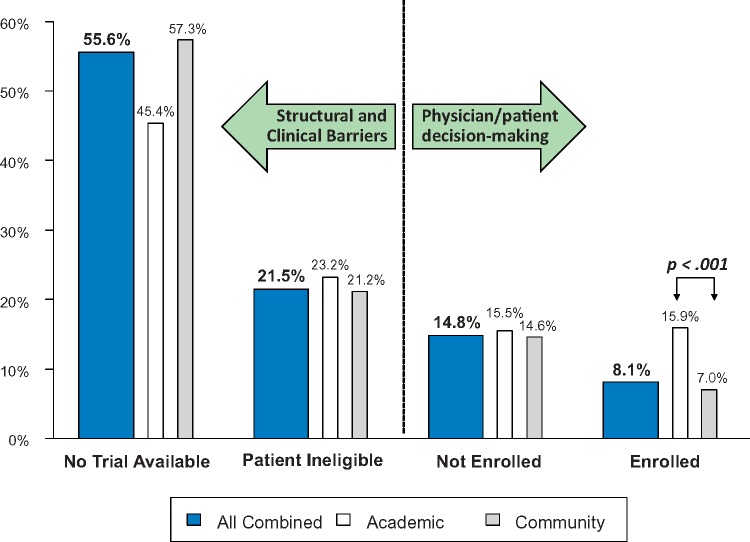
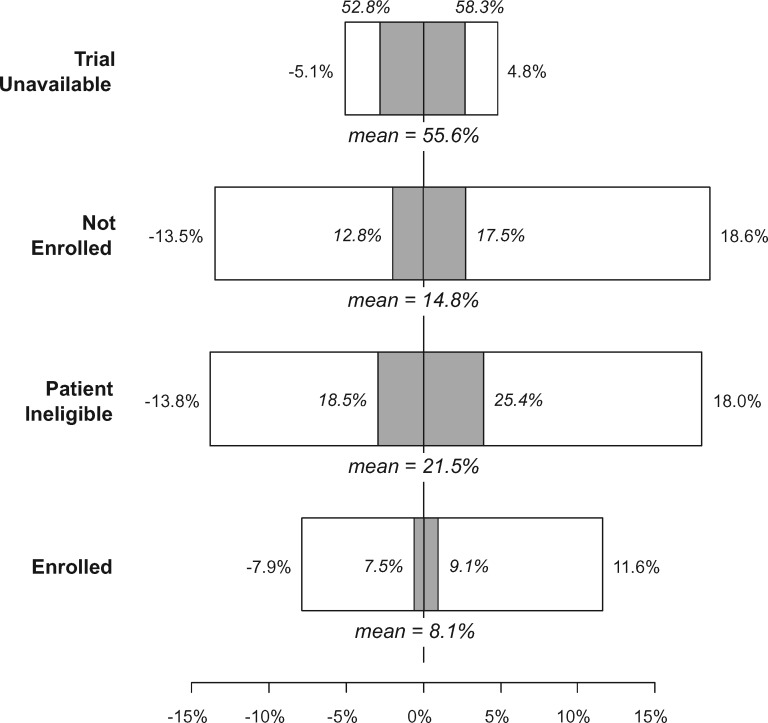
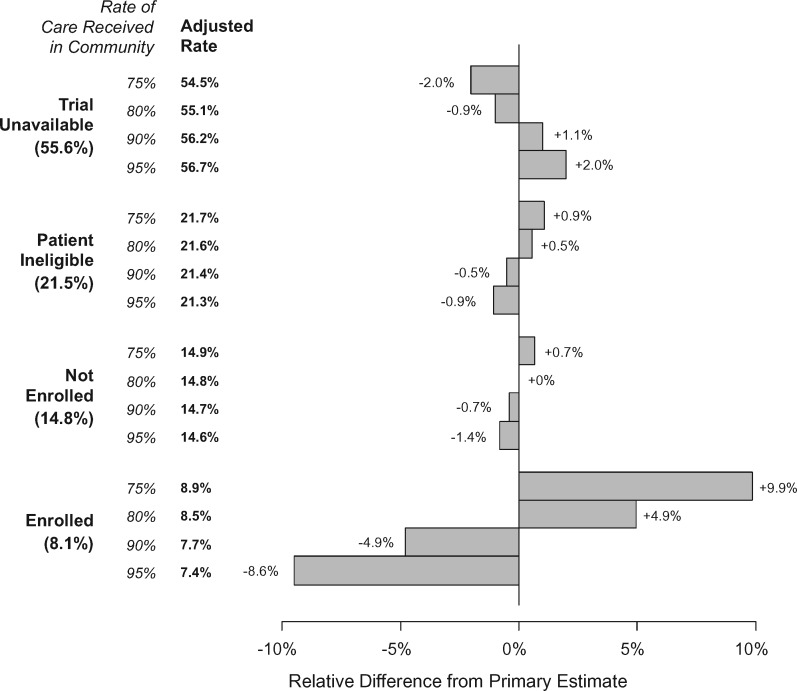
Results: We identified 13 studies (nine in academic and four in community settings) with 8883 patients. A trial was unavailable for patients at their institution 55.6% of the time (95% confidence interval [CI] = 43.7% to 67.3%). Further, 21.5% (95% CI = 10.9% to 34.6%) of patients were ineligible for an available trial, 14.8% (95% CI = 9.0% to 21.7%) did not enroll, and 8.1% (95% CI = 6.3% to 10.0%) enrolled. Rates of trial enrollment in academic (15.9% [95% CI = 13.8% to 18.2%]) vs community (7.0% [95% CI = 5.1% to 9.1%]) settings differed, but not rates of trial unavailability, ineligibility, or non-enrollment.

Conclusions: These findings emphasize the enormous need to address structural and clinical barriers to trial participation, which combined make trial participation unachievable for more than three of four cancer patients.


Figures

Figure 1.
Figure 1.
Cancer clinical trial decision-making framework. A framework for describing the clinical trial decision-making pathway stipulates that the treatment decision process is initiated at cancer diagnosis and clinic visit. A determination is made as to whether a trial is available for the patient’s histology and stage of cancer. The absence of an available trial represents a structural domain barrier at sites or institutions. If a trial is available, the patient is assessed for eligibility, representing a potential clinical domain barrier of the trial design. If the patient is eligible, a trial is then discussed and trial participation is either offered or not offered to the patient; ultimately, the patient decides whether to participate in the trial and may decline (physician and patient domain barriers). Thus, eligible patients may not enroll due to either not being asked or declining when they are asked. Each of these types of barriers may also vary depending on demographic and socioeconomic attributes.
Figure 2.
Figure 2.
Selection of studies included in the analysis.
Figure 3.
Figure 3.
Forest plots of the study-level and summary estimates for each domain. A) Trial unavailable. B) Patient ineligible. C) Not enrolled. D) Enrolled. The boxes show the study-level estimate and the 95% confidence intervals. The overall effect is a summary measure based on the meta-regression analysis accounting for institutional setting (academic vs community sites) as a moderator, weighted at a ratio of 15:85 based on the estimated proportion of cancer cases treated in the community setting (85%). The diamond shows the 95% confidence intervals (CIs) for the summary estimates. The P values were calculated from Cochran’s Q test; all statistical tests were two-sided. The dashed vertical lines indicate the derived estimate within academic and community sites, respectively.
Figure 3.
Figure 3.
Forest plots of the study-level and summary estimates for each domain. A) Trial unavailable. B) Patient ineligible. C) Not enrolled. D) Enrolled. The boxes show the study-level estimate and the 95% confidence intervals. The overall effect is a summary measure based on the meta-regression analysis accounting for institutional setting (academic vs community sites) as a moderator, weighted at a ratio of 15:85 based on the estimated proportion of cancer cases treated in the community setting (85%). The diamond shows the 95% confidence intervals (CIs) for the summary estimates. The P values were calculated from Cochran’s Q test; all statistical tests were two-sided. The dashed vertical lines indicate the derived estimate within academic and community sites, respectively.
Figure 4.
Figure 4.
Magnitude of barriers for each domain for academic sites, community sites, and all sites combined. The P value was derived from a z score in a random effects model. A two-sided test was used.
Figure 5.
Figure 5.
Tornado plot showing sensitivity analysis results for the “leave one out” method. This approach excludes each of the 13 studies one at a time and recalculates the overall domain-specific estimates using the specified random-effects approach. Each box shows the range of relative (in white) and absolute percentage (in gray) increases or decreases in the overall estimated rate for each domain. The primary estimates are also shown.
Figure 6.
Figure 6.
Sensitivity of results to the assumed rate of care received in the community. For each domain, we allowed the assumed rate of care in the community to vary from 65% to 85% (with 75% not shown in the bar graph because this represents the primary baseline against which the alternative estimates are compared). The adjusted percentage rate is shown as well as the relative difference in the estimates in the bar graph.

References

    1. IOM (Institute of Medicine). Transforming Clinical Research in the United States: Challenges and Opportunities: Workshop Summary. Washington, DC: The National Academies Press; 2010. - PubMed
    1. Murthy VH, Krumholz HM, Gross CP.. Participation in cancer clinical trials: race-, sex-, and age-based disparities. JAMA. 2004;291(22):2720–2726. - PubMed
    1. Sateren WB, Trimble EL, Abrams J, et al. How sociodemographics, presence of oncology specialists, and hospital cancer programs affect accrual to cancer treatment trials. J Clin Oncol. 2002;20(8):2109–2117. - PubMed
    1. Tejeda HA, Green SB, Trimble EL, et al. Representation of African-Americans, Hispanics, and whites in National Cancer Institute cancer treatment trials. J Natl Cancer Inst. 1996;88(12):812–816. - PubMed
    1. Comis RL, Miller JD, Aldigé CR, Krebs L, Stoval E.. Public attitudes toward participation in cancer clinical trials. J Clin Oncol. 2003;21(5):830–835. - PubMed

Publication types

MeSH terms