. 2019 May:67:90-100.
doi: 10.1016/j.jnutbio.2019.01.020. Epub 2019 Feb 10.

Tissue-dependent effects of cis-9,trans-11- and trans-10,cis-12-CLA isomers on glucose and lipid metabolism in adult male mice

Affiliations

Tissue-dependent effects of cis-9,trans-11- and trans-10,cis-12-CLA isomers on glucose and lipid metabolism in adult male mice

Jose Cordoba-Chacon et al. J Nutr Biochem. 2019 May.

Abstract

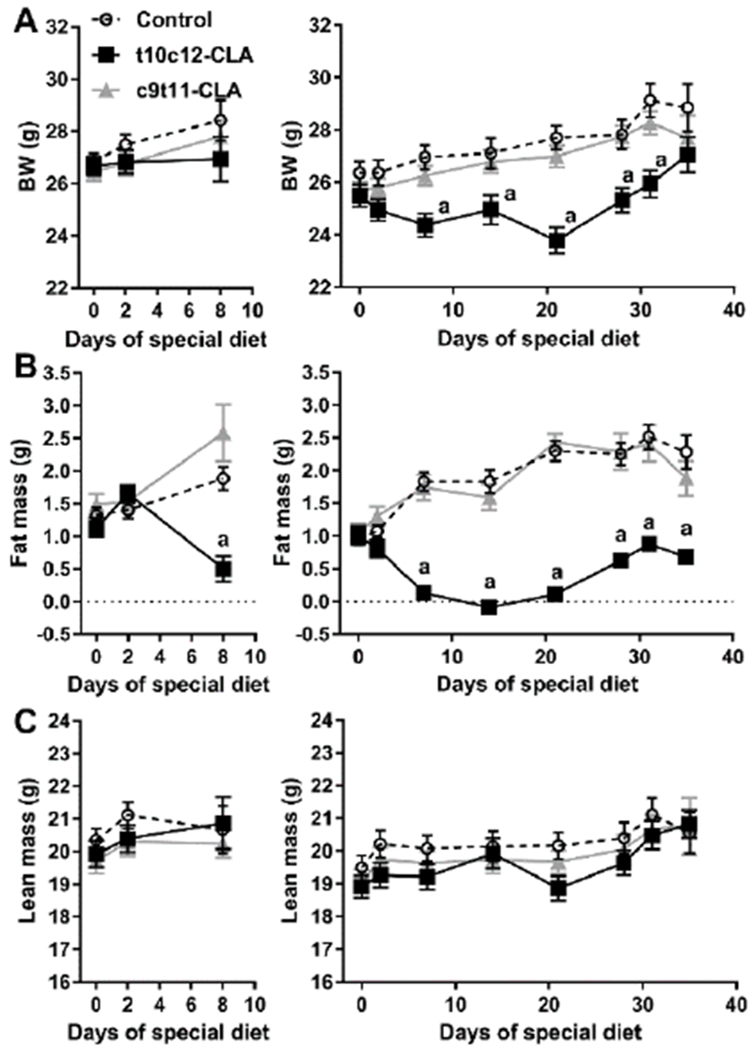
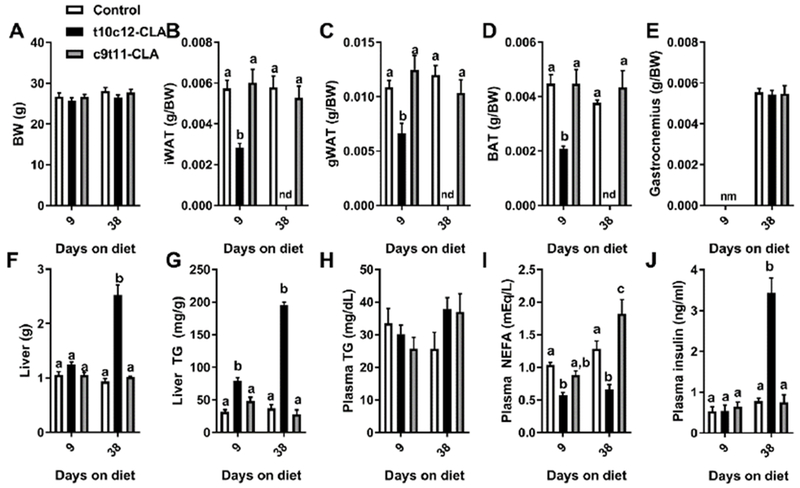
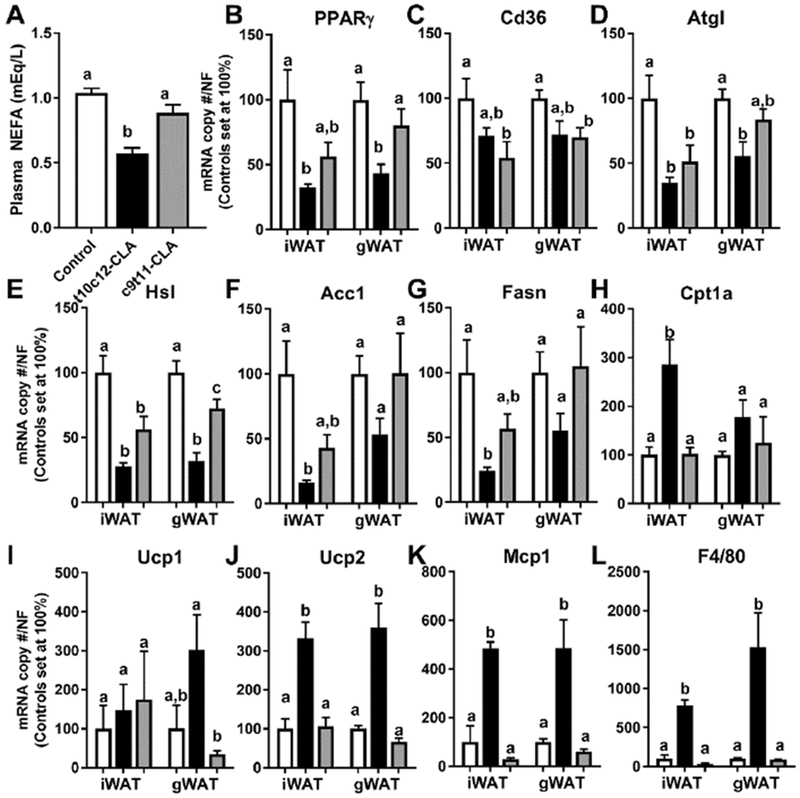
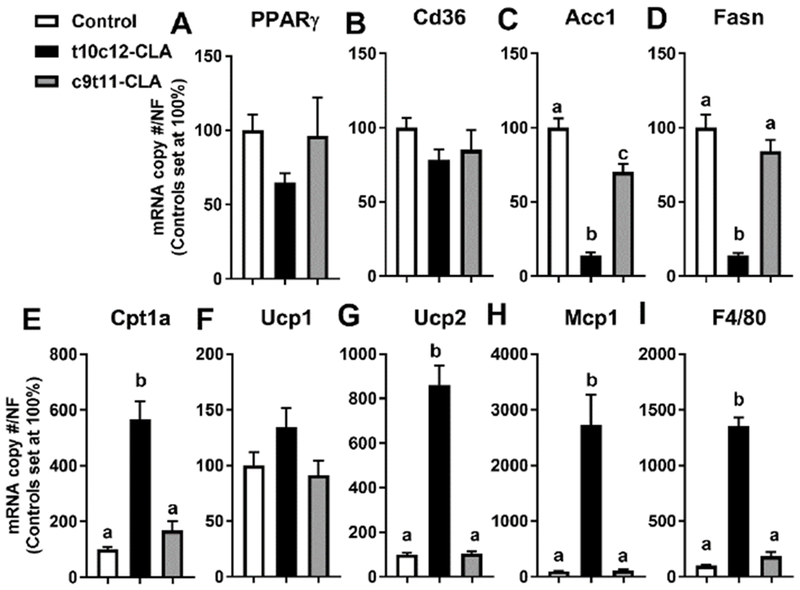
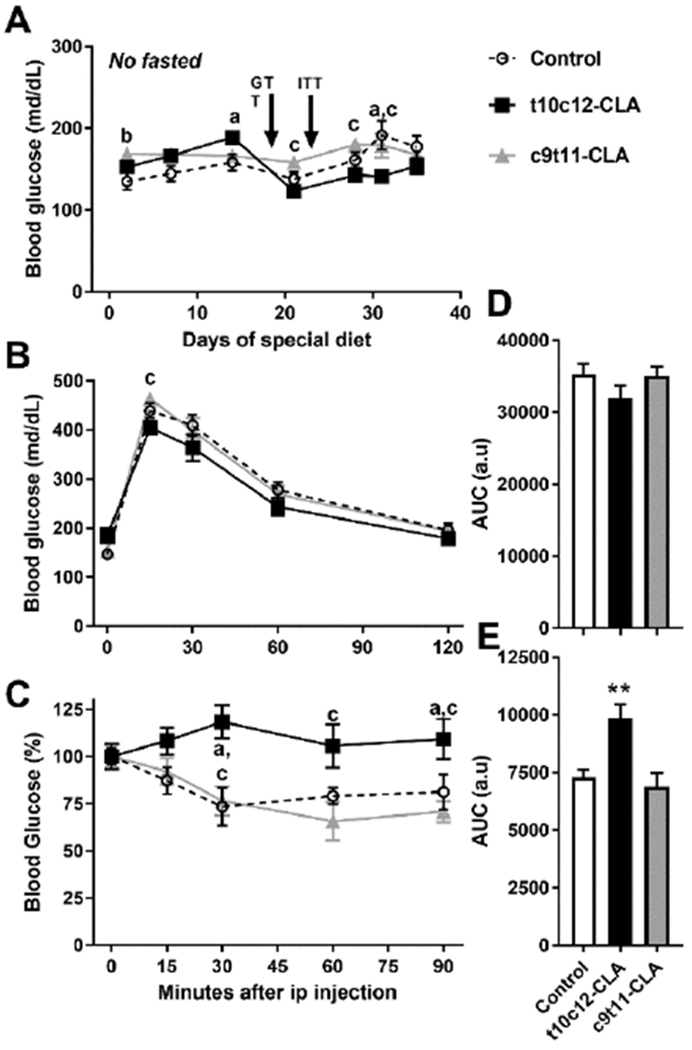
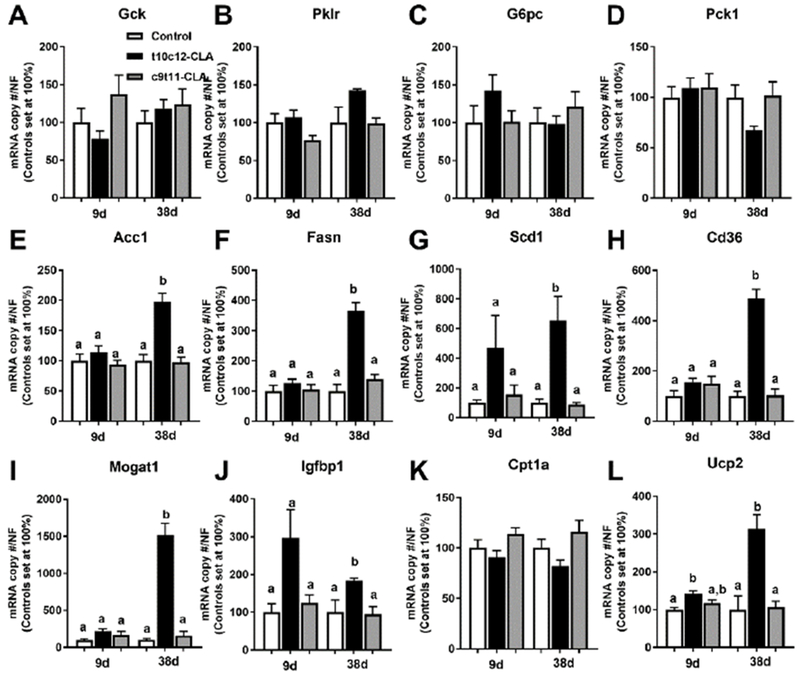
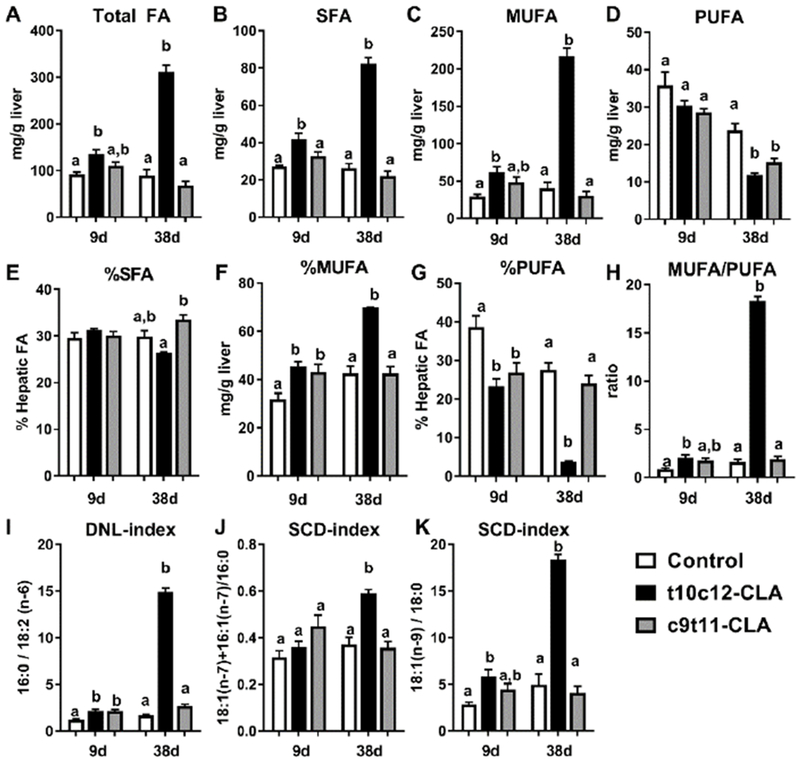
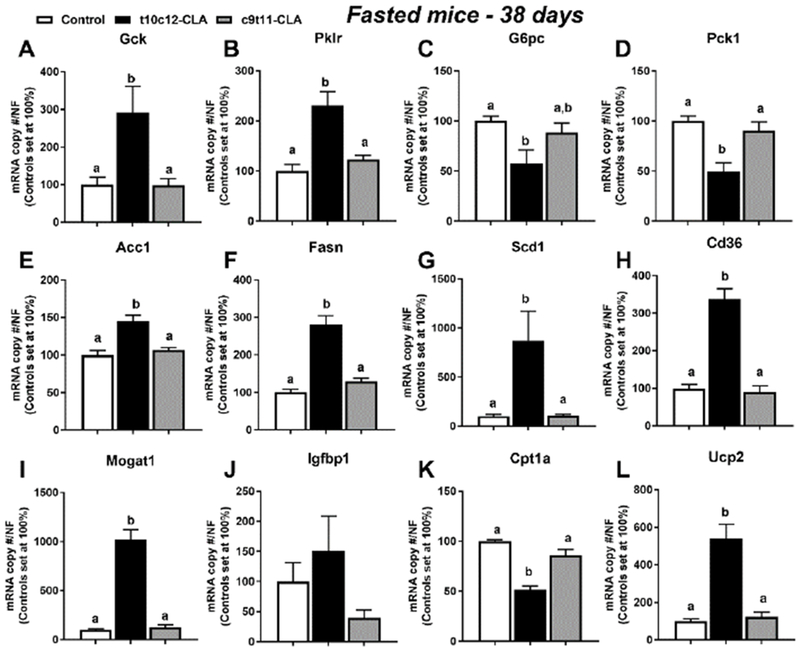
Mixtures of the two major conjugated linoleic acid (CLA) isomers trans-10,cis-12-CLA and cis-9,trans-11-CLA are used as over the counter supplements for weight loss. Because of the reported adverse effects of CLA on insulin sensitivity in some mouse studies, we sought to compare the impact of dietary t10c12-CLA and c9t11-CLA on liver, adipose tissue, and systemic metabolism of adult lean mice. We fed 8 week-old C57Bl/6J male mice with low fat diets (10.5% Kcal from fat) containing 0.8% t10c12-CLA or c9t11-CLA for 9 or 38 days. Diets containing c9t11-CLA had minimal impact on the endpoints studied. However, 7 days after starting the t10c12-CLA diet, we observed a dramatic reduction in fat mass measured by NMR spectroscopy, which interestingly rebounded by 38 days. This rebound was apparently due to a massive accumulation of lipids in the liver, because adipose tissue depots were visually undetectable. Hepatic steatosis and the disappearance of adipose tissue after t10c12-CLA feeding was associated with elevated plasma insulin levels and insulin resistance, compared to mice fed a control diet or c9t11-CLA diet. Unexpectedly, despite being insulin resistant, mice fed t10c12-CLA had normal levels of blood glucose, without signs of impaired glucose clearance. Hepatic gene expression and fatty acid composition suggested enhanced hepatic de novo lipogenesis without an increase in expression of gluconeogenic genes. These data indicate that dietary t10c12-CLA may alter hepatic glucose and lipid metabolism indirectly, in response to the loss of adipose tissue in mice fed a low fat diet.

Keywords: Fatty liver; Insulin resistance; Lipodystrophy; Polyunsaturated fatty acids; de novo lipogenesis.


Conflict of interest statement

Conflict of interest: Authors do not have any conflict of interest.

Figures

Figure 1.
Figure 1.. Dietary t10c12 CLA induces a transitory reduction of body weight and fat mass without alterations in lean mass.
A) Body weight, B) NMR-based fat mass, and C) NMR-based lean mass of mice fed a control diet (open circle, discontinuous line), a t10c12-CLA diet (black squares, black line), or a c9t11-CLA diet (grey triangles, grey line). Data are represented as means +/− SEM, and analyzed by two-way ANOVA followed by a Tukey posthoc analysis. a, indicates significant differences between mice fed a t10c12-CLA diet with mice fed a control or a c9t11-CLA diet within time points. a, p<0.05. N= 6-12mice/group.
Figure 2.
Figure 2.. Dietary t10c12-CLA promotes lipodystrophy and fatty liver.
A) Body weight, and relative B) inguinal white adipose tissue (iWAT), C) gonadal WAT (gWAT), D) brown adipose tissue (BAT), and E) gastrocnemius. F) Liver weight. G) Liver TG, and plasma H) TG, I) NEFA, and J) insulin. Open columns (control diet), black columns (t10c12-CLA diet), grey columns (c9t11-CLA diet). Data are represented as means +/− SEM, and analyzed by two-way ANOVA followed by a Tukey posthoc analysis. Different letters indicate significant differences between groups within time point. p<0.05. N= 5-6mice/group.
Figure 3.
Figure 3.. Dietary t10c12-CLA for 9 days reduces the expression of lipogenic genes and increases the expression of fatty oxidation and inflammatory genes in a tissue-specific manner.
A) Plasma NEFA, and expression of B) PPARγ, C) Cd36, D) Atgl, E) Hsl, F) Acc1, G) Fasn, H) Cptla, I) Ucpl, J) Ucp2, K) Mcp1, and L) F4/80 in inguinal WAT (iWAT) and gonadal (gWAT). Open columns (control diet), black columns (t10c12-CLA diet), grey columns (c9t11-CLA diet). Data are represented as means +/− SEM of relative values of controls (set at 100%, B-L), and analyzed by one-way ANOVA followed by a Tukey posthoc analysis. Different letters indicate significant differences between groups within fat sub depot. p<0.05. N= 4-6 mice/group.
Figure 4.
Figure 4.. Dietary t10c12-CLA for 9 days reduces the expression of lipogenic genes and increases the expression of fatty oxidation and inflammatory genes in brown adipose tissue.
Expression of A) PPARγ, B) Cd36, C) Acc1, D) Fasn, E) Cptla, F) Ucp1, G) Ucp2, H) Mcp1, and I) F4/80 in BAT. Open columns (control diet), black columns (t10c12-CLA diet), grey columns (c9t11-CLA diet). Data are represented as means +/− SEM of relative values of controls (set at 100%), and analyzed by one-way ANOVA followed by a Tukey posthoc analysis. Different letters indicate significant differences between groups. p<0.05. N= 5-6mice/group.
Figure 5.
Figure 5.. Mice fed a diet containing t10c12-CLA show normal glucose levels and clearance of circulating glucose, but develop insulin resistance.
A) Blood glucose was assessed in mice at 1200h, food was withdrawn at 0800h. B) Glucose tolerance test, 2g/kg ip was performed in overnight fasted mice at 0900h. C) Insulin tolerance test, 1.5U/kg ip was peformed in mice at 1200h, food was withdrawn at 0800h. Open circle, discontinuous line (control diet), black squares, black line (t10c12-CLA diet), grey triangles, grey line (c9t11-CLA diet). Data are represented as means +/− SEM, and analyzed by two-way ANOVA (A-C) or one-way ANOVA (D-E) followed by a Tukey posthoc analysis. Letters indicate significant differences between groups within a time point: a, control vs t10c12-CLA; b, control vs c9t11-CLA; c, t10c12-CLA vs c9t11-CLA. p<0.05. Asterisks indicate differences between control and t10c12-CLA, **, p<0.01. N= 6-12mice/group.
Figure 6.
Figure 6.. Dietary t10c12-CLA increases expression of hepatic lipogenic genes.
Hepatic expression of A) Gck, B) Pklr, C) G6pc, D) Pck1, E) Acc1, F) Fasn, G) Scdl, H) Cd36 I) Mogatl, J) Igfbp1, K) Cpt1a, and L) Ucp2 of mice after 9 and 38 days of the special diets. Open columns (control diet), black columns (t10c12-CLA diet), grey columns (c9t11-CLA diet). Data are represented as means +/− SEM of relative values of controls (set at 100%), and analyzed by one-way ANOVA followed by a Tukey posthoc analysis. Different letters indicate significant differences between groups within time point. p<0.05. N= 5-6 mice/group.
Figure 7.
Figure 7.. Dietary t10c12-CLA induces significant changes in the hepatic fatty acid composition.
Hepatic levels of A) total fatty acids (FA), B) saturated FA (SFA), C) monounsaturated FA (MUFA), D) polyunsaturated FA (PUFA), E) MUFA/PUFA ratio, F) percentage of SFA, G) percentage of MUFA, H) percentage of PUFA, I) de novo lipogenesis index (DNL: 16:0/182:2(n-6), J) SCD-index (18:1(n-7)+16:1(n-7)/16:0), and K) J) SCD-index (18:1(n-9)/18:0) of mice after 38 days of the special diets. Open columns (control diet), black columns (t10c12-CLA diet), grey columns (c9t11-CLA diet). Data are represented as means +/− SEM, and analyzed by one-way ANOVA followed by a Tukey posthoc analysis. Different letters indicate significant differences between groups within time point. p<0.05. N= 4-6mice/group.
Figure 8.
Figure 8.. Dietary t10c12-CLA increases expression of hepatic glycolytic and lipogenic genes and reduces gluconeogenic genes in fasted mice.
Hepatic expression of A) Gck, B) Pklr, C) G6pc, D) Pck1, E) Acc1, F) Fasn, G) Scd1, H) Cd36, I) Mogat1, J) Igfbp1, K) Cpt1a, and L) Ucp2 of overnight fasted mice after 38 days of the special diets. Open columns (control diet), black columns (t10c12-CLA diet), grey columns (c9t11-CLA diet). Data are represented as means +/− SEM of relative values of controls (set at 100%), and analyzed by one-way ANOVA followed by a Tukey posthoc analysis. Different letters indicate significant differences between groups within time point. p<0.05. N= 5-6 mice/group.

References

    1. Gholami Z, Khosravi-Darani K. An overview of conjugated linoleic acid: microbial production and application. Mini Rev Med Chem. 2014;14:734–46. - PubMed
    1. Koba K, Yanagita T. Health benefits of conjugated linoleic acid (CLA). Obes Res Clin Pract. 2014;8:e525–32. - PubMed
    1. De La Torre A, Gruffat D, Durand D, Micol D, Peyron A, Scislowski V, et al. Factors influencing proportion and composition of CLA in beef. Meat Sci. 2006;73:258–68. - PubMed
    1. Lee KN, Kritchevsky D, Pariza MW. Conjugated linoleic acid and atherosclerosis in rabbits. Atherosclerosis. 1994;108:19–25. - PubMed
    1. Nicolosi RJ, Rogers EJ, Kritchevsky D, Scimeca JA, Huth PJ. Dietary conjugated linoleic acid reduces plasma lipoproteins and early aortic atherosclerosis in hypercholesterolemic hamsters. Artery. 1997;22:266–77. - PubMed

Publication types

MeSH terms

Substances

LinkOut - more resources