

Chemical exchange saturation transfer imaging in hepatic encephalopathy
- PMID: 30856541
- PMCID: PMC6411782
- DOI: 10.1016/j.nicl.2019.101743
Chemical exchange saturation transfer imaging in hepatic encephalopathy
Abstract
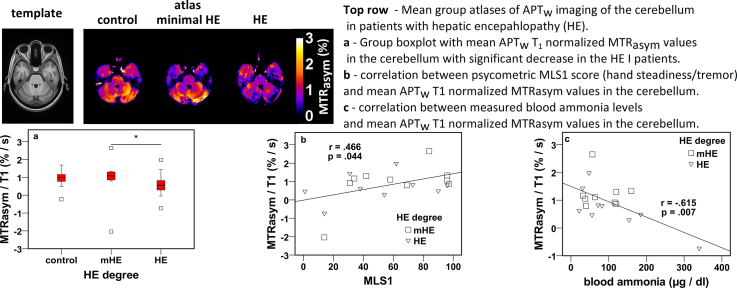
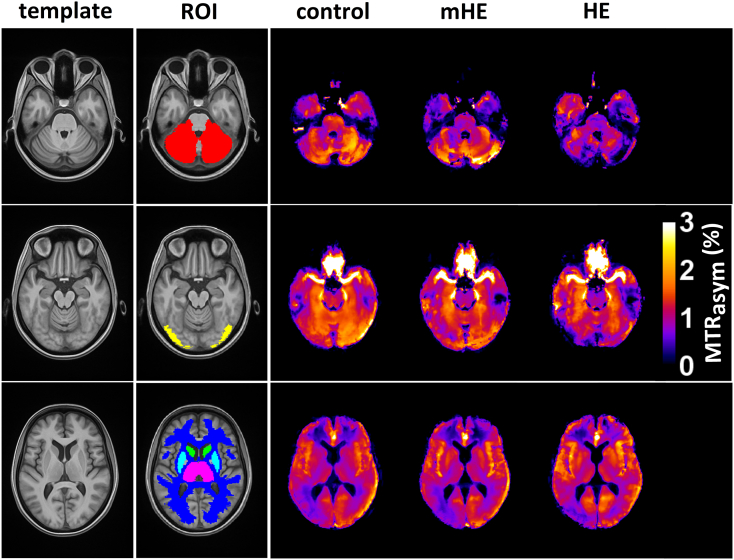
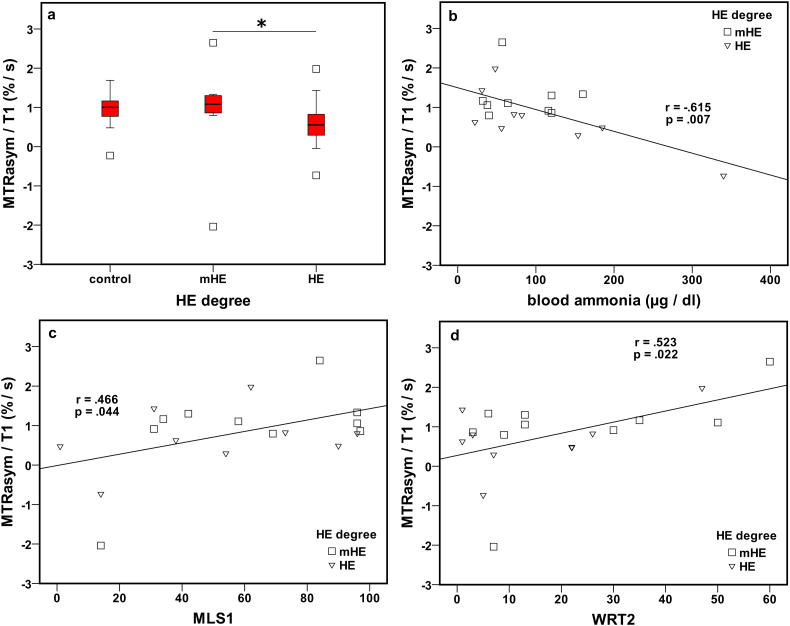
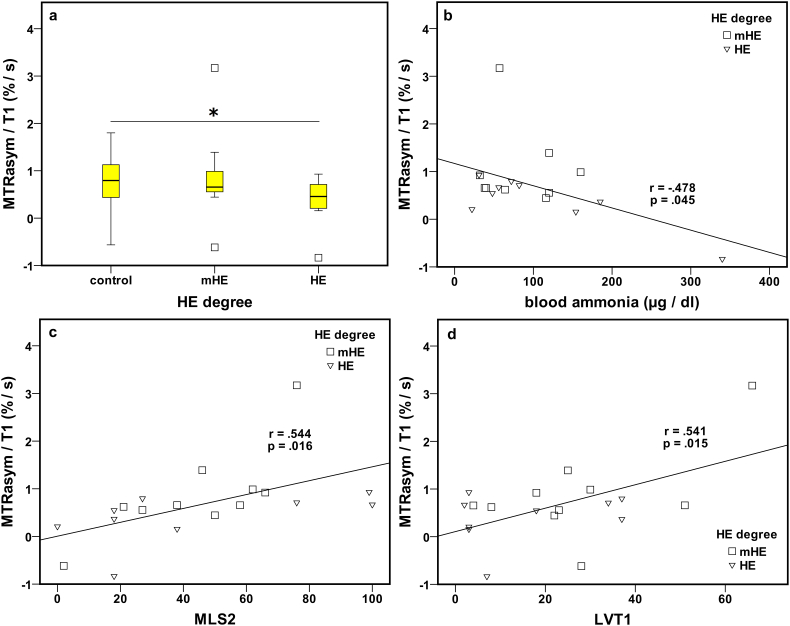
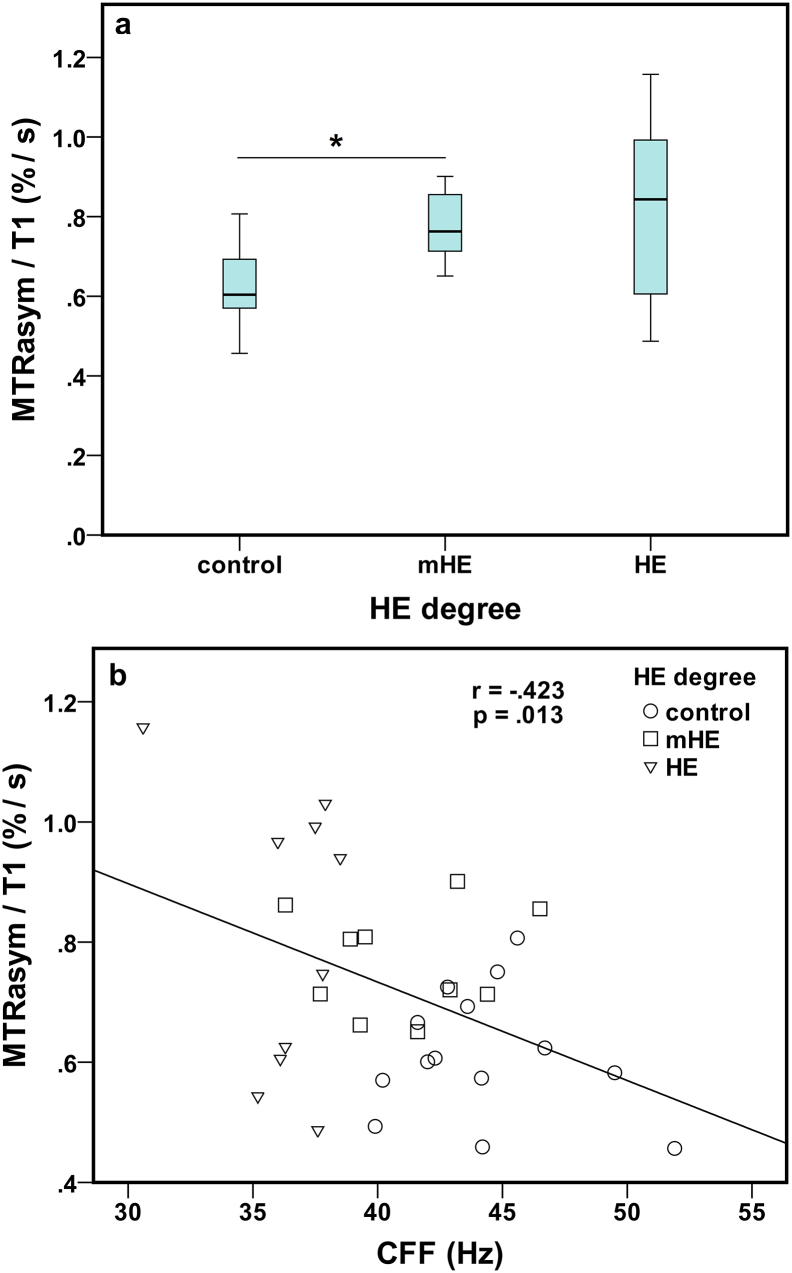
Hepatic encephalopathy (HE) is a common complication in liver cirrhosis and associated with an invasion of ammonia into the brain through the blood-brain barrier. Resulting higher ammonia concentrations in the brain are suggested to lead to a dose-dependent gradual increase of HE severity and an associated impairment of brain function. Amide proton transfer-weighted (APTw) chemical exchange saturation transfer (CEST) imaging has been found to be sensitive to ammonia concentration. The aim of this work was to study APTw CEST imaging in patients with HE and to investigate the relationship between disease severity, critical flicker frequency (CFF), psychometric test scores, blood ammonia, and APTw signals in different brain regions. Whole-brain APTw CEST images were acquired in 34 participants (14 controls, 20 patients (10 minimal HE, 10 manifest HE)) on a 3 T clinical MRI system accompanied by T1 mapping and structural images. T1 normalized magnetization transfer ratio asymmetry analysis was performed around 3 ppm after B0 and B1 correction to create APTw images. All APTw images were spatially normalized into a cohort space to allow direct comparison. APTw images in 6 brain regions (cerebellum, occipital cortex, putamen, thalamus, caudate, white matter) were tested for group differences as well as the link to CFF, psychometric test scores, and blood ammonia. A decrease in APTw intensities was found in the cerebellum and the occipital cortex of manifest HE patients. In addition, APTw intensities in the cerebellum correlated positively with several psychometric scores, such as the fine motor performance scores MLS1 for hand steadiness / tremor (r = 0.466; p = .044) and WRT2 for motor reaction time (r = 0.523; p = .022). Moreover, a negative correlation between APTw intensities and blood ammonia was found for the cerebellum (r = -0.615; p = .007) and the occipital cortex (r = -0.478; p = .045). An increase of APTw intensities was observed in the putamen of patients with minimal HE and correlated negatively with the CFF (r = -0.423; p = .013). Our findings demonstrate that HE is associated with regional differential alterations in APTw signals. These variations are most likely a consequence of hyperammonemia or hepatocerebral degeneration processes, and develop in parallel with disease severity.
Keywords: Amide proton; Ammonia; CEST; CFF; Critical flicker frequency; Liver cirrhosis.
Copyright © 2019 The Authors. Published by Elsevier Inc. All rights reserved.
Figures
Similar articles
-
J-difference GABA-edited MRS reveals altered cerebello-thalamo-cortical metabolism in patients with hepatic encephalopathy.Metab Brain Dis. 2023 Apr;38(4):1221-1238. doi: 10.1007/s11011-023-01174-x. Epub 2023 Feb 2. Metab Brain Dis. 2023. PMID: 36729261 Free PMC article.
-
Improved chemical exchange saturation transfer imaging with real-time frequency drift correction.Magn Reson Med. 2019 May;81(5):2915-2923. doi: 10.1002/mrm.27663. Epub 2019 Jan 30. Magn Reson Med. 2019. PMID: 30697813 Free PMC article.
-
Low visual cortex GABA levels in hepatic encephalopathy: links to blood ammonia, critical flicker frequency, and brain osmolytes.Metab Brain Dis. 2015 Dec;30(6):1429-38. doi: 10.1007/s11011-015-9729-2. Epub 2015 Sep 11. Metab Brain Dis. 2015. PMID: 26359122
-
Ammonia and beyond - biomarkers of hepatic encephalopathy.Metab Brain Dis. 2025 Jan 15;40(1):100. doi: 10.1007/s11011-024-01512-7. Metab Brain Dis. 2025. PMID: 39812958 Free PMC article. Review.
-
MR imaging findings in hepatic encephalopathy.AJNR Am J Neuroradiol. 2008 Oct;29(9):1612-21. doi: 10.3174/ajnr.A1139. Epub 2008 Jun 26. AJNR Am J Neuroradiol. 2008. PMID: 18583413 Free PMC article. Review.
Cited by
-
Pathological Significance and Prognostic Roles of Indirect Bilirubin/Albumin Ratio in Hepatic Encephalopathy.Front Med (Lausanne). 2021 Aug 30;8:706407. doi: 10.3389/fmed.2021.706407. eCollection 2021. Front Med (Lausanne). 2021. PMID: 34527681 Free PMC article.
-
Motion and magnetic field inhomogeneity correction techniques for chemical exchange saturation transfer (CEST) MRI: A contemporary review.NMR Biomed. 2025 Jan;38(1):e5294. doi: 10.1002/nbm.5294. Epub 2024 Nov 12. NMR Biomed. 2025. PMID: 39532518 Review.
-
J-difference GABA-edited MRS reveals altered cerebello-thalamo-cortical metabolism in patients with hepatic encephalopathy.Metab Brain Dis. 2023 Apr;38(4):1221-1238. doi: 10.1007/s11011-023-01174-x. Epub 2023 Feb 2. Metab Brain Dis. 2023. PMID: 36729261 Free PMC article.
-
Hepatic encephalopathy.Nat Rev Dis Primers. 2022 Jun 23;8(1):43. doi: 10.1038/s41572-022-00366-6. Nat Rev Dis Primers. 2022. PMID: 35739133 Review.
References
-
- Avants B.B., Tustison N.J., Song G., Gee J.C. Penn IMage Computing and Science Laboratory; 2009. ANTS: Advanced Open-Source Normalization Tools for Neuroanatomy.
-
- Baumgarten T.J., Neugebauer J., Oeltzschner G., Füllenbach N.D., Kircheis G., Häussinger D., Lange J., Wittsack H.J., Butz M., Schnitzler A. Connecting occipital alpha band peak frequency, visual temporal resolution, and occipital GABA levels in healthy participants and hepatic encephalopathy patients. NeuroImage Clin. 2018;20:347–356. - PMC - PubMed
-
- Butterworth R.F. Complications of cirrhosis III. Hepatic encephalopathy. J. Hepatol. 2000;32:171–180. - PubMed
-
- Butterworth R.F. Neuronal cell death in hepatic encephalopathy. Metab. Brain Dis. 2007;22:309–320. - PubMed
Publication types
MeSH terms
LinkOut - more resources
Full Text Sources
Medical
