. 2019 Jul 5;30(27):275101.
doi: 10.1088/1361-6528/ab0e9c. Epub 2019 Mar 11.

Non-invasive sensitive brain tumor detection using dual-modality bioimaging nanoprobe

Affiliations

Non-invasive sensitive brain tumor detection using dual-modality bioimaging nanoprobe

Yang Liu et al. Nanotechnology. .

Abstract

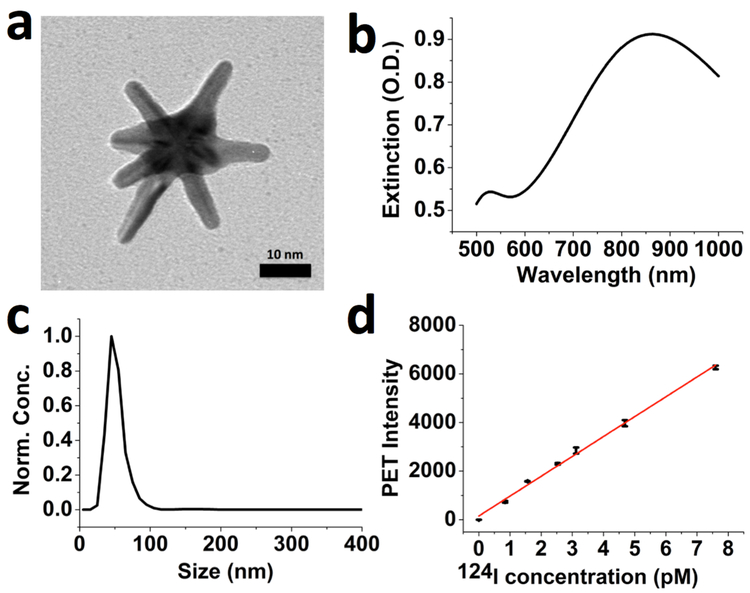
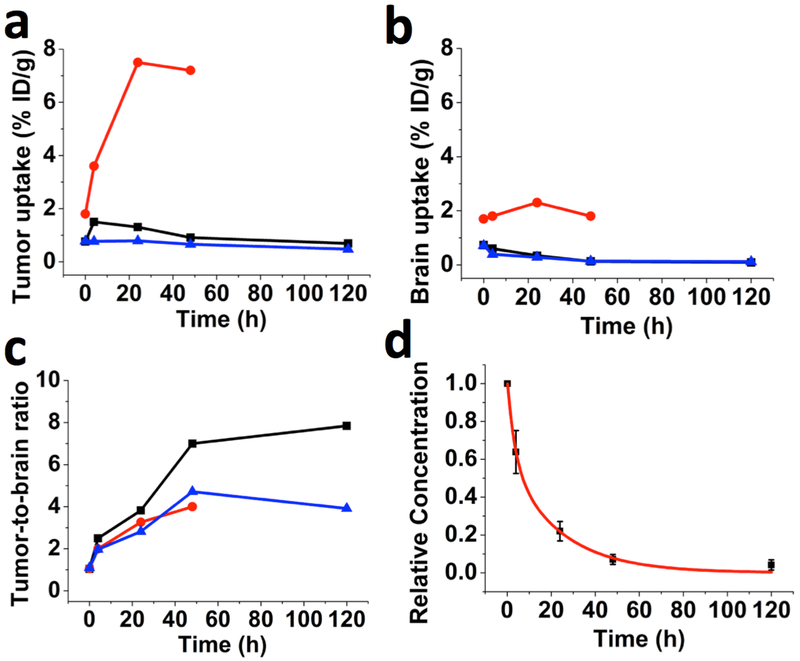
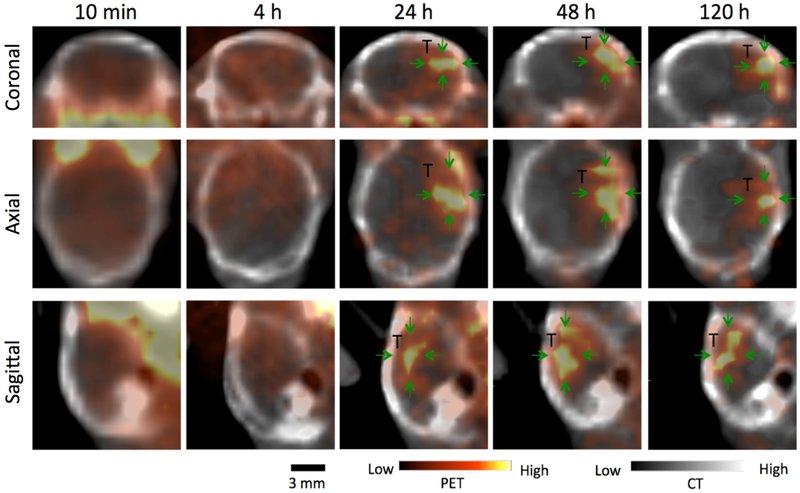
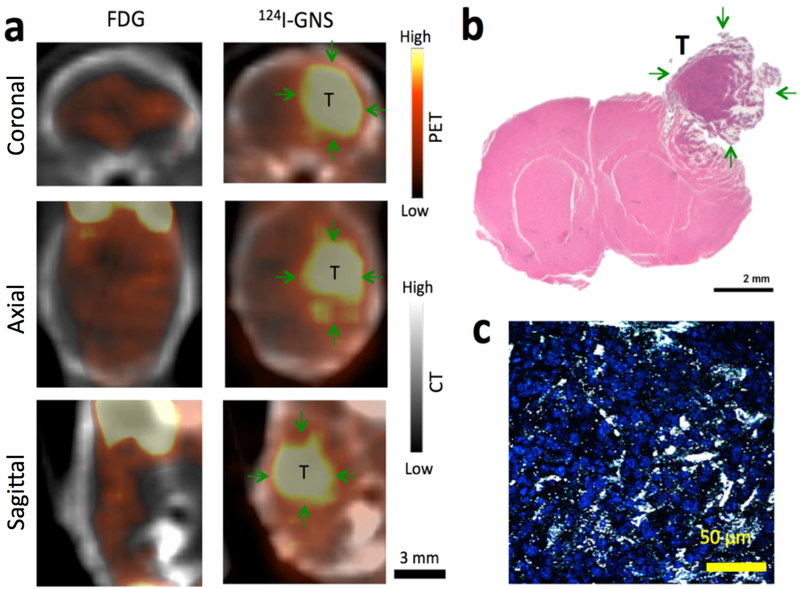
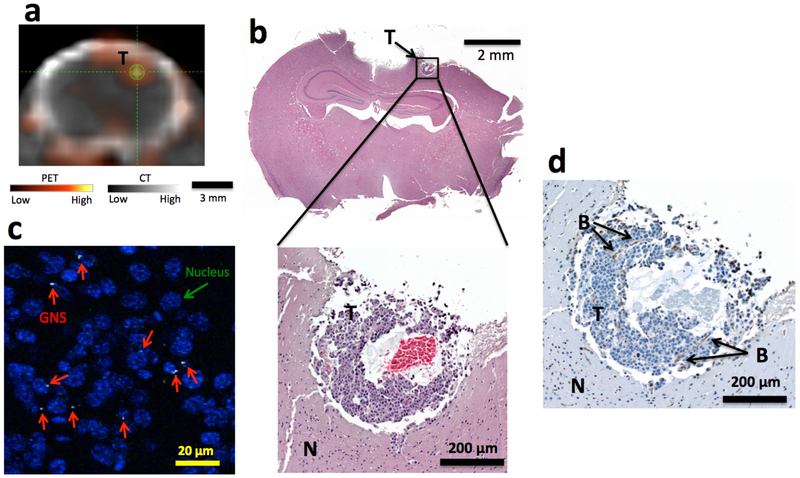
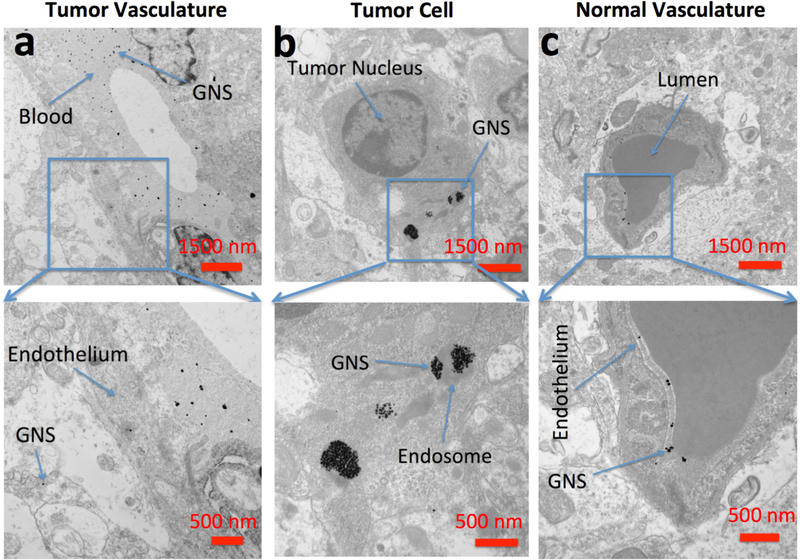
Despite decades of efforts, non-invasive sensitive detection of small malignant brain tumors still remains challenging. Here we report a dual-modality 124I-labeled gold nanostar (124I-GNS) probe for sensitive brain tumor imaging with positron emission tomography (PET) and subcellular tracking with two-photon photoluminescence (TPL) and electron microscopy (EM). Experiment results showed that the developed nanoprobe has potential to reach sub-millimeter intracranial brain tumor detection using PET scan, which is superior to any currently available non-invasive imaging modality. Microscopic examination using TPL and EM further confirmed that GNS nanoparticles permeated the brain tumor leaky vasculature and accumulated inside brain tumor cells following systemic administration. Selective brain tumor targeting by enhanced permeability and retention effect and ultrasensitive imaging render 124I-GNS nanoprobe promise for future brain tumor-related preclinical and translational applications.


Conflict of interest statement

The authors declare no competing financial interests.

Figures

Figure 1.
Figure 1.
Characterization of gold star nanoparticles. (a) Transmission electron microscopy (TEM) image of synthesized GNS nanoparticle with a 10-nm scale bar. (b) VIS-NIR extinction spectrum of 0.2 nM PEGylated GNS aqueous solution. (c) Hydrodynamic size distribution of PEGylated GNS nanoprobes measured by nanoparticle tracking analysis (NTA) method. (d) PET sensitivity evaluation for 124I-GNS. Data points with error bar in black color were experiment results and the red line was linearly fitted from experimental data points. The standard error of the regression was calculated to be 135.68. The fitted equation is y = 817.64x + 151.35 with the adjusted R2 = 0.997. Error bar shows the standard deviation (n=3).
Figure 2.
Figure 2.
GNS uptake in tumor and normal brain tissues measured by PET/CT. The maximum PET signal was measured for brain tumor and its contralateral normal brain tissue. (a) 124I-GNS brain tumor uptake, (b) 124I-GNS normal brain uptake, and (c) tumor-to-normal brain PET signal ratios measured at different time points for 3 mice (Mouse 1, black; Mouse 2, red; Mouse 3, blue) with orthotopic brain tumors. Quantitative results are shown in the Table S2. (d) Nanoprobe relative concentration in blood was measured from dynamic PET/CT scans in the heart at 10 min, 4 h, 24 h, 48 h and 120 h after IV injection and normalized to the concentration value at 10 min. The nanoprobe relative concentrations (black color) are fit to a two-compartment pharmacokinetic model (Adjusted R2 = 0.991) and the fitted curve is in red color. The error bars indicate standard deviations (n=3). Please note that mouse 2 (red) was sacrificed at 48 h time point due to brain tumor symptoms. The high 124I-GNS uptake for mouse 2 (red) might be due to large tumor size (Figure. S3), which results in increased vasculature leakage.
Figure 3.
Figure 3.
PET/CT imaging of 124I-GNS nanoprobes”” in the implanted brain tumor for Mouse 1. Top, middle and bottom rows show coronal, axial and sagittal image, respectively. Significantly higher 124I-GNS uptake in tumor (T; green arrows) compared with contralateral normal brain was observed at 24 h. PET intensity was rescaled for best contrast.
Figure 4.
Figure 4.
Brain tumor detection comparison with 18F-FDG and 124I-GNS using PET/CT scan. (a) Comparison of 18F-FDG and 124I-GNS for brain tumor detection by PET imaging in the same brain tumor-bearing mouse (Mouse 2). The PET/CT scan with 18F-FDG was performed 1 h after injection. The PET/CT scan with 124I-GNS was performed 48 h after injection. The average tumor uptake of the 124I-GNS nanoprobe was 7.2 %ID/g and the T/N ratio was 4.0 while the T/N ratio for 18F-FDG was 1.1. (b) H&E histopathology examination of the brain tumor detected by PET scan; green arrows indicate tumor (T). Tumor was peeled off from brain during tissue harvest process and image was reconstructed to combine tumor with brain. (c) TPL imaging shows GNS (white spots) being inside brain tumor detected from PET scan. The brain tumor section was stained with DAPI (blue) to show cell nuclei. The image represents a 5 μm tissue section.
Figure 5.
Figure 5.
Sub-millimeter brain tumor detection with 124I-GNS. (a) Sub-millimeter brain tumor identified on PET/CT image obtained 48 h post 124I-GNS injection in Mouse 3. The average tumor uptake was 0.66 %ID/g and the T/N was 4.7. (b) H&E histopathology examination confirmed the identified brain tumor region from PET/CT imaging. The identified tumor was less than 0.5 millimeter in size. (c). TPL imaging showed that the GNS (white spots, marked by red arrow) were inside the tumor. The tumor cell nuclei were stained with DAPI (blue). (d) CD31 immunohistochemical staining confirmed the presence of endothelial cells and the developing vasculature. Two blood vessels (B) parallel to the tumor section surface were identified. (T), tumor; (N) normal brain.
Figure 6.
Figure 6.
Electron microscopy of brain tumor 24 hours after intravenous administration of GNS (a) TEM imaging of GNS in the extracellular space of the tumor region. (b) TEM imaging of GNS in endosomes within brain tumor cells. (c) TEM imaging of GNS in normal brain vasculature. PEGylated GNS nanoparticles leak through brain tumor vasculature, diffuse into tumor extracellular space and are endocytosed inside tumor cells. In normal brain, GNS were confined inside the vasculature wall, consistent with an intact BBB. Scale bar, 1,500 nm (top row) and 500 nm (bottom row).
Figure 7.
Figure 7.
Toxicity study of mice after GNS IV administration. (a) Average bodyweight of animals in each cohort of 6-month toxicity study was monitored weekly; no significant difference was found between control (black) and GNS IV injection groups (20 mg/kg (red) or 80 mg/kg dose (blue)). (b) Blood chemistry test results for mice 6 months after IV injection of PBS (black), GNS with a dose of 20 mg/kg (red) and 80 mg/kg (blue). Error bar represents standard deviation (n = 4). F4/80 immunohistochemistry (IHC) staining (brown) was performed for spleen (c) and liver (d) to show macrophages (Kupffer cells). The GNS (black spots) nanoparticles were found overlaid with macrophage cells (brown).
Figure 8.
Figure 8.
Histopathology examination of peripheral organs. Histopathology following IV administration of GNS H&E histopathology examination of brain, heart, liver, kidney, spleen and lung from mice obtained 6 months after PBS or GNS injection (20 mg/kg or 80 mg/kg dose). Scale bar, 100 μm. The GNS (black color) nanoparticles were seen inside spleen for mice in both 20 mg/kg and 80 mg/kg dose groups. H&E evaluation was unremarkable and demonstrated healthy and intact tissue.

Similar articles

Cited by

References

    1. Aiken R 2014. Semin Oncol 41 438–445 - PubMed
    1. Bidros DS, Vogelbaum MA 2009. Neurotherapeutics 6 539–546 - PMC - PubMed
    1. Siegel RL, Miller KD, Jemal A. 2018. CA Cancer J. Clin 68 7–30 - PubMed
    1. Ostrom QT, Gittleman H, Fulop J, Liu M, Blanda R, Kromer C, Wolinsky Y, Kruchko C, Barnholtz-Sloan JS 2015. Neuro. Oncol 17 1–62 - PMC - PubMed
    1. Cheng Y, Dai Q, Morshed RA, Fan XB, Wegscheid ML, Wainwright DA, Han Y, Zhang LJ, Auffinger B, Tobias AL, Rincon E, Thaci B, Ahmed AU, Warnke PC, He C, Lesniak MS 2014. Small. 10 5137–5150 - PMC - PubMed