. 2019 Mar 8;11(3):334.
doi: 10.3390/cancers11030334.

Heterogeneous Nuclear Ribonucleoproteins A1 and A2 Function in Telomerase-Dependent Maintenance of Telomeres

Affiliations

Heterogeneous Nuclear Ribonucleoproteins A1 and A2 Function in Telomerase-Dependent Maintenance of Telomeres

Tong-Hong Wang et al. Cancers (Basel). .

Abstract

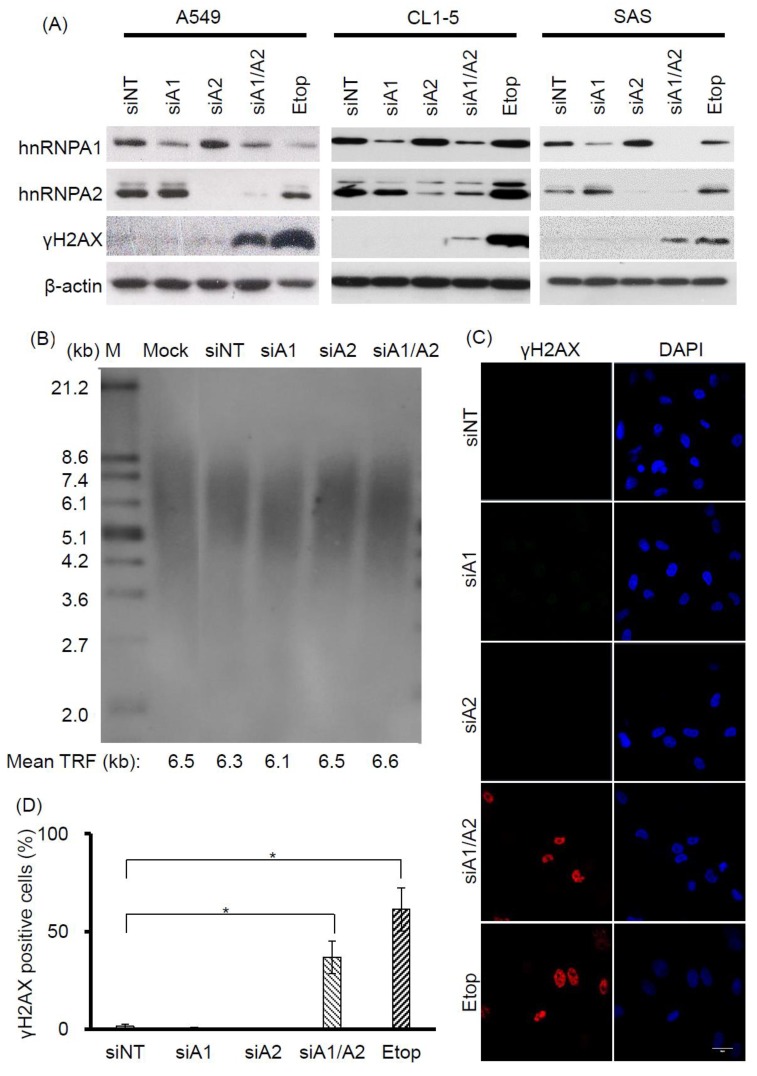
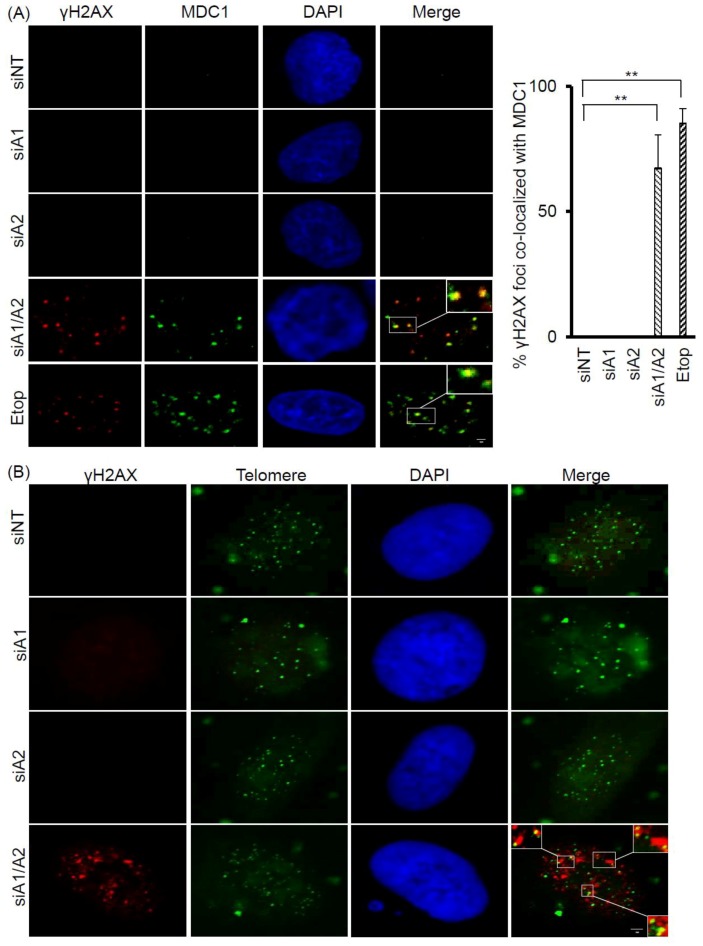
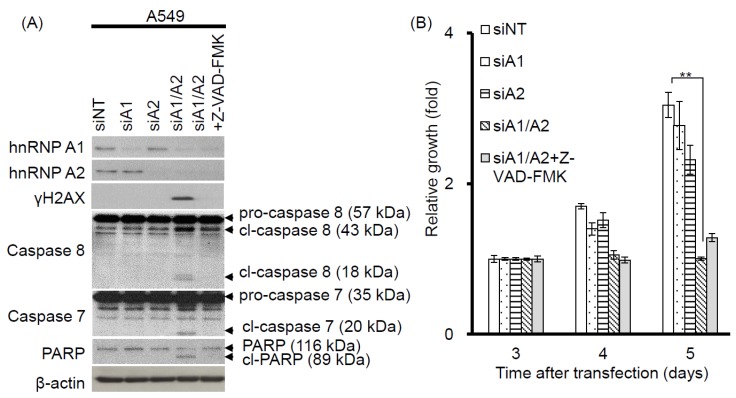
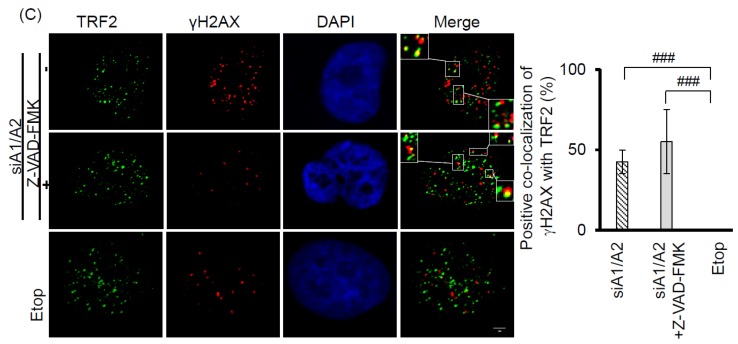
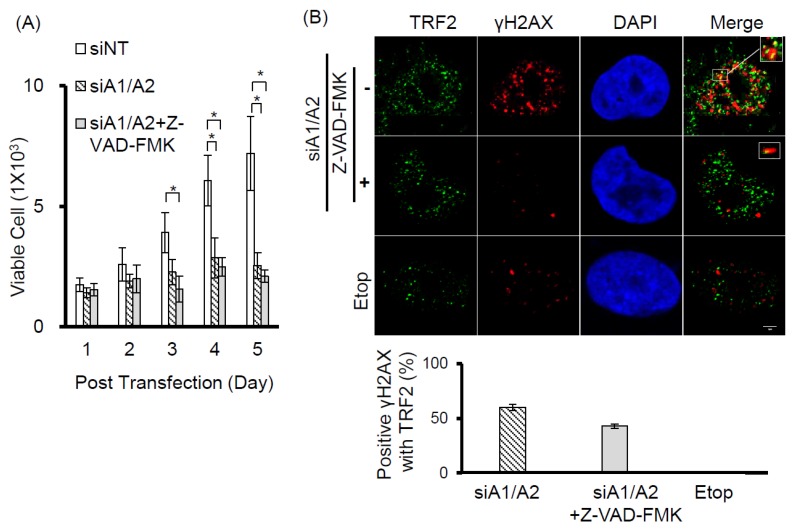
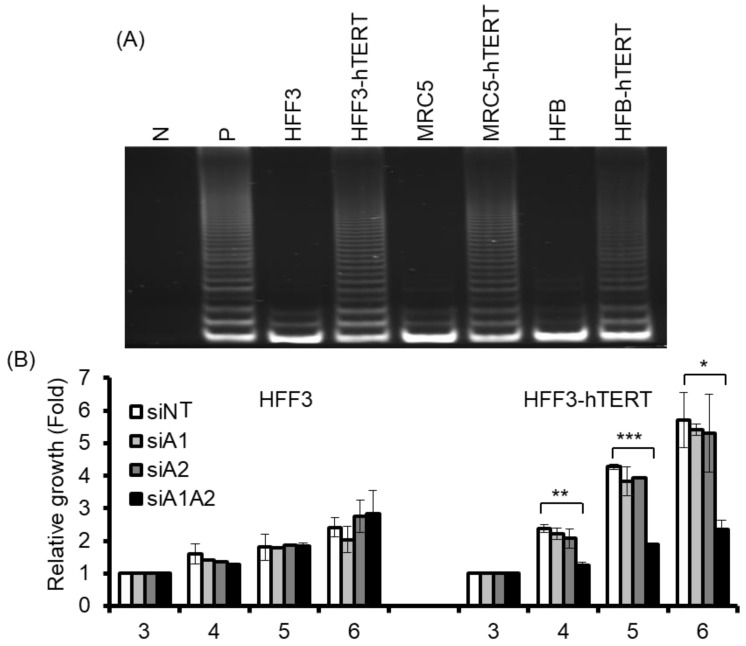
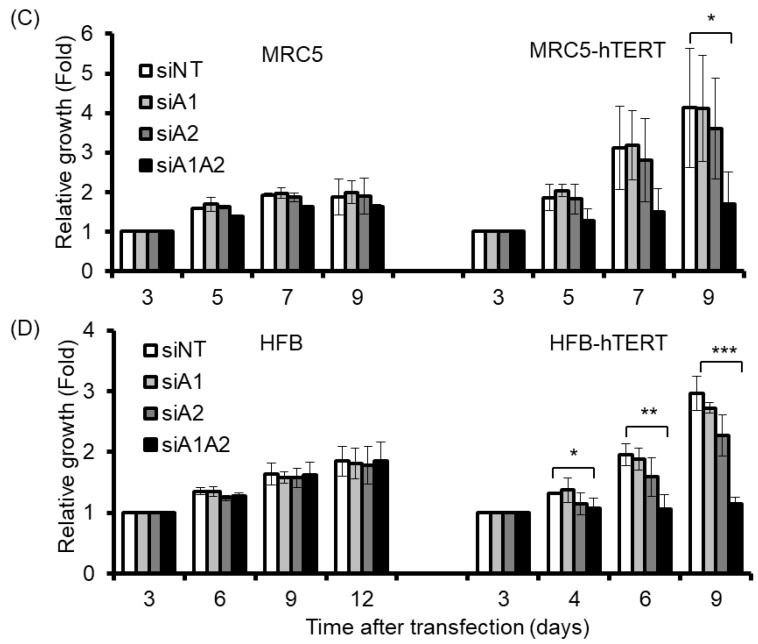
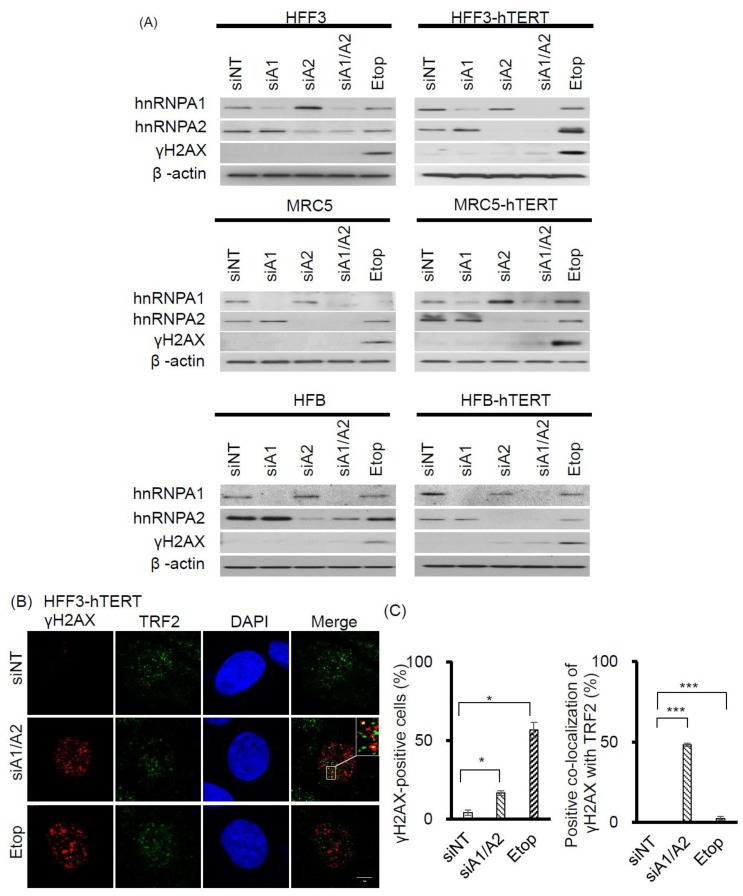
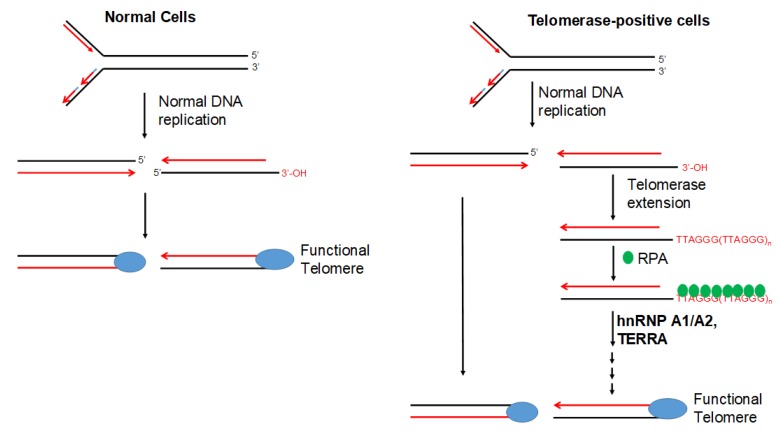
The A/B subfamily of heterogeneous nuclear ribonucleoproteins (hnRNPs A/B), which includes hnRNP A1, A2/B1, and A3, plays an important role in cell proliferation. The simultaneous suppression of hnRNP A1/A2, but not the suppression of hnRNP A1 or A2 alone, has been shown to inhibit cell proliferation and induce apoptosis in cancer cells, but not in mortal normal cells. However, the molecular basis for such a differential inhibition of cell proliferation remains unknown. Here, we show that the simultaneous suppression of hnRNP A1 and hnRNP A2 resulted in dysfunctional telomeres and induced DNA damage responses in cancer cells. The inhibition of apoptosis did not alleviate the inhibition of cell proliferation nor the formation of dysfunctional telomeres in cancer cells depleted of hnRNP A1/A2. Moreover, while proliferation of mortal normal fibroblasts was not sensitive to the depletion of hnRNP A1/A2, the ectopic expression of hTERT in normal fibroblasts rendered these cells sensitive to proliferation inhibition, which was associated with the production of dysfunctional telomeres. Our study demonstrates that hnRNP A1 and A2 function to maintain telomeres in telomerase-expressing cells only, suggesting that the maintenance of functional telomeres in telomerase-expressing cancer cells employs factors that differ from those used in the telomerase-negative normal cells.

Keywords: DNA damage responses; apoptosis; hnRNP A1/A2; telomerase; telomeres.


Conflict of interest statement

The authors declare that they have no conflicts of interest.

Figures

Figure 1
Figure 1
Effects of depleting hnRNP A1 and/or hnRNP A2 on induction of DNA damage response (DDR). (A) Induction of γH2AX. A549, CL1-5, and SAS cells were transfected with siRNA targeting hnRNP A1 (siA1), hnRNP A2 (siA2), both hnRNP A1 and A2 (siA1/A2), or with a non-targeting sequence (siNT) for 72 h. Cell lysates were analyzed for expression levels of hnRNP A1, hnRNP A2, and γH2AX by western blotting. β-Actin served as a loading control, and cells treated with 50 μM etoposide (Etop) for 12 h served as a positive control; (B) Effect of depleting hnRNP A1 and hnRNP A2 on telomere length in A549 cells. A549 cells were transfected with siRNA targeting hnRNP A1 (siA1), hnRNP A2 (siA2), both hnRNP A1 and A2 (siA1/A2), or with a non-targeting sequence (siNT) for 96 h. The genomic DNA was purified and subjected to telomeric restriction fragment (TRF) length assay, as described in the materials and methods section. Mean TRF length is indicated at the bottom of each lane. Lane M: molecular weight markers. Mock was treated with transfection reagent only; (C) A549 cells were fixed and immunostained for γH2AX (red), and nuclei were counterstained with 4′,6-diamidino-2-phenylindole (DAPI, blue). Cells treated with 50 μM etoposide (Etop) for 12 h served as a positive control. The scale bar equals 20 μm. (D) The percentage of nuclei showing positive staining for γH2AX was determined from an analysis of ~100 nuclei from each experiment. Positive γH2AX staining is operationally defined here as the detection of 3 or more γH2AX foci in a nucleus. Data shown are mean ± SD from 3 independent experiments. * p < 0.05 versus siNT control.
Figure 2
Figure 2
Co-localization of γH2AX with MDC1 and telomere DNA in A549 cells depleted of hnRNP A1/A2. (A) A549 cells were transfected with siRNA targeting hnRNP A1 (siA1), hnRNP A2 (siA2), both hnRNP A1 and A2 (siA1/A2), or with a non-targeting sequence (siNT) for 72 h. Cells were fixed and immunostained for γH2AX (red) and MDC1 (green), and nuclei were counterstained with DAPI (blue). A549 cells treated with 50 μM etoposide (Etop) for 12 h served as a positive control. The percentage of γH2AX foci that co-localized with MDC1 (see marked squares for examples) was determined from 50 γH2AX-positive nuclei; data from 3 experiments are summarized in the right panel. ** p < 0.01 versus siNT control; The bar equals 2 μm.(B) Cells were stained for γH2AX (red) and then for telomeric DNA using FISH with fluorescein isothiocyanate (FITC) -conjugated oligonucleotides (green). γH2AX foci that colocalized with telomere DNA are illustrated in the boxed regions. The scale bar equals 2 μm.
Figure 3
Figure 3
Effects of the apoptosis inhibitor Z-VAD-FMK on the induction of apoptosis, cell proliferation, and DDR. (A) A549 cells were transfected with siRNAs targeting hnRNP A1 (siA1), hnRNP A2 (siA2), both hnRNP A1 and A2 (siA1/A2), or with a non-targeting sequence (siNT) for 48 h. Cells transfected with siA1/A2 were cultured in the presence or absence of 20 mM Z-VAD-FMK for 24 h, while other transfected cells were cultured in the absence of Z-VAD-FMK for 24 h. Cell lysates were then analyzed for expression of hnRNP A1, A2, and γH2AX, as well as for the cleavage products of caspase-7 (cl-caspase-7), caspase-8 (cl-caspase-8), and PARP (cl-PARP) by western blotting. β-Actin served as a loading control; (B) Treated cells were cultured in regular medium and monitored for cell proliferation using trypan blue staining. The results shown are pooled from 2 independent experiments. ** p < 0.01, significant difference from siNT control; (C) Cells were fixed and immunostained for γH2AX (red) and TRF2 (Telomeric repeat-binding factor 2, green), and nuclei were counterstained with DAPI (blue). γH2AX foci that co-localized with TRF2 are indicated in the boxed regions. A549 cells treated with 50 μM etoposide (Etop) for 12 h served as a positive control. The percentage of nuclei showing co-localization of γH2AX with TRF2 was determined from analysis of 50 γH2AX -positive nuclei from each experiment. The results shown in the right panel are mean ± SD from 3 independent experiments. ### p < 0.001, significant difference from etoposide control. The scale bar equals 2 μm.
Figure 3
Figure 3
Effects of the apoptosis inhibitor Z-VAD-FMK on the induction of apoptosis, cell proliferation, and DDR. (A) A549 cells were transfected with siRNAs targeting hnRNP A1 (siA1), hnRNP A2 (siA2), both hnRNP A1 and A2 (siA1/A2), or with a non-targeting sequence (siNT) for 48 h. Cells transfected with siA1/A2 were cultured in the presence or absence of 20 mM Z-VAD-FMK for 24 h, while other transfected cells were cultured in the absence of Z-VAD-FMK for 24 h. Cell lysates were then analyzed for expression of hnRNP A1, A2, and γH2AX, as well as for the cleavage products of caspase-7 (cl-caspase-7), caspase-8 (cl-caspase-8), and PARP (cl-PARP) by western blotting. β-Actin served as a loading control; (B) Treated cells were cultured in regular medium and monitored for cell proliferation using trypan blue staining. The results shown are pooled from 2 independent experiments. ** p < 0.01, significant difference from siNT control; (C) Cells were fixed and immunostained for γH2AX (red) and TRF2 (Telomeric repeat-binding factor 2, green), and nuclei were counterstained with DAPI (blue). γH2AX foci that co-localized with TRF2 are indicated in the boxed regions. A549 cells treated with 50 μM etoposide (Etop) for 12 h served as a positive control. The percentage of nuclei showing co-localization of γH2AX with TRF2 was determined from analysis of 50 γH2AX -positive nuclei from each experiment. The results shown in the right panel are mean ± SD from 3 independent experiments. ### p < 0.001, significant difference from etoposide control. The scale bar equals 2 μm.
Figure 4
Figure 4
Effects of early apoptosis inhibition on DDR and cell proliferation. (A) A549 cells were transfected with siRNA targeting sequences for both hnRNP A1 and A2 (siA1/A2) in the presence or absence of 20 mM of Z-VAD-FMK. Cells transfected with a non-target sequence (siNT) in the absence of Z-VAD-FMK served as a control. The transfected cells were cultured and monitored for cell proliferation using trypan blue staining. The data shown are pooled from 2 independent experiments; (B) After 72 h of transfection, the cells were fixed and immunostained for γH2AX (red) and TRF 2 (green), and the nuclei were counterstained with DAPI (blue). The foci of γH2AX that co-localized with TRF2 are indicated by marked squares. Cells treated with 50 μM of etoposide (Etop) for 12 h served as a negative control. The percentage of positive co-localization of γH2AX with TRF2 was determined from analysis of 30 γH2AX-positive nuclei from each experiment. The data shown in the bottom panel are from 2 independent experiments. * p < 0.05 versus siNT control. The scale bar equals 2 μm.
Figure 5
Figure 5
Effects of suppressing hnRNP A1 and/or A2 on cell proliferation of normal fibroblasts and hTERT-immortalized normal fibroblasts. (A) Cell lysates from normal fibroblasts (HFF3, MRC5, and HFB) and hTERT-immortalized normal fibroblasts (hFF3-hTERT, MRC5-hTERT, and HFB-hTERT) were assayed for telomerase activity, as described in the materials and methods section. N represents a negative control with no cell extract, while P is a positive control with cell extract from telomerase-positive A549 cells; (BD) Normal fibroblasts and hTERT-immortalized normal fibroblasts were transfected with siRNA targeting hnRNPA1 (siA1), hnRNPA2 (siA2), both hnRNP A1 and A2 (siA1/A2), or with a non-targeting sequence (siNT) for 72 h. Transfected cells were cultured in regular medium and monitored for cell proliferation using trypan blue staining. The results shown are pooled from 2 independent experiments. * p < 0.05, ** p < 0.01 and *** p < 0.001 versus siNT control.
Figure 5
Figure 5
Effects of suppressing hnRNP A1 and/or A2 on cell proliferation of normal fibroblasts and hTERT-immortalized normal fibroblasts. (A) Cell lysates from normal fibroblasts (HFF3, MRC5, and HFB) and hTERT-immortalized normal fibroblasts (hFF3-hTERT, MRC5-hTERT, and HFB-hTERT) were assayed for telomerase activity, as described in the materials and methods section. N represents a negative control with no cell extract, while P is a positive control with cell extract from telomerase-positive A549 cells; (BD) Normal fibroblasts and hTERT-immortalized normal fibroblasts were transfected with siRNA targeting hnRNPA1 (siA1), hnRNPA2 (siA2), both hnRNP A1 and A2 (siA1/A2), or with a non-targeting sequence (siNT) for 72 h. Transfected cells were cultured in regular medium and monitored for cell proliferation using trypan blue staining. The results shown are pooled from 2 independent experiments. * p < 0.05, ** p < 0.01 and *** p < 0.001 versus siNT control.
Figure 6
Figure 6
Effects of suppressing hnRNP A1 and/or A2 on DDR in normal fibroblasts and hTERT-immortalized normal fibroblasts. (A) Normal fibroblasts (HFF3, MRC5, and HFB) and hTERT-immortalized normal fibroblasts (HFF3-hTERT, MRC5-hTERT, and HFB-hTERT) were transfected with siRNA targeting hnRNPA1 (siA1), hnRNPA2 (siA2), both hnRNP A1 and A2 (siA1/A2), or with a non-targeting sequence (siNT). After 72 h, cell lysates were analyzed for expression levels of hnRNP A1, hnRNP A2, and γH2AX by Western blotting. β-Actin served as a loading control, and cells treated with 50 μM etoposide (Etop) for 12 h served as a positive control; (B) Transfected HFF3-hTERT cells were fixed and immunostained for γH2AX (red) and TRF2 (green), and nuclei were counterstained with DAPI (blue). HFF3-hTERT cells treated with 50 μM etoposide (Etop) for 12 h were included as a control; the scale bar equals 5 μm. (C) The percentage of nuclei positive for γH2AX staining was determined from analysis of ~100 nuclei from each experiment; the data shown in the left panel are from 2 independent experiments. The percentage of γH2AX co-localized with TRF2 was determined from analysis of 50 γH2AX -positive nuclei from each experiment; the results shown in the right panel are from 2 independent experiments. * p < 0.05 and *** p < 0.001 versus siNT control.
Figure 7
Figure 7
Model of telomerase-dependent maintenance of telomeres. Normal cells do not express telomerase, and the ends of their chromosomes are replicated by regular DNA replication enzymes before being assembled into functional telomeres. In telomerase-positive cells (e.g., cancer cells), the 3′ G-rich single-strand tail can be extended by synthesis of TTAGG repeats, which are thought to be initially bound by RPA. The extended long G-rich strand subsequently serves as a template for lagging-strand DNA synthesis before being assembled into a functional telomere. In this model, hnRNP A1/A2 is thought to facilitate lagging-strand synthesis and/or assembly of a functional telomere structure, possibly by acting together with TERRA to displace RPA.

References

    1. Blasco M.A. The epigenetic regulation of mammalian telomeres. Nat. Rev. Genet. 2007;8:299–309. doi: 10.1038/nrg2047. - DOI - PubMed
    1. Liu D., O’Connor M.S., Qin J., Songyang Z. Telosome, a mammalian telomere-associated complex formed by multiple telomeric proteins. J. Biol. Chem. 2004;279:51338–51342. doi: 10.1074/jbc.M409293200. - DOI - PubMed
    1. Palm W., de Lange T. How shelterin protects mammalian telomeres. Ann. Rev. Genet. 2008;42:301–334. doi: 10.1146/annurev.genet.41.110306.130350. - DOI - PubMed
    1. Blackburn E.H. Structure and function of telomeres. Nature. 1991;350:569–573. doi: 10.1038/350569a0. - DOI - PubMed
    1. Campisi J., Kim S.H., Lim C.S., Rubio M. Cellular senescence, cancer and aging: The telomere connection. Exp. Gerontol. 2001;36:1619–1637. doi: 10.1016/S0531-5565(01)00160-7. - DOI - PubMed

LinkOut - more resources