. 2019 Mar 8;8(3):330.
doi: 10.3390/jcm8030330.

Clinical Stratification of High-Grade Ovarian Serous Carcinoma Using a Panel of Six Biomarkers

Affiliations

Clinical Stratification of High-Grade Ovarian Serous Carcinoma Using a Panel of Six Biomarkers

Swapnil C Kamble et al. J Clin Med. .

Abstract

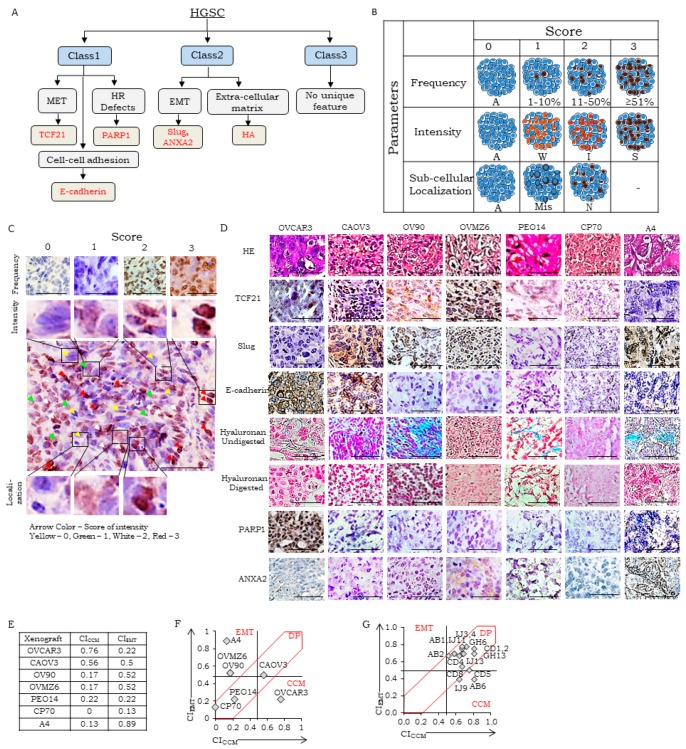
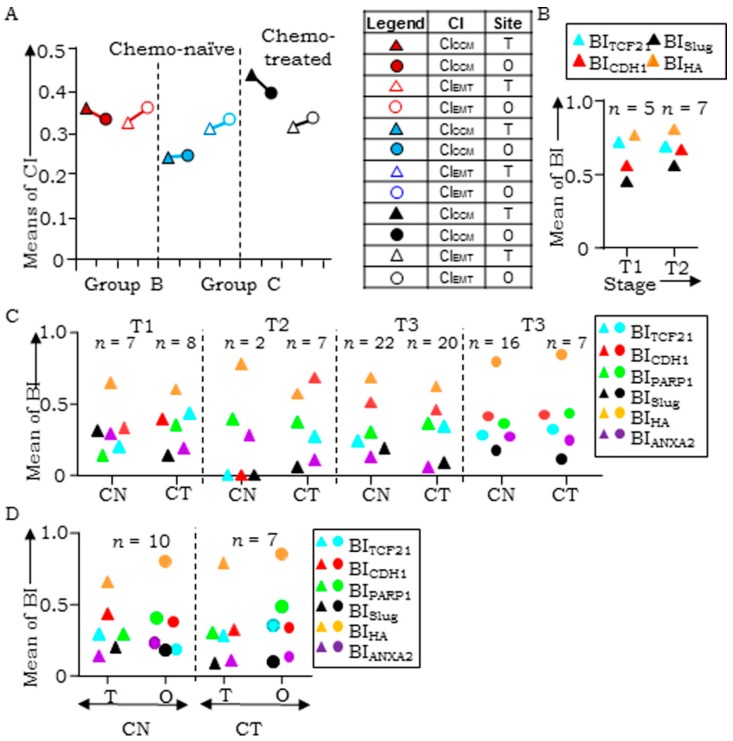
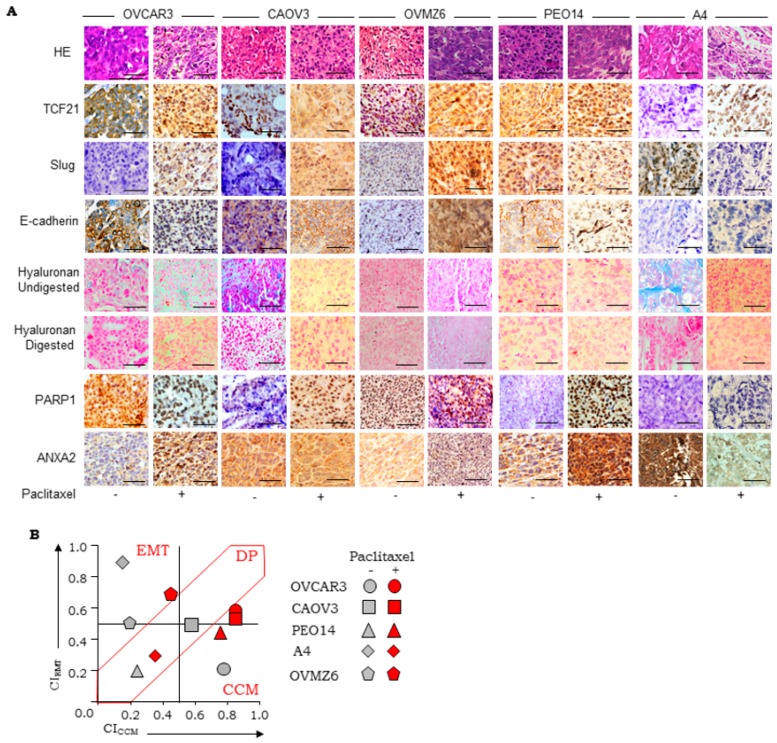
Molecular stratification of high-grade serous ovarian carcinoma (HGSC) for targeted therapy is a pertinent approach in improving prognosis of this highly heterogeneous disease. Enabling the same necessitates identification of class-specific biomarkers and their robust detection in the clinic. We have earlier resolved three discrete molecular HGSC classes associated with distinct functional behavior based on their gene expression patterns, biological networks, and pathways. An important difference revealed was that Class 1 is likely to exhibit cooperative cell migration (CCM), Class 2 undergoes epithelial to mesenchymal transition (EMT), while Class 3 is possibly capable of both modes of migration. In the present study, we define clinical stratification of HGSC tumors through the establishment of standard operating procedures for immunohistochemistry and histochemistry based detection of a panel of biomarkers including TCF21, E-cadherin, PARP1, Slug, AnnexinA2, and hyaluronan. Further development and application of scoring guidelines based on expression of this panel in cell line-derived xenografts, commercial tissue microarrays, and patient tumors led to definitive stratification of samples. Biomarker expression was observed to vary significantly between primary and metastatic tumors suggesting class switching during disease progression. Another interesting feature in the study was of enhanced CCM-marker expression in tumors following disease progression and chemotherapy. These stratification principles and the new information thus generated is the first step towards class-specific personalized therapies in the disease.

Keywords: biomarkers; epithelial-to-mesenchymal transition; high-grade serous ovarian carcinoma; immunohistochemistry; molecular stratification; scoring system.


Conflict of interest statement

The authors declare no conflict of interest.

Figures

Figure 1
Figure 1
Class associations and marker scoring guidelines; (A) rationale for class-specific biological function based putative marker selection, MET: Mesenchymal-to-epithelial transition, HR: Homologous Recombination mediated DNA Damage Repair, EMT: Epithelial-to-mesenchymal transition; (B) schematic of scoring guidelines for IHC based staining of nuclear markers (TCF21, PARP1, Slug), A: Absent, W: Weak, I: Intermediate, S: Strong, Mis: Mislocalised, N: normal localization. A similar approach was used for scoring of membrane markers (E-cadherin, ANXA2) except that sub-cellular location was scored either 1 (cytoplasm) or 2 (cell membrane), while extracellular expression of hyaluronan fibers (evaluated as blue color developed by Alcian blue staining that is lost on hyaluronidase) was scored 1 in distant tumor stroma, and 2 in tumor epithelial cell nests. Scoring and analyses of marker expression in xenografts and TMAs; (C) Tissues and markers for Scoring of Frequency–0: A4 (TCF21), 1: OV90 (Slug), 2: OVCAR3 (PARP1), 3: A4 (Slug); scoring of intensity and localization-CAOV3 (TCF21), different regions representing scores of 0–3 (intensity) and 0–2 (localization), Scale bar is 50 µm; (D) Representative micrographs of HGSC xenografts for: Row 1-H&E (hematoxylin and eosin) stained section while Rows 2,3,4,7,8 represent IHC-based identification of TCF21, Slug, E-cadherin, PARP1, and ANXA2; Rows 5 and 6 represent HC-based identification of HA fibers in untreated and hyaluronidase digested xenograft sections respectively, scale bar is 50 µm; (E) class Indices of xenografts; (F,G) scatter plots of CICCM vs. CIEMT in xenografts and high-grade serous ovarian carcinoma (HGSC) cases in TMA respectively. DP-double positive; CCM-cooperative cell migration.
Figure 2
Figure 2
(A) Scatter plot of CICCM vs. CIEMT distribution for chemo-naïve cases with tumors detected in ovary (Ov), fallopian tube (FT), and omentum (O) (left panel), and a reference case-chart (right panel), (B) graphical representation of class-specification of Group A tumors, (C) scatter plots of CICCM vs. CIEMT distribution for single chemo-naïve or -treated (red and blue shapes respectively) tumors from-ovary △ & fallopian tube ⬜, (D) omentum ⭘ and ascites cell blocks ◇, (E) graphical representation of Group B tumors (chemo-naïve-N; chemo-treated-T). EMT-epithelial to mesenchymal transition; DP-double positive; CCM-cooperative cell migration.
Figure 3
Figure 3
Class switching detected in cases with (A) ovarian and omental tumors tissues of (i) chemo-naïve (n = 17) and (ii) chemo-treated (n = 16) patient cohort; (B) class switching in tumors collected from patients (n = 6) prior to chemo-treatment (filled shapes) and post chemo-therapy (empty shapes) as determined through ascites (diamond), primary tumor (triangle), and omentum (circle). EMT-epithelial to mesenchymal transition; DP-double positive; DN-double negative; CCM-cooperative cell migration.
Figure 4
Figure 4
HGSC progression-associated marker expression. (A) Plot comparing CICCM with CIEMT of tumors of Groups B and C respectively; (B) plot comparing biomarker (BI) scores for TCF21, E-cadherin, Slug, and HA in chemo-naïve ovarian tumors present in TMA for stages T1 and T2; (C) plot for chemo-naïve (left) and treated (right) paired ovarian (T)-omental (O) tumors; (D) plot for chemo-naïve (CN) and treated (CT) tumors at stages T1, T2, and T3 in ovarian △ and omental ⭘ tumors.
Figure 5
Figure 5
(A). Paclitaxel exposure alters scoring marker panel in HGSC cell line derived xenografts. Representative images of HGSC xenograft (control and paclitaxel treated) sections for Row 1-HE (hematoxylin and eosin), Rows 2,3,4,7,8 represent IHC-based detection of TCF21, Slug, E cadherin, PARP1, and ANXA2, Rows 5 and 6 represent HC-based identification of HA fibers in untreated and hyaluronidase digested sections respectively, scale bars-50 μm; (B) scatter plots of CICCM vs. CIEMT derived from xenograft (control-grey and paclitaxel treated-red) scoring. EMT-epithelial to mesenchymal transition; DP-double positive; CCM-cooperative cell migration.
Figure 6
Figure 6
Comparison of HGSC stratification approaches. (A) Proteomics-based TCGA HGSC tumors stratification in 5 sub-groups by Zhang et al. 2016 (169 cases) and Coscia et al. 2016 (84 cases) and transcriptomics based HGSC stratification into three classes (Gardi et al. 2014); (B) comparison of Gardi et al. 2014 vs. Zhang et al., 2016; (C) comparison of Gardi et al. 2014 vs. Coscia et al. 2016.

References

    1. Weigelt B., Reis-Filho J.S., Swanton C. Genomic analyses to select patients for adjuvant chemotherapy: Trials and tribulations. Ann. Oncol. 2012;23:211–218. doi: 10.1093/annonc/mds323. - DOI - PubMed
    1. Bass A.J., Thorsson V., Shmulevich I., Reynolds S.M., Miller M., Bernard B., Hinoue T., Laird P.W., Curtis C., Shen H., et al. Comprehensive molecular characterization of gastric adenocarcinoma. Nature. 2014;513:202–209. doi: 10.1038/nature13480. - DOI - PMC - PubMed
    1. Gorgun G., Calabrese E., Hideshima T., Ecsedy J., Perrone G., Mani M., Ikeda H., Bianchi G., Hu Y., Cirstea D., et al. A novel aurora-A kinase inhibitor MLN8237 induces cytotoxicity and cell cycle arrest in multiple experimental multiple myeloma model. Blood. 2010;115:5202–5213. doi: 10.1182/blood-2009-12-259523. - DOI - PMC - PubMed
    1. Manfredi M.G., Ecsedy J.A., Chakravarty A., Silverman L., Zhang M., Hoar K.M., Stroud S.G., Chen W., Shinde V., Huck J.J., et al. Characterization of alisertib (MLN8237), an investigational small-molecule inhibitor of Aurora A kinase using novel in vivo pharmacodynamic assays. Clin. Cancer Res. 2011;17:7614–7624. doi: 10.1158/1078-0432.CCR-11-1536. - DOI - PubMed
    1. Cidon E.U., Ellis S.G., Inam Y., Adeleke S., Zarif S., Geldart T. Molecular targeted agents for gastric cancer: A step forward towards personalized therapy. Cancers. 2013;5:64–91. doi: 10.3390/cancers5010064. - DOI - PMC - PubMed