. 2019 Mar 12:8:e43599.
doi: 10.7554/eLife.43599.

A multicellular way of life for a multipartite virus

Affiliations

A multicellular way of life for a multipartite virus

Anne Sicard et al. Elife. .

Abstract

A founding paradigm in virology is that the spatial unit of the viral replication cycle is an individual cell. Multipartite viruses have a segmented genome where each segment is encapsidated separately. In this situation the viral genome is not recapitulated in a single virus particle but in the viral population. How multipartite viruses manage to efficiently infect individual cells with all segments, thus with the whole genome information, is a long-standing but perhaps deceptive mystery. By localizing and quantifying the genome segments of a nanovirus in host plant tissues we show that they rarely co-occur within individual cells. We further demonstrate that distinct segments accumulate independently in different cells and that the viral system is functional through complementation across cells. Our observation deviates from the classical conceptual framework in virology and opens an alternative possibility (at least for nanoviruses) where the infection can operate at a level above the individual cell level, defining a viral multicellular way of life.

Keywords: evolution; genome; infectious disease; microbiology; multipartite virus; plant; population genetics; virus; virus-host interaction.


Conflict of interest statement

AS, EP, RG, MV, MY, CU, MP, SG, YM, SB No competing interests declared

Figures

Figure 1.
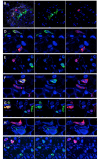
Figure 1.. Localization of distinct FBNSV segments in individual cells.
The FBNSV genome comprises eight single-stranded circular DNA segments (A). The size and name of the segments and encoded proteins are indicated inside the circles. Black stem-loops and blue arrows indicate the replication origins and the coding regions, respectively. The function of each segment is described in Grigoras et al. (2009): DNA-C, cell cycle resetting; DNA-M, within plant viral movement; DNA-N, nuclear shuttle protein; DNA-R, replication; DNA-S, coat protein/encapsidation; DNA-U1, U2 and U4, unknown. B-I show cross sections of infected faba bean petioles, with phloem (ph, the only tissue infected by nanoviruses), and xylem (xy) bundles indicated in B. Pairs of segments are green- and red-FISH probed as indicated in each micrograph. The fluorochromes incorporated into the probes are inverted in B and C for control. Color channels are merged in all images but C where green and red are shown merged and separated to evidence the accumulation of the segment S in cells where the segment R is not detected (exemplified by white arrows). Split channel images corresponding to images B and D-I are shown in Figure 1—figure supplement 1. Nuclei are DAPI-blue stained. Horizontal bars = 10 microns.
Figure 1—figure supplement 1.
Figure 1—figure supplement 1.. Split color channel images corresponding to images of Figure 1.
All images and their associated letters correspond to those shown in Figure 1. Merged channel images (left panels) are the same as in Figure 1. Split green and red channel images are shown in central and right panels, respectively.
Figure 1—figure supplement 2.
Figure 1—figure supplement 2.. Co-occurrence of segments in individual cells does not depend on time of infection.
We questioned whether the spatial segregation of segments is transient and could fade with time, all segments finally accumulating together in most cells at late stages of infection. As indicated in Table 1, we collected infected petioles and analyzed (and quantified) the localization of the segments pair R/S at early (11-12dpi), intermediate (20 dpi) and late (25–27 dpi) stages of infection. We here use the available data to show that, in our experimental conditions, the timing of infection did not significantly increase the frequency of co-occurrence of segments within individual cells. The proportion of cells containing the two segments S and R over the total number of cells containing either of them is plotted against time of infection. Each point depicts the situation within one petiole from one plant infected independently and harvested at the indicated dpi. The regression equation, the correlation coefficient, the determination coefficient and the p-value are indicated.
Figure 2.
Figure 2.. Independent accumulation of FBNSV segments in individual cells.
(A) labeling of two distinct regions of the same segment R by a red and green fluorescent probe, respectively. Green and red channels are shown merged (left) and separated (center and right). Nuclei are DAPI-stained in blue. Horizontal bar is 10 microns. The average intensity of the green fluorescence within individual cells is plotted against that of the red in B and C. Green and red probes are targeted against two distinct regions of the same segment R in (B), and against two distinct segments, respectively S and R in (C). The analyzed cells are from petiole N°42 for the positive control in (B) and from petiole N°5 for the pair R/S in (C). The same analysis from three additional petioles for the control (also see Figure 2—figure supplement 1) and nine additional petioles for the segments pair R/S are summarized in Table 1. Panel D plots the ratio of the frequency of two segments of a pair (estimated by qPCR on total DNA extracted from infected tissues) against the ratio of the number of cells they respectively infect within eight petioles from eight different infected plants (data provided in Supplementary file 1: Table S1).
Figure 2—figure supplement 1.
Figure 2—figure supplement 1.. Reliability of the fluorescence quantification method.
Respective green and red labeling of two distinct regions of the segment R have been quantified in individual cells from cross-sections of the infected petiole N°43. Images used for this quantification were either acquired immediately after labeling with a resolution setting of 512 × 512 (A), or two weeks later with a resolution setting of 1024 × 1024 (B). The intensity values of the green fluorescence are plotted against those of the red fluorescence and the regression formulae and R2 are indicated. The correlation coefficient r and the p-value of the regressions are respectively 0.9381 and 2.81e-23 in (A), and 0.9424 and 4.49e-22 in (B).
Figure 3.
Figure 3.. Accumulation of the protein M-Rep in cells containing either segment S or segment R.
Segment R (A) or S (B) is FISH-labeled with a green fluorescent probe whereas the M-Rep protein is immuno-labeled with a red fluorochrome. Green and red channels are shown separated (top and middle) and merged (bottom). Nuclei are DAPI-stained in blue. Horizontal bar is 10 microns. Yellow arrows point at cells where both the DNA segment and the protein M-Rep are detected, whereas red arrows exemplify cases where only M-Rep is detectable. The boxplots (C) are constructed from Supplementary file 1: Table S1. The proportion of cells with the S segment that also contain the R segment (green left boxplot, estimated from 10 petioles) is compared to the proportion of cells with the S segment that also contain the protein M-Rep (middle orange boxplot, estimated from 14 petioles). The proportion of individual cells with detectable R segment that also contain the protein M-Rep was estimated from 4 infected petioles (blue right boxplot). Difference between left green boxplot and orange middle boxplot is highly significant (GLM model, p-value (>χ12) = 2.94e-12); that between middle orange boxplot and right blue boxplot is not (GLM model, p-value (>χ12) = 0.55).
Figure 3—figure supplement 1.
Figure 3—figure supplement 1.. Distinct copies of the same segment accumulate in distinct cells.
Allelic markers mys2 and mys7 inserted in segment N (A), and mys1 and mys8 inserted in segment S (B) were probed with specific green or red oligonucleotide probes. The sequence of each probe and its associated fluorochrome are provided in Supplementary file 1: Table S2. Red and green arrows point at cells where solely the red or the green fluorescence is detected. Yellow arrows point at cells where both fluorescences are detected. Horizontal bars = 10 microns. Nuclei are DAPI-stained in blue. Below images, the table indicates (from left to right): (i) the code number of the petioles analyzed, (ii) the relative frequency of the alleles estimated by qPCR within each petiole as described in the Materials and methods section, (iii) the number of cells where solely one of the alleles could be detected, (iv) the number of cells where solely the other allele could be detected, and (v) the number of cells where the two alleles were detected together. Petiole N°49, 50, 51 and 52 were analyzed independently. Cross sections from petioles 44, 45 and 46, and from petioles 47 and 48 were pooled before both FISH and qPCR analyses.
Author response image 1.
Author response image 1.. Attempt at detecting viral segments S and R in agro-infiltrated region of the stem.
Trunks of faba bean stems agro-infiltrated with a mixture of agro-bacteria containing the eight FBNSV segments were sectioned and FISH-processed exactly as described in the Materials and methods section. Green-labeled S segments and Red-labeled R segments are visible solely in the petiole sections from systemically infected upper part of the plant (a) and not in the agro-infiltrated section of the stem (b-e). The wound (w) inflicted by the agro-infiltration process induces autofluorescence of the plant tissue that appears as a line of green and red fluorescence at the boundary of the wound (b). No fluorescent cells could be observed at three distinct dates, 3, 5 or 10 dpi, for which representative images are respectively shown in (c), (d) and (e). Horizontal bar is 50 micrometers.

Similar articles

Cited by

References

    1. Brakke MK, Black LM, Wyckoff RWG. The sedimentation rate of potato yellow-dwarf virus. American Journal of Botany. 1951;38:332–342. doi: 10.1002/j.1537-2197.1951.tb14832.x. - DOI
    1. Brooke CB. Population diversity and collective interactions during influenza virus infection. Journal of Virology. 2017;91:e01164-17. doi: 10.1128/JVI.01164-17. - DOI - PMC - PubMed
    1. Deuschle K, Kepp G, Jeske H. Differential methylation of the circular DNA in geminiviral minichromosomes. Virology. 2016;499:243–258. doi: 10.1016/j.virol.2016.09.024. - DOI - PubMed
    1. Faulkner C. Plasmodesmata and the symplast. Current Biology. 2018;28:R1374–R1378. doi: 10.1016/j.cub.2018.11.004. - DOI - PubMed
    1. Folimonova SY, Tilsner J. Hitchhikers, highway tolls and roadworks: the interactions of plant viruses with the phloem. Current Opinion in Plant Biology. 2018;43:82–88. doi: 10.1016/j.pbi.2018.02.001. - DOI - PubMed

Publication types