. 2019 Mar 12:8:e41431.
doi: 10.7554/eLife.41431.

Functional proteomic atlas of HIV infection in primary human CD4+ T cells

Affiliations

Functional proteomic atlas of HIV infection in primary human CD4+ T cells

Adi Naamati et al. Elife. .

Abstract

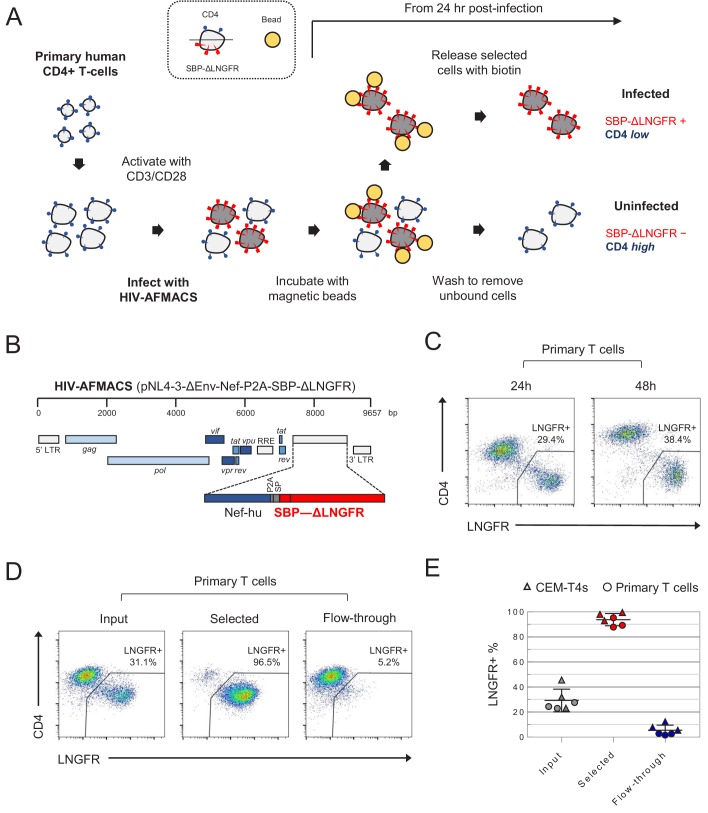
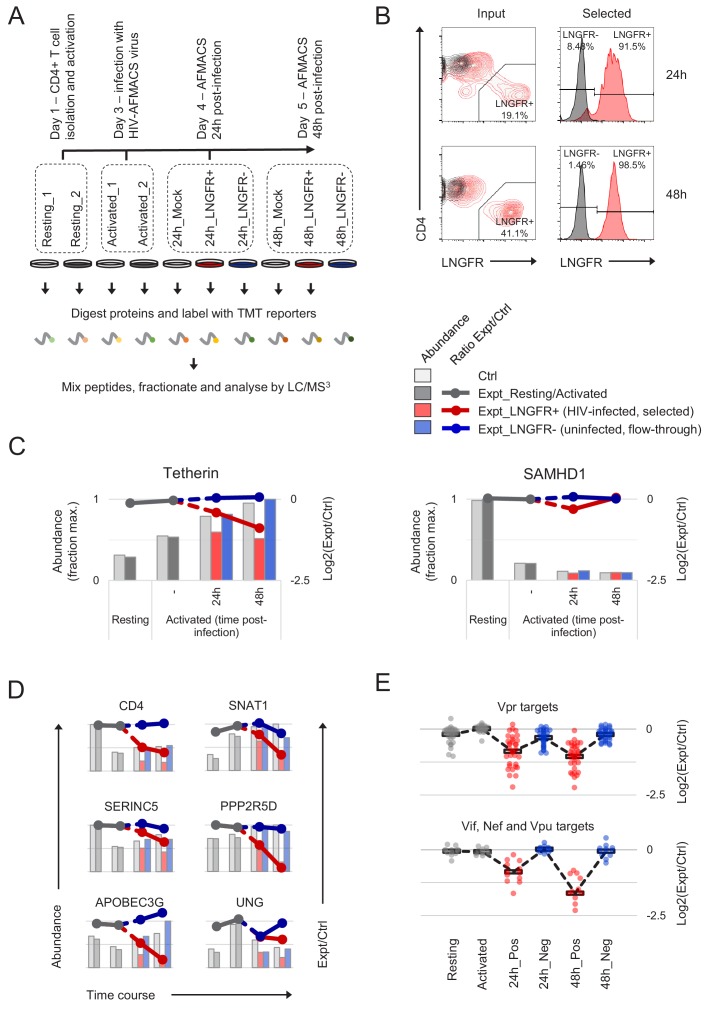
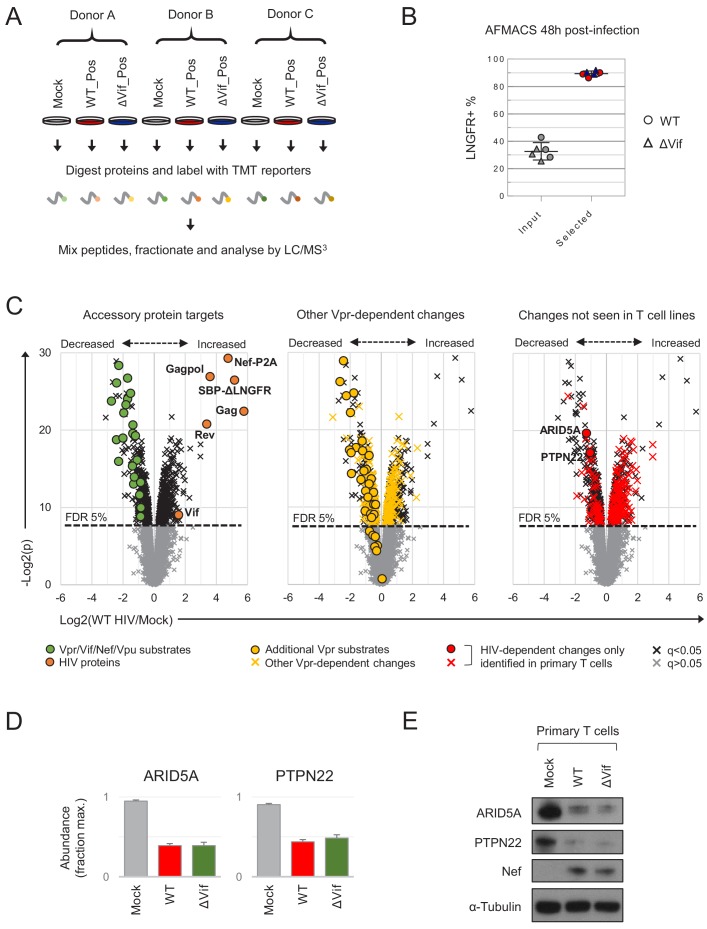
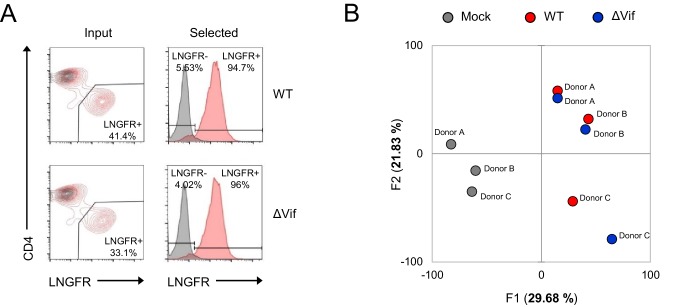
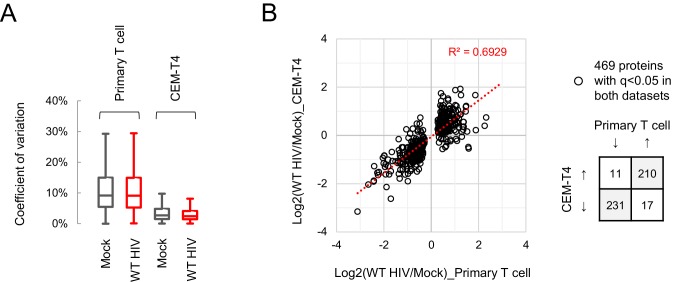
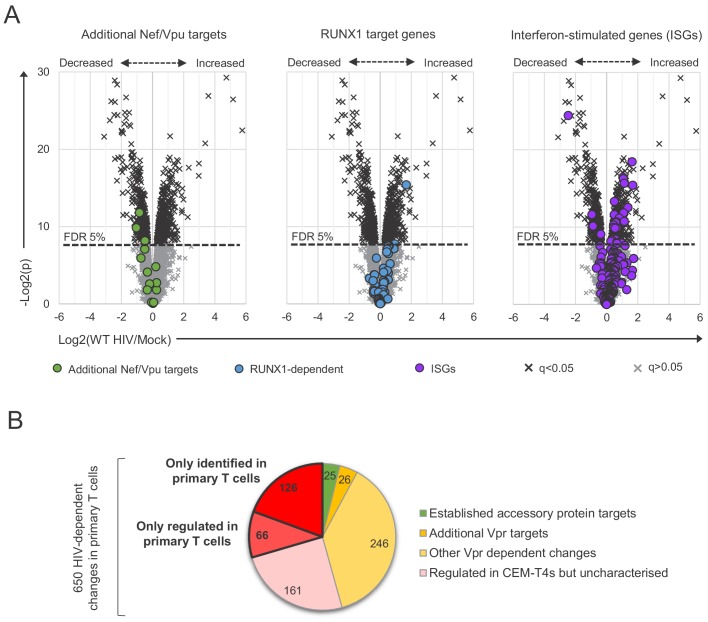
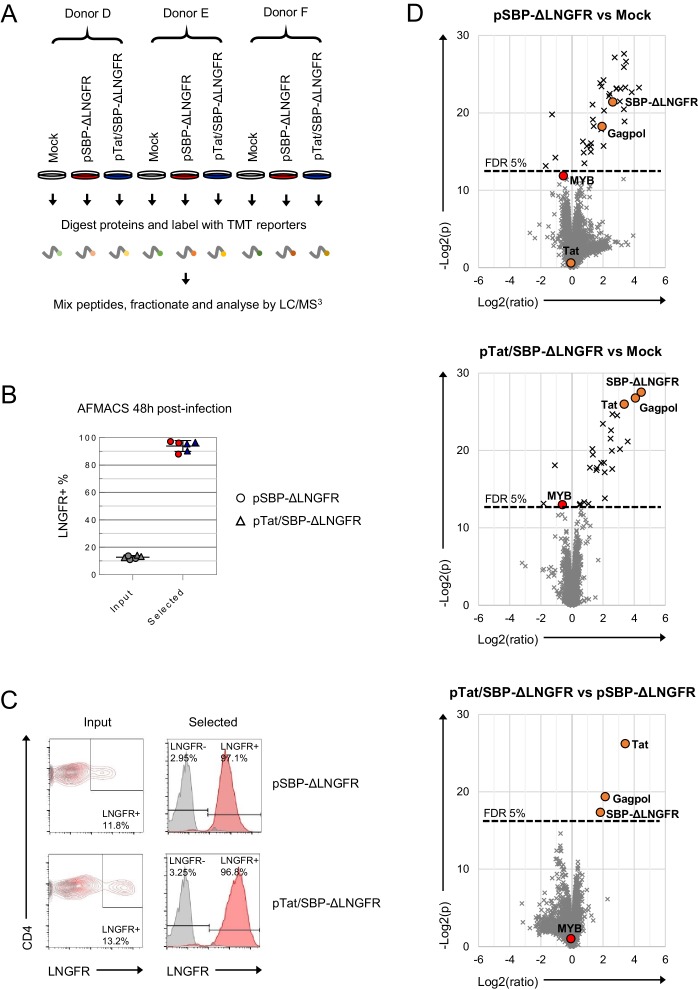
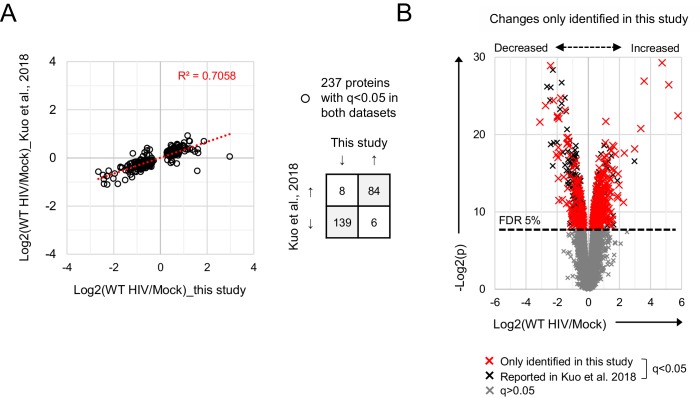
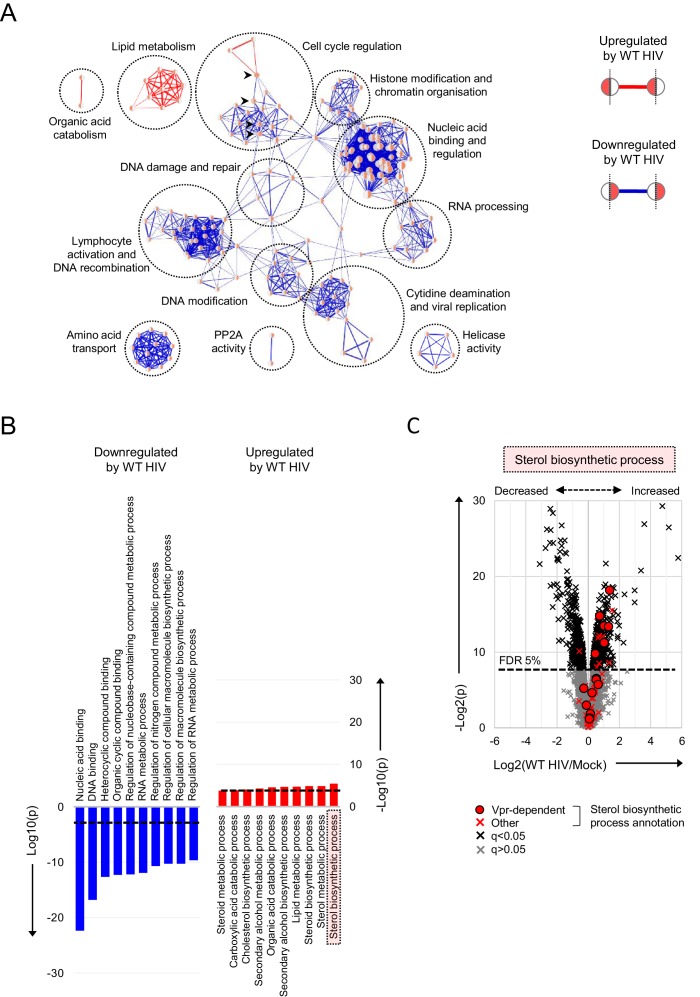
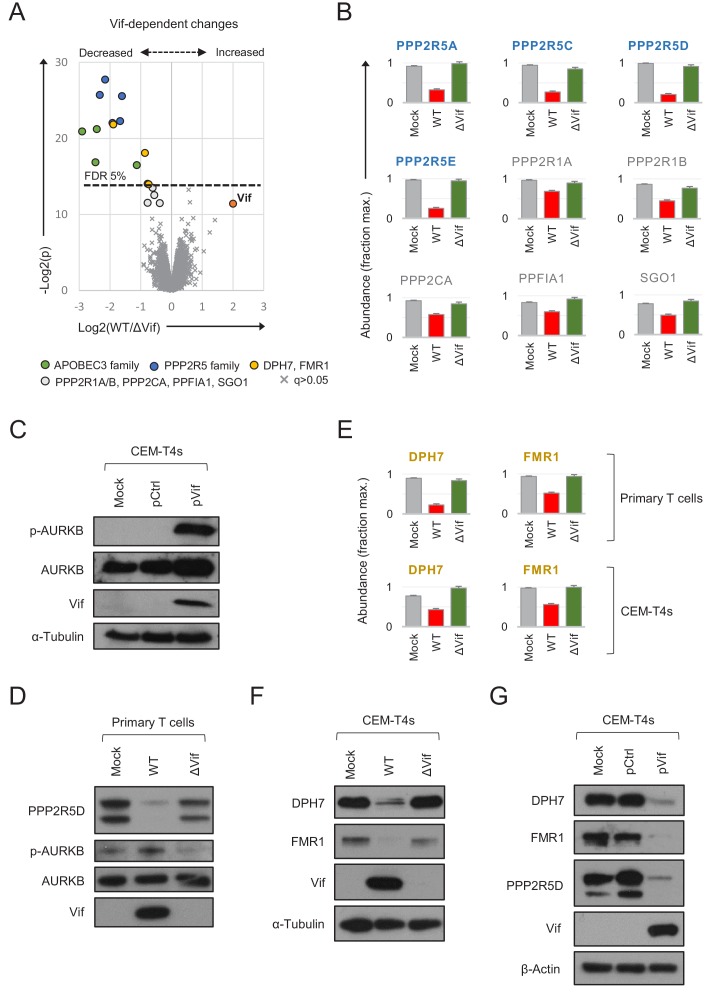
Viruses manipulate host cells to enhance their replication, and the identification of cellular factors targeted by viruses has led to key insights into both viral pathogenesis and cell biology. In this study, we develop an HIV reporter virus (HIV-AFMACS) displaying a streptavidin-binding affinity tag at the surface of infected cells, allowing facile one-step selection with streptavidin-conjugated magnetic beads. We use this system to obtain pure populations of HIV-infected primary human CD4+ T cells for detailed proteomic analysis, and quantitate approximately 9000 proteins across multiple donors on a dynamic background of T cell activation. Amongst 650 HIV-dependent changes (q < 0.05), we describe novel Vif-dependent targets FMR1 and DPH7, and 192 proteins not identified and/or regulated in T cell lines, such as ARID5A and PTPN22. We therefore provide a high-coverage functional proteomic atlas of HIV infection, and a mechanistic account of host factors subverted by the virus in its natural target cell.

Keywords: HIV; human; immunology; infectious disease; inflammation; magnetic cell selection; microbiology; primary human CD4+ T cell; proteomics; virus.


Conflict of interest statement

AN, JW, EG, SM, PL, NM No competing interests declared

Figures

Figure 1.
Figure 1.. Antibody-free magnetic selection of HIV-infected primary T cells.
(A) Workflow for AFMACS-based magnetic selection of HIV-infected primary T cells. (B) Schematic of HIV-AFMACS provirus (pNL4-3-ΔEnv-Nef-P2A-SBP-ΔLNGFR). For simplicity, reading frames are drawn to match the HXB2 HIV-1 reference genome. Length is indicated in base pairs (bp). The complete sequence is available in Supplementary file 1. Nef-hu, codon-optimised Nef; RRE, Rev response element; SP, signal peptide. (C) Expression of cell surface SBP-∆LNGFR and CD4 on primary T cells 24 or 48 hr post-infection with HIV-AFMACS. Cells were stained with anti-LNGFR and anti-CD4 antibodies at the indicated time points and analysed by flow cytometry. (D–E) Magnetic sorting of HIV-infected (red, LNGFR+, CD4 low) and uninfected (blue, LNGFR-, CD4 high) cells. Cells were separated using AFMACS 48 hr post-infection with HIV-AFMACS and analysed as in (C). Representative (D) and summary (E) data from six independent experiments in CEM-T4s (triangles) and primary T cells (circles) are shown, with means and 95% confidence intervals (CIs).
Figure 1—figure supplement 1.
Figure 1—figure supplement 1.. Initial screen of SBP-ΔLNGFR-expressing HIV viruses.
(A–B) Expression of GFP (pNL4-3-ΔEnv-EGFP only) or cell surface SBP-∆LNGFR (all other constructs) and CD4 on CEM-T4s 48 hr post-infection with indicated pNL4-3-ΔEnv-based viruses (A). Cells were stained with anti-LNGFR and anti-CD4 antibodies and analysed by flow cytometry. gRNA length is shown for each construct, and compared with functional viral titre derived from the % LNGFR +cells (B). Each construct is numbered, and the three proviruses selected for further testing are highlighted (red, bold text). pNL4-3-ΔEnv-EGFP was included as a control (green).
Figure 1—figure supplement 2.
Figure 1—figure supplement 2.. Time course evaluation of selected SBP-ΔLNGFR-expressing HIV viruses.
Expression of GFP (pNL4-3-ΔEnv-EGFP only) or cell surface SBP-∆LNGFR (all other constructs) and CD4 or tetherin in CEM-T4s 24 or 48 hr post-infection with HIV-AFMACS. Cells were stained with anti-LNGFR and anti-CD4 or anti-tetherin antibodies at the indicated time points and analysed by flow cytometry (red, infected cells; grey, mock infected cells). Schematics indicate the location/setting of SBP-ΔLNGFR within each provirus, with ORFs and non-coding features coloured as in Figure 1B (but with Nef in black and EGFP in green). For simplicity, reading frames are drawn to match the HXB2 HIV-1 reference genome. The final HIV-AFMACS virus is highlighted (pNL4-3-ΔEnv-Nef-P2A-SBP-ΔLNGFR, bold text). pNL4-3-ΔEnv-EGFP was included as a control.
Figure 2.
Figure 2.. Temporal proteomic analysis of HIV infection in primary T cells.
(A) Overview of time course proteomic experiment. Control (pale grey, resting/activated/mock) and experimental (dark grey, resting/activated; red, LNGFR+, HIV-infected, selected; blue, LNGFR-, uninfected, flow-through) cells are indicated for each condition/time point. (B) Magnetic sorting of HIV-infected (red, LNGFR+, selected) cells used for (A). Corresponding uninfected (LNGFR-, flow-through) cells are shown in Figure 2—figure supplement 1A. Cells were separated using AFMACS at the indicated time points post-infection with HIV-AFMACS, stained with anti-LNGFR and anti-CD4 antibodies and analysed by flow cytometry. Mock-infected cells are shown in grey. (C) Expression profiles of illustrative restriction factors regulated by T cell activation and HIV infection (tetherin) or T cell activation alone (SAMHD1) in cells from (A–B). Relative abundances (bars, fraction of maximum) and log2(ratio)s of abundances (lines) in experimental (Expt):control (Ctrl) cells are shown for each condition/time point and coloured as in (A) (summarised in the key). (D) Expression profiles of illustrative accessory protein targets (CD4, Nef/Vpu; SERINC5, Nef; SNAT1, Vpu; APOBEC3G, Vif; PPP2R5D, Vif; UNG, Vpr) in cells from (A–B). Axes, scales and colours are as in (C). Expression profiles of other accessory protein targets are shown in Figure 2—figure supplement 1B. (E) Patterns of temporal regulation of Vpr vs other accessory protein (Vif/Nef/Vpu) targets in cells from (A–B). Log2(ratio)s of abundances in experimental (Expt):control (Ctrl) cells are shown for 45 accessory protein targets (as in Figure 2—figure supplement 3A). Colours are as in (C), and average profiles (mean, black lozenges/dotted lines) are highlighted for each group of targets.
Figure 2—figure supplement 1.
Figure 2—figure supplement 1.. Additional controls for time course proteomic experiment.
(A) Uninfected (blue, LNGFR-, flow-through) cells used for time course proteomic experiment (Figure 2A). Corresponding HIV-infected (LNGFR+, selected) cells are shown in Figure 2B. Cells were separated using AFMACS at the indicated time points post-infection with HIV-AFMACS, stained with anti-LNGFR and anti-CD4 antibodies and analysed by flow cytometry. Mock-infected cells are shown in grey. (B–C) Expression profiles of accessory protein targets (B) (APOBEC3 and PPP2R5 family proteins, Vif; HLA-A/B alleles, Nef; other downregulated proteins, Vpr) and viral proteins (C) from time course proteomic experiment (Figure 2A). Axes, scales and colours are as in Figure 2C with the exception of APOBEC3C (range of log2(Expt/Ctrl) 0 to −4 rather than 0 to −2.5). SERINC1, APOBEC3B and HLA-C alleles are included as controls. Only HLA alleles quantitated by >1 unique peptide, canonical isoforms of PPP2R5C (Q13362) and ZGPAT (Q8N5A5), and 6/7 viral proteins with no missing values are included. Since viral proteins are not expressed in control (Ctrl) cells, log2(ratio)s of abundances in Expt:Ctrl cells are not shown.
Figure 2—figure supplement 2.
Figure 2—figure supplement 2.. Comparison with T cell activation-dependent changes in Geiger et al. (2016).
Protein abundances in activated vs resting primary human CD4 +T cells from this study (x axis; time course proteomic experiment, Figure 2A) or Geiger et al. (2016) (y axis). Fold changes are compared for proteins quantitated from at least 2 samples of resting and activated cells in both datasets. Together with tetherin and SAMHD1 (Figure 2C), canonical T cell activation markers CD69, CD25 (IL2RA, IL-2 receptor alpha chain) and CD71 (TFRC, transferrin receptor) are also highlighted (red).
Figure 2—figure supplement 3.
Figure 2—figure supplement 3.. Temporal clustering of HIV accessory protein targets.
(A) Hierarchical cluster analysis of 45 accessory protein targets according to profiles of temporal expression from time course proteomic experiment (Figure 2A). Vpr (gold) vs other accessory protein (Vif/Nef/Vpu; green) targets are highlighted. The heatmap shows range-scaled log2(ratio)s of abundances in experimental (Expt):control (Ctrl) cells for each condition/time point. Unscaled data for the same proteins are shown in Figure 2E. (B–C) Expression profiles of ARID5A, PTPN22 (B) and AIRD5B (C) from time course proteomic experiment (Figure 2A). Axes, scales and colours are as in Figure 2C.
Figure 3.
Figure 3.. Proteins regulated by HIV in primary T cells.
(A) Overview of single time point proteomic experiment. HIV-infected (LNGFR+) primary T cells were isolated using AFMACS 48 hr post-infection with WT (red) or ΔVif (blue) HIV-AFMACS. (B) AFMACS-based enrichment of WT (red circles) and ΔVif (blue triangles) HIV-infected (LNGFR+) cells used for (A), with means and 95% CIs. Corresponding cells pre-selection are included for each donor/virus (WT, grey circles; ΔVif, grey triangles). Cells were stained with anti-LNGFR and anti-CD4 antibodies and analysed by flow cytometry, with representative data in Figure 3—figure supplement 1A. (C) Protein abundances in WT HIV-infected vs mock-infected cells from (A). Volcano plots show statistical significance (y axis) vs fold change (x axis) for 8789 cellular and six viral proteins quantitated in cells from all three donors (no missing values). Proteins with Benjamini-Hochberg FDR-adjusted p values (q values) < 0.05 or > 0.05 are indicated (FDR threshold of 5%). Proteins highlighted in each plot are summarised in the key. Vpr/Vif/Nef/Vpu substrates (green circles) comprise proteins from Figure 2C–D and Figure 2—figure supplement 1B, excluding negative controls (SAMHD1, APOBEC3B, SERINC1, HLA-C) and HLA-A/B alleles (different in each donor) but including SMUG1 (not identified in time course proteomic experiment) (Schröfelbauer et al., 2005) and both quantitated isoforms of PP2R5C (Q13362 and Q13362-4) and ZGPAT (Q8N5A5 and Q8N5A5-2). Additional Vpr substrates (gold circles) and Vpr-dependent changes (gold crosses) comprise recently described direct and indirect Vpr targets (Greenwood et al., 2019). HIV-dependent changes only identified in primary T cells (red circles and crosses) comprise proteins with q < 0.05 either not identified or not concordantly regulated by HIV in CEM-T4s (Greenwood et al., 2016) (and exclude known accessory protein-dependent changes). Further details on comparator datasets used in this figure are provided in the Materials and methods. (D–E) Abundances of ARID5A and PTPN22 in mock-infected (grey), WT HIV-infected (red) and ΔVif HIV-infected (green) primary T cells from (A). Mean abundances (fraction of maximum) with 95% CIs are shown (D). As well as proteomic analysis, cells from donor A were lysed in 2% SDS and analysed by immunoblot with anti-ARID5A, anti-PTPN22, anti-Nef and anti-α-tubulin antibodies (E). Same lysates as Figure 5D.
Figure 3—figure supplement 1.
Figure 3—figure supplement 1.. Additional controls for single time point proteomic experiment.
(A) AFMACS-based enrichment of HIV-infected (red, LNGFR+, selected) cells used for single time point proteomic experiment (Figure 3A). Cells were stained with anti-LNGFR and anti-CD4 antibodies and analysed by flow cytometry. Mock-infected cells are shown in grey. Representative data is shown from donor B, with summary data in Figure 3B. (B) Principal component analysis of mock-infected (grey), WT (red) and ΔVif (blue) HIV-infected samples from single time point proteomic experiment (Figure 3A). The correlation matrix was analysed for 8795 cellular and viral proteins quantitated in cells from all three donors (no missing values). Visually-identical results were obtained with/without viral proteins.
Figure 3—figure supplement 2.
Figure 3—figure supplement 2.. Comparison with HIV-dependent changes in CEM-T4s.
(A) Between-sample coefficients of variation (%) for all protein abundances from primary T cells (single time point proteomic experiment, Figure 3A) or CEM-T4s (Greenwood et al., 2016). Boxplots show median, interquartile range and Tukey whiskers for mock-infected (grey) and WT HIV-infected (red) cells. (B) Protein abundances in WT HIV-infected vs mock-infected cells from primary T cells (x axis; single time point proteomic experiment, Figure 3A) or CEM-T4s (y axis) (Greenwood et al., 2016). Fold changes are compared for proteins with q < 0.05 in both datasets. Further details on the CEM-T4 dataset used in this figure are provided in the Materials and methods.
Figure 3—figure supplement 3.
Figure 3—figure supplement 3.. Comparison with HIV-dependent changes in other datasets.
(A) Protein abundances in WT HIV-infected vs mock-infected cells from single time point proteomic experiment (Figure 3A), with details for volcano plots as in Figure 3C. Proteins highlighted in each plot are summarised in the key. Additional Nef/Vpu targets (green circles) comprise (alphabetical order, grouped by study): CCR7 (Ramirez et al., 2014), CD37/CD53/CD63/CD81/CD82 (Haller et al., 2014; Lambelé et al., 2015), CD99 (two quantitated gene products, H7C2F2 and P14209)/PLP2/UBE2L6 (Jain et al., 2018), ICAM1/3 (Sugden et al., 2017), NTB-A (Shah et al., 2010), PVR (Bolduan et al., 2014; Matusali et al., 2012), SELL (Vassena et al., 2013). RUNX1 target genes (blue circles) were previously reported to be regulated by Vif at a transcriptional level because of competition for CBFβ binding (Kim et al., 2013). ISGs (purple circles) were previously curated from published microarray data sets from IFN-treated cells (Schoggins et al., 2014; Schoggins et al., 2011). (B) Mechanisms underlying significant HIV-dependent proteins changes (q < 0.05) in single time point proteomic experiment (Figure 3A). Established accessory protein targets from Figure 3C (left panel, 22 proteins) and (A) (left panel, three proteins) and additional Vpr substrates and Vpr-dependent changes from Figure 3C (middle panel) are shown. Amongst the 32 additional Vpr substrates depleted in primary T cells, 26 had q < 0.05. Remaining proteins are categorised based on the identification plus/minus HIV-dependent regulation in a previous, similar experiment using CEM-T4s (Greenwood et al., 2019). Of 131 proteins not identified in the comparator CEM-T4 dataset, one is known Vpr target SMUG1 (Schröfelbauer et al., 2005) and four other proteins were found to be regulated by Vpr in other experiments using CEM-T4s (ZNF512B, ATXN7, CLUH and SLC39A3) (Greenwood et al., 2019). Further details on comparator datasets used in this figure are provided in the Materials and methods.
Figure 3—figure supplement 4.
Figure 3—figure supplement 4.. Proteins regulated by transduction with control lentivectors.
(A) Overview of SBP-ΔLNGFR control proteomic experiment. Transduced (LNGFR+) primary T cells were isolated using AFMACS 48 hr post-transduction with pSBP-ΔLNGFR (red) or pTat/SBP-ΔLNGFR (blue) lentivectors. (B–C) AFMACS-based enrichment of LNGFR +cells transduced with pSBP-ΔLNGFR (red circles) or pTat/SBP-ΔLNGFR (blue triangles), with means and 95% CIs (B). Corresponding cells pre-selection are included for each donor/virus (pSBP-ΔLNGFR, grey circles; pTat/SBP-ΔLNGFR, grey triangles). Cells were stained with anti-LNGFR and anti-CD4 antibodies and analysed by flow cytometry. Representative data are shown (C) (red, LNGFR+, selected cells; grey, mock-infected cells). (D) Pair-wise comparisons of protein abundances in cells from (A). Volcano plots show statistical significance (y axis) vs fold change (x axis) for 8518 cellular and three viral proteins quantitated in cells from all three donors (no missing values). Proteins with Benjamini-Hochberg FDR-adjusted p values (q values) < 0.05 or > 0.05 for each comparison are indicated (FDR threshold of 5%). Viral proteins and MYB (also regulated by HIV) are highlighted. Detection of Gagpol reflects incoming lentiviral particles rather than de novo synthesis.
Figure 3—figure supplement 5.
Figure 3—figure supplement 5.. Comparison with HIV-dependent changes in Kuo et al. (2018).
(A) Protein abundances in WT HIV-infected vs mock-infected cells from this study (x axis; single time point proteomic experiment, Figure 3A) or Kuo et al. (2018) (y axis). Fold changes are compared for proteins with q < 0.05 in both datasets. (B) Protein abundances in WT HIV-infected vs mock-infected cells from single time point proteomic experiment (Figure 3A), with details for volcano plot as in Figure 3C. Proteins with q < 0.05 not reported by Kuo et al. (2018) are highlighted in red.
Figure 4.
Figure 4.. Pathways regulated by HIV in primary T cells.
(A–B) Gene Ontology (GO) functional annotation terms enriched amongst upregulated or downregulated proteins with q < 0.05 in WT HIV-infected vs mock-infected cells from single time point proteomic experiment (Figure 3A). In the Enrichment Map (Merico et al., 2010) network-based visualisation (A), each node represents a GO term, with node size indicating number of annotated proteins, edge thickness representing degree of overlap (red, enriched amongst upregulated proteins; blue, enriched amongst downregulated proteins) and similar GO terms placed close together. Degree of enrichment is mapped to node colour (left side, enriched amongst upregulated proteins; right side, enriched amongst downregulated proteins) as a gradient from white (no enrichment) to red (high enrichment). Highlighted nodes (arrow heads) represent GO terms enriched amongst both upregulated and downregulated proteins. In the bar charts (B), the 10 most enriched GO terms (ranked by p value) amongst upregulated (red) and downregulated (blue) proteins are shown, with an indicative Benjamini-Hochberg FDR threshold of 5% (dashed line). (C) Protein abundances in WT HIV-infected vs mock-infected cells from single time point proteomic experiment (Figure 3A), with details for volcano plot as in Figure 3C. 57 proteins annotated with the GO term ‘sterol biosynthetic process’ (GO:0016126) are highlighted in red. Amongst these, 15 proteins are regulated by Vpr in CEM-T4s (circles) (Greenwood et al., 2019).
Figure 5.
Figure 5.. Vif-dependent cellular targets in primary T cells.
(A) Protein abundances in WT HIV-infected vs ΔVif HIV-infected cells from single time point proteomic experiment (Figure 3A). Statistical significance (y axis) vs fold change (x axis) is shown for 8795 cellular and viral proteins quantitated in cells from all three donors (no missing values). Proteins with Benjamini-Hochberg FDR-adjusted p values (q values) < 0.05 or > 0.05 are indicated (FDR threshold of 5%). Highlighted groups of differentially regulated proteins are summarised in the key, including two quantitated isoforms of PP2R5C (Q13362 and Q13362-4) and FMR1 (Q06787 and Q06787-2). (B) Abundances of Vif-dependent PPP2R5 family and related proteins highlighted in a) in mock-infected (grey), WT HIV-infected (red) and ΔVif HIV-infected (green) cells from single time point proteomic experiment (Figure 3A). Mean abundances (fraction of maximum) with 95% CIs are shown. Only the canonical isoform of PPP2R5C (Q13362) is shown. (C) Activation of AURKB by Vif. CEM-T4s were mock-transduced or transduced with control (pCtrl) or Vif-expressing (pVif) lentiviruses for 48 hr (62–78% GFP+), lysed in 2% SDS and analysed by immunoblot with anti-phospho-AURK (T232), anti-total AURKB, anti-Vif and anti-α-tubulin antibodies. (D) Vif-dependent activation of AURKB. AFMACS-selected (LNGFR+) HIV-infected cells from Figure 3A (donor A) were lysed in 2% SDS and analysed by immunoblot with anti-PPP2R5D, anti-phospho-AURK (T232), anti-total AURKB and anti-Vif antibodies. Same lysates as Figure 3E. (E) Abundances of DPH7 and FMR1 in mock-infected (grey), WT HIV-infected (red) and ΔVif HIV-infected (green) primary T cells from single time point proteomic experiment (Figure 3A) and CEM-T4s (Greenwood et al., 2016). Mean abundances (fraction of maximum) with 95% CIs intervals are shown. Only the canonical isoform of FMR1 (Q06787) is shown. (F) Vif-dependent depletion of DPH7 and FMR1. CEM-T4s were mock-infected or infected with WT or ΔVif HIV-AFMACS viruses for 48 hr (77–82% LNGFR +cells), lysed in 2% SDS, and analysed by immunoblot with anti-DPH7, ant-FMR1, anti-Vif and anti-α-tubulin antibodies. (G) Depletion of DPH7, FMR1 and PPP2R5D by Vif. CEM-T4s were mock-transduced or transduced with control (pCtrl) or Vif-expressing (pVif) lentiviruses for 48 hr (86–88% GFP +cells), lysed in 2% SDS and analysed by immunoblot with anti-phospho-AURK, anti-total AURKB, anti-Vif and anti- α-tubulin (loading control) antibodies.

Similar articles

Cited by

References

    1. Aiken C. Pseudotyping human immunodeficiency virus type 1 (HIV-1) by the glycoprotein of vesicular stomatitis virus targets HIV-1 entry to an endocytic pathway and suppresses both the requirement for nef and the sensitivity to cyclosporin A. Journal of Virology. 1997;71:5871–5877. - PMC - PubMed
    1. Apps R, Del Prete GQ, Chatterjee P, Lara A, Brumme ZL, Brockman MA, Neil S, Pickering S, Schneider DK, Piechocka-Trocha A, Walker BD, Thomas R, Shaw GM, Hahn BH, Keele BF, Lifson JD, Carrington M. HIV-1 vpu mediates HLA-C downregulation. Cell Host & Microbe. 2016;19:686–695. doi: 10.1016/j.chom.2016.04.005. - DOI - PMC - PubMed
    1. Arthos J, Cicala C, Martinelli E, Macleod K, Van Ryk D, Wei D, Xiao Z, Veenstra TD, Conrad TP, Lempicki RA, McLaughlin S, Pascuccio M, Gopaul R, McNally J, Cruz CC, Censoplano N, Chung E, Reitano KN, Kottilil S, Goode DJ, Fauci AS. HIV-1 envelope protein binds to and signals through integrin alpha4beta7, the gut mucosal homing receptor for peripheral T cells. Nature Immunology. 2008;9:301–309. doi: 10.1038/ni1566. - DOI - PubMed
    1. Bernard F, Jaleco S, Dardalhon V, Steinberg M, Yssel H, Noraz N, Taylor N, Kinet S. Ex vivo isolation protocols differentially affect the phenotype of human CD4+ T cells. Journal of Immunological Methods. 2002;271:99–106. doi: 10.1016/S0022-1759(02)00412-X. - DOI - PubMed
    1. Bolduan S, Hubel P, Reif T, Lodermeyer V, Höhne K, Fritz JV, Sauter D, Kirchhoff F, Fackler OT, Schindler M, Schubert U. HIV-1 vpu affects the anterograde transport and the glycosylation pattern of NTB-A. Virology. 2013;440:190–203. doi: 10.1016/j.virol.2013.02.021. - DOI - PMC - PubMed

Publication types

MeSH terms

Substances