. 2019 May 15:406:109-125.
doi: 10.1016/j.neuroscience.2019.03.003. Epub 2019 Mar 8.

Reversal of a Treatment-Resistant, Depression-Related Brain State with the Kv7 Channel Opener Retigabine

Affiliations

Reversal of a Treatment-Resistant, Depression-Related Brain State with the Kv7 Channel Opener Retigabine

Mengyang Feng et al. Neuroscience. .

Abstract

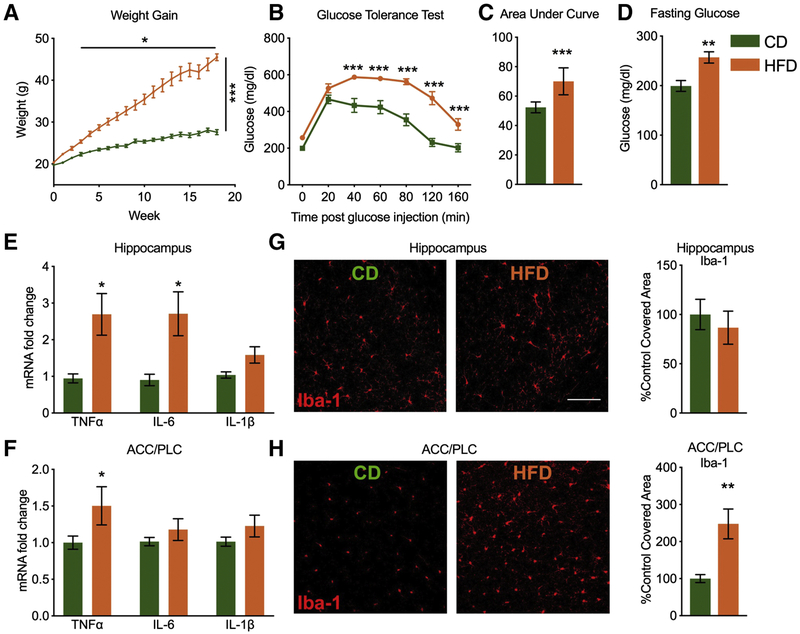
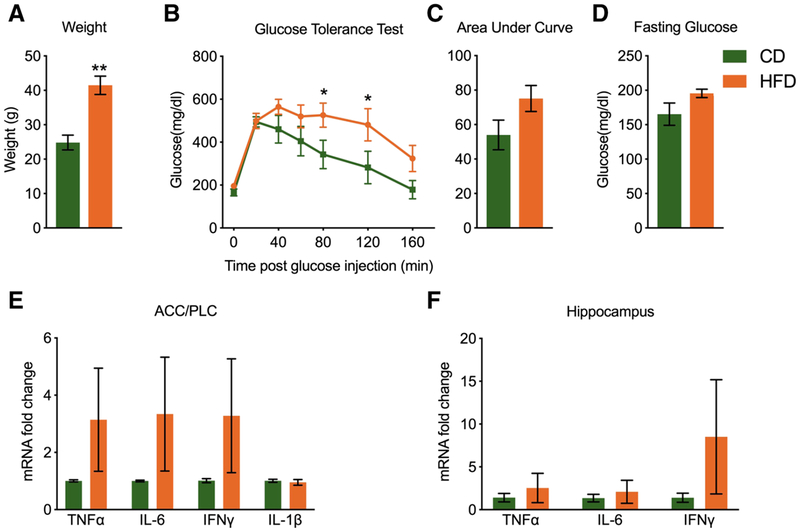
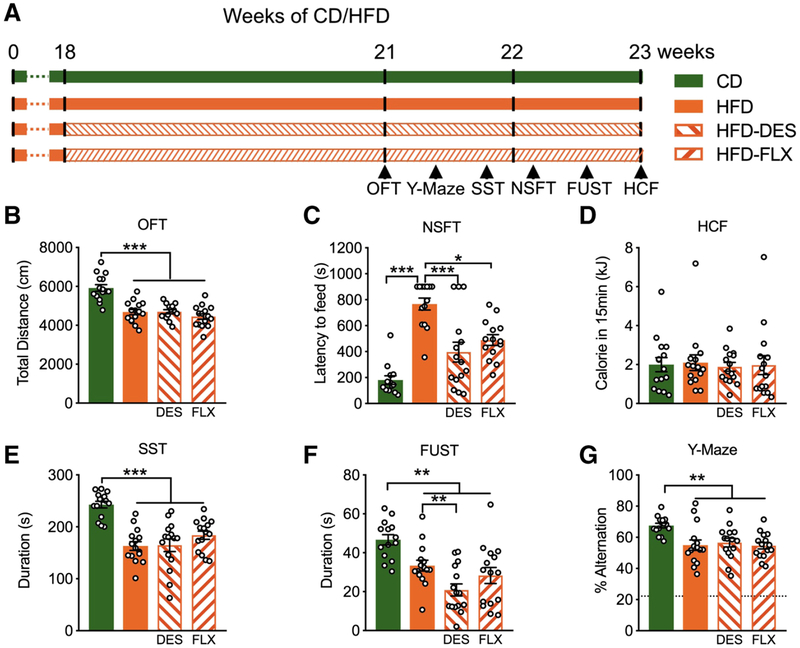
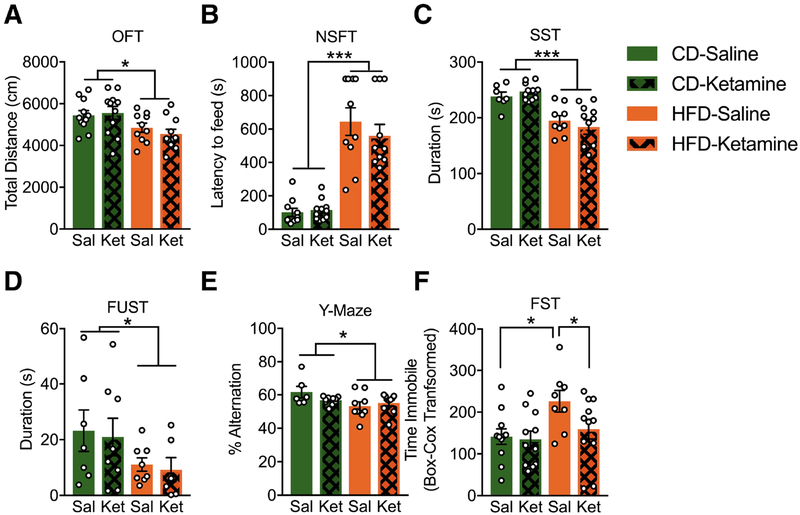
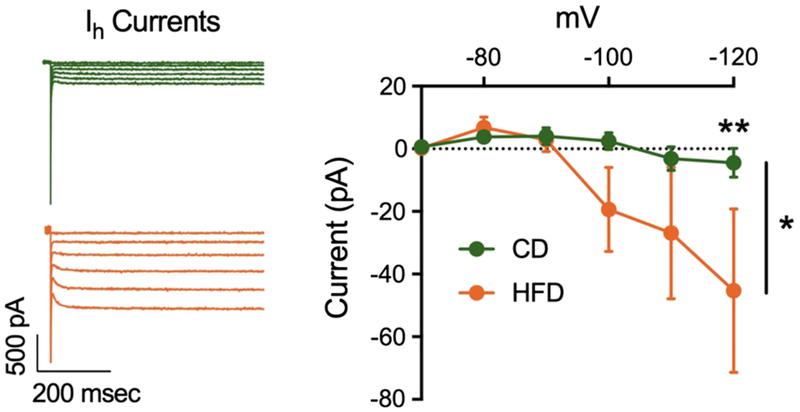
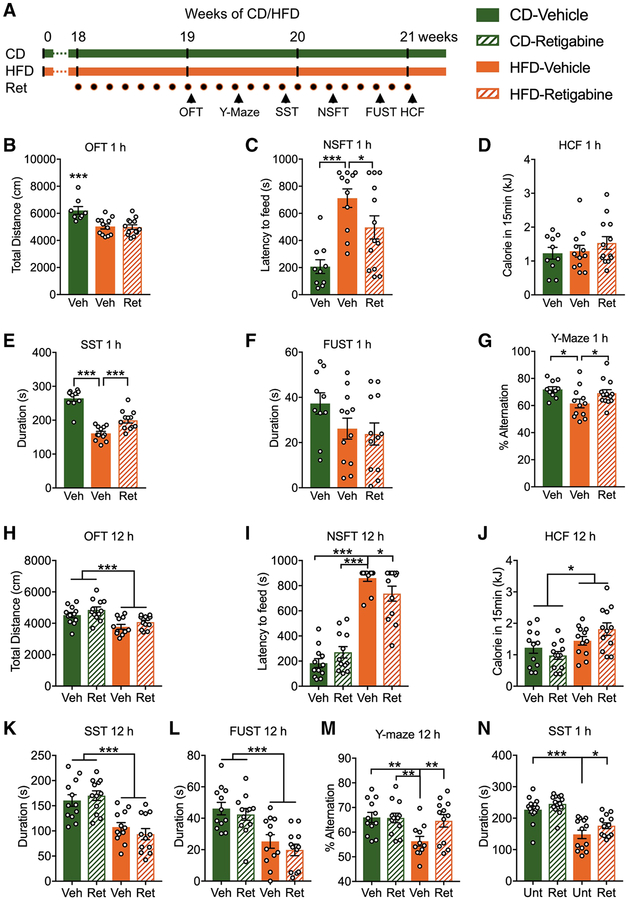
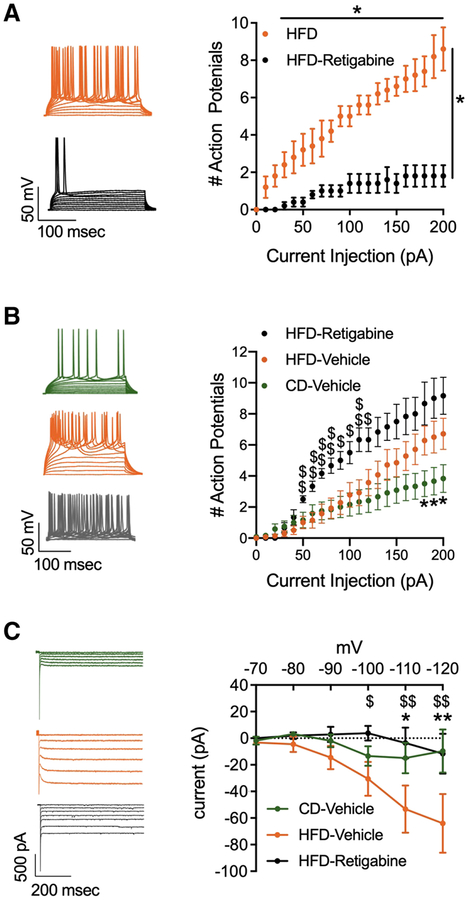
Neuroinflammation is associated with increased vulnerability to diverse psychiatric conditions, including treatment-resistant major depressive disorder (MDD). Here we assessed whether high fat diet (HFD) induced neuroinflammation may be suitable to model a treatment-resistant depressive-like brain state in mice. Male and female mice were fed a HFD for 18 weeks, followed by quantitation of glucose tolerance, inflammatory markers of brain tissue (TNFα, IL-6, IL-1β, Iba-1), neural excitability in the prelimbic cortex (PLC), as well as assessment of emotional reactivity and hedonic behavior in a battery of behavioral tests. In addition, we assessed the behavioral responsiveness of mice to fluoxetine, desipramine, ketamine, and the Kv7 channel opener and anticonvulsant retigabine. HFD exposure led to glucose intolerance and neuroinflammation in male mice, with similar but non-significant trends in females. Neuroinflammation of males was associated with anxious-depressive-like behavior and defects in working memory, along with neural hyperexcitability and increased Ih currents of pyramidal cells in the PLC. The behavioral changes were largely resistant to chronic treatment with fluoxetine and desipramine, as well as ketamine. By contrast, retigabine (also known as ezogabine) normalized neural excitability and Ih currents recorded from slices of HFD-treated animals and significantly ameliorated most of the behavioral impairments, without effects in control diet exposed animals. Thus, treatment resistant depressive-like brain states that are associated with chronic neuroinflammation may involve hyperexcitability of pyramidal neurons and may be effectively treated by retigabine.

Keywords: antidepressant; high fat diet; ketamine; neuroinflammation; neuronal hyperexcitability; obesity.


Figures

Figure 1.
Figure 1.. HFD feeding induces weight gain, abnormal glucose metabolism and neuroinflammation in male mice.
A) Treatment with HFD resulted in an accelerated increase in body weight illustrated by main effects for diet (F(1, 16) = 412.3, p < 0.001) and time (F(18, 288) = 77.41, p < 0.001) and a significant diet × time interaction [F(18, 288) = 21.36, p < 0.001, 2-way Repeated Measurement (RM) ANOVA]. A significant weight gain was evident starting at three weeks of HFD (p = 0.014; n = 9, Fisher’s LSD). B) Glucose tolerance tests after 18 weeks of HFD revealed significant main effects for diet (F(1, 15) = 28.97, p < 0.001) and time post glucose injection (F(6, 90) = 82.38, p < 0.001) and interaction (F(6, 90) = 6.95, p < 0.001, 2-way RM ANOVA). HFD-exposed mice showed increased blood glucose levels from 40 to 160 min post glucose injection (p < 0.001, n = 9, Fisher’s LSD). (C) Area under curve of results in (B) (p < 0.001, t-test). D) Blood glucose levels of 18-week HFD-exposed mice assessed after 8 h of fasting were increased (p < 0.01, t-test). E, F) Quantitation of TNFα, IL-6 and IL-1β mRNA levels by qRT-PCR revealed proinflammatory effects of 18-week HFD-treatment in both hippocampus (E) (Diet: F(1, 49) = 17.36, p < 0.001) and ACC/PLC (F) (Diet: F(1, 62) = 4.30, p = 0.042). Posthoc tests revealed increased expression of TNFα and IL-6 in hippocampus (E) ((TNFα, p = 0.002, n = 9–11; IL-6, p = 0.007, n = 6–9) and of TNFα in ACC/PLC (F) (p = 0.025, n = 13–14; Fisher’s LSD). G, H) Representative micrographs and quantitation of the % area immunostained for Iba-1. The % area positive for Iba-1 was increased in ACC/PLC of 18-week HFD-exposed vs. control dietmice (p = 0.004, n = 7) but unaltered in hippocampus (p = 0.57, n = 7–8; t-tests). Scale bar, 100 μm; error bars, SEMs; *p < 0.05, **p < 0.01, ***p < 0.001, for all Figures.
Figure 2.
Figure 2.. HFD feeding-induced weight gain of female mice results in marginally altered glucose metabolism and insignificant trends for neuroinflammation.
A) Treatment with HFD for 18 weeks resulted in a significant increase in body weight (p < 0.01, n = 6; Mann-Whitney). B) Glucose tolerance test after 18 weeks of HFD. A two-way repeated measurement ANOVA for glucose level revealed significant main effects for time post glucose injection (F(6, 60) = 30.98, p < 0.001) and interaction of time × diet exposure (F(6, 60) = 2.577, p < 0.05). HFD-treated mice showed increased blood glucose levels at 80 and 120 min post glucose injection (p < 0.05, n = 6; Fisher’s LSD). C) Area under the curve of results in (B) (p, ns). D) Blood glucose levels of 18-week HFD-treated mice assessed after 8 h of fasting trended higher (p < 0.1, n = 6, Mann-Whitney). E, F) Quantitation of TNFα, IL-6, Interferon-γ (IFN-γ) and IL-1β mRNA by qRT-PCR revealed an overall trend for increased expression of proinflammatory cytokine mRNAs in ACC/PLC of HFD exposed mice (E)(F(1, 38) = 3.554, p = 0.07) that was absent in hippocampus (F) (F(1, 28) = 1.454, p = 0.24). Error bars, SEMs; *p < 0.05, **p < 0.01.
Figure 3.
Figure 3.. HFD exposure-induced behavioral alterations are largely resistant to desipramine and fluoxetine, along with increased neural excitability and Ih currents.
A) Experimental design: Four separate groups of mice (n = 14–15) were fed a CD or HFD starting at 5 weeks of age, followed by treatment with desipramine (DES) or fluoxetine (FLX) in drinking water (or water alone) starting in the 19th week, and behavioral testing (three tests per week) in the 21st week of special diet exposure. B) In the OFT, the total distance traveled was reduced in HFD vs CD-exposed animals (F(3, 55) = 22.22, p < 0.001, ANOVA, Fisher’s LSD), without drug effects in HFD-exposed animals (DES, p = 0.95; FLX, p = 0.25; Fisher’s LSD). C) In the NSFT, the latency to feed was increased by HFD exposure (p < 0.001, Kruskal-Wallis, uncorrected Dunn’s tests) and this effect was ameliorated by antidepressant drug treatment (DES, p < 0.001; FLX, p < 0.05; uncorrected Dunn’s tests). D) Caloric consumption of food deprived animals tested in the home cage was unaffected (F(3, 56) = 0.05, p = 0.98, ANOVA). E) In the SST, HFD-induced reductions in the duration spent grooming were unaffected by drug treatments (DES, p = 0.90; FLX, p = 0.11; Fisher’s LSD). F) In the FUST, the HFD-induced reduction in the duration spent sniffing was unaffected by the drug treatments (F(3, 55) = 11.08, p < 0.001, ANOVA, DES induced significant reduced time spent sniffing, p = 0.008; FLX, p = 0.27; Fisher’s LSD). G) In the Y-Maze, the HFD-induced reduction of Spontaneous Alternations was unaffected by drug treatment (F(3, 56) = 5.88, p = 0.0015, ANOVA, DES, p = 0.66; FLX, p = 0.92; Fisher’s LSD). The level of alternations by chance in this test is indicated by a dashed horizontal line. Error bars, SEMs; *p < 0.05, **p < 0.01, ***p < 0.001.
Figure 4.
Figure 4.. Chronic HFD induced anxious-depressive-like behavior is resistant to ketamine.
A) Mice were subjected to behavioral testing starting in the 19th week of special diet exposure, with ketamine (6 mg/kg, i.p.) or vehicle (0,9% saline) given 8 h before each test and performing one test per week. B) In the OFT, ketamine did not affect the distance traveled (Diet: F(1,40) = 5.70, p = 0.022; Drug: F(1,40) = 0.66, p = 0.42; Interaction: F(1,40) = 1.49, p = 0.23; ANOVA). C) In the NSFT, ketamine failed to ameliorate the anxious phenotype (Diet: F(1,39) = 111.6, p < 0.001; Drug: F(1,39) = 0.61, p = 0.44; Interaction: F(1,39) = 0.02, p = 0.88; ANOVA). D) In the SST, ketamine failed to reverse the HFD induced reduction in grooming duration (Diet: F(1,35) = 32.59, p < 0.001; Drug: F(1,35) = 0.02, p = 0.89; Interaction: F(1,35) = 1.17, p = 0.29; ANOVA). E) In the FUST, ketamine failed to reverse the anhedonia-like reductions in the duration spent urine sniffing (Diet: F(1,25) = 4.42, p = 0.046; Drug: F(1,25) = 0.13, p = 0.72; Interaction: F(1,25) = 0.001, p = 0.97; ANOVA). F) In the Y-Maze, ketamine had no effect on % Alternations (Diet: F(1,31) = 5.53, p = 0.025; Drug: F(1,31) = 0.51, p = 0.48; Interaction: F(1,31) = 2.64, p = 0.11; ANOVA). G) In the FST, there was a HFD exposure-induced increase in the BOX-COX transformed time spent immobile that was reversed by ketamine (F(1,37) = 6.17, p < 0.018 for diet, ANOVA and p = 0.046 drug effects, Fisher’s LSD). Error bars, SEMs; *p < 0.05, ***p < 0.001.
Figure 5.
Figure 5.. Chronic HFD exposure results in increased Ih currents.
Recordings of Ih currents from PLC L2/3 pyramidal cells with representative current traces on the left and summary data on the right. The Ih currents increased with increasing hyperpolarizing membrane potentials (F(5, 95) = 5.12, p < 0.001) and showed a significant diet × voltage interaction (F(5, 95) = 2.77, p = 0.022, 2-way RM ANOVA). Posthoc tests showed greater Ih currents in HFD vs. CD-exposed animals at −120 mV (p = 0.003, n = 9–12 cells from at least four animals per condition, Fisher’s LSD). Error bars, SEMs; *p < 0.05, **p < 0.01.
Figure 6.
Figure 6.. Retigabine reverses chronic HFD induced anxious-depressive-like behavior at different time points.
A) Mice exposed to HFD starting from 5-weeks of age were subjected to a daily injection of retigabine or vehicle, starting at the end of the 18th week of diet exposure. CD-exposed mice were vehicle injected and analyzed in parallel. Behavioral testing was initiated on the 8th day of drug treatment, 1 h (B–G, N) or 12 h (H–M) after drug injection, with one behavioral test every 2–3 days. B) In the OFT, retigabine (Ret) had no effect on distance traveled (F(2,30) = 9.75, p < 0.001, ANOVA, p = 0.87, Fisher’s LSD). C) In the NSFT, HFD exposure increased the latency to feed (F(2,31) = 11.09, p < 0.001, ANOVA), and retigabine treatment partially reversed this effect (p = 0.040, Fisher’s LSD). D) Caloric intake in HCF tests was unaffected by diet and retigabine (F(2,32) = 0.81, p = 0.45, ANOVA). E) In the SST, retigabine partially reversed the HFD-exposure-induced reduction in grooming duration (F(2,31) = 44.27, p < 0.001, ANOVA; CD-Veh vs HFD-Veh, p < 0.001; HFD-Veh vs HFD-Ret, p < 0.001, Fisher’s LSD). F) In the FUST, neither diet nor retigabine had significant effects on grooming duration (F(2,31) = 2.17, p = 0.13, ANOVA). G) In the Y-Maze, retigabine reversed HFD-exposure-induced reductions in % alternations (F(2,32) = 3.82, p = 0.03 for diet and p = 0.049 for drug effects, ANOVA, Fisher’s LSD). H) In the OFT, retigabine had no effect on distance traveled, independent of diet (Diet, F(1,44) = 22.59, p < 0.001; Drug, F(1,44) = 3.81, p = 0.06; Interaction, F(1,44) = 0.007, p = 0.94, ANOVA). I) In the NSFT, the HFD increased the latency to feed (Diet, F(1,44) = 147.5, p < 0.001, ANOVA), and retigabine partially reversed this effect (Drug, F(1,44) = 0.19, p = 0.67;Interaction, F(1,44) = 5.86, p = 0.020, ANOVA, p = 0.0499, Fisher’s LSD), without effect on CD mice (p = 0.17, Fisher’s LSD). J) In the HCF test, caloric intake was increased in HFD-exposed animals but was unaffected by retigabine (Diet, F(1,44) = 22.59, p < 0.001; Drug, F(1,44) = 0.15, p = 0.70; Interaction, F(1,44) = 3.64, p = 0.063, ANOVA). K) In the SST, the grooming duration of HFD-exposed animals was reduced but unaffected by retigabine (Diet, F(1,44) = 39.34, p < 0.001; Drug, F(1,44) = 0.045, p = 0.83; Interaction, F(1,44) = 1.31, p = 0.26, ANOVA). L) In the FUST, the duration spent sniffing was reduced in HFD-exposed mice and unaffected by retigabine (Diet, F(1,44) = 30.49, p < 0.001; Drug, F(1,44) = 1.34, p = 0.25; Interaction, F(1,44) = 0.048, p = 0.83, ANOVA). M) In the Y-maze, retigabine reversed the HFD-induced reduction in % alternations but had no effect in CD mice (Diet, F(1,43) = 6.30, p = 0.016; Drug, F(1,43) = 3.55, p = 0.067; Interaction, F(1,43) = 3.92, p = 0.054, ANOVA; CD-Veh vs HFD-Veh, p = 0.003; CD-Ret vs HFD-Veh, p = 0.004; HFD-Veh vs HFD-Ret, p = 0.0098, Fisher’s LSD). N) Some of the mice tested in (H–M) were taken off retigabine or vehicle for 6 weeks and then tested again in the SST [untreated controls (Unt)]. The same mice were then subjected to daily retigabine injections for 8 days and retested 1 h after the last injection. Retigabine partially reversed HFD-induced reductions in grooming duration without effects in CD mice (Diet, F(1,25) = 38.58, p < 0.001; Drug, F(1,25) = 7.24, p = 0.013; Interaction, F(1,25) = 0.29, p = 0.59, two-way RM ANOVA; CD-Veh vs CD-Ret, p = 0.13; HFD-Veh vs HFD-Ret, p = 0.034, Fisher’s LSD). Error bars, SEMs; *p < 0.05, **p < 0.01, ***p < 0.001.
Figure 7.
Figure 7.. Retigabine reduces Ih currents and normalizes neural excitability of HFD-exposed animals to control levels.
A) Current injection data from layer II/III PLC pyramidal cells of HFD-exposed mice before and after bath application of 100 μM retigabine, with representative traces shown on the left and summary data on the right. We observed significant main effects of current injected (F(20,160) = 23.07, p < 0.001) and drug (F(20,160) = 23.07, p < 0.001) and an interaction of drug and current (F(1,8) = 39.8, p < 0.001, 2-way RM ANOVA). Retigabine reduced the number of action potentials in response to currents of 20 pA to 200 pA (20 pA, p = 0.037; 30 pA: p = 0.01; 40 pA, p = 0.006; 50 pA, p = 0.001; 60 pA, p = 0.002; 70–200 pA: p < 0.001, n = 5 cells per condition, Fisher’s LSD). B) Representative traces and current injection data from layer II/III PLC pyramidal cells from vehicle injected CD- or HFD-exposed mice, in comparison to retigabine treated HFD mice, using slices isolated 24 h after the last of eight daily doses of retigabine. A two-way RM ANOVA revealed a main effect of current injected (F(1.544,44.78) = 69.63, p < 0.001), treatment (F(2,29) = 3.79, p = 0.035) and an interaction of current and treatment (F(40,580) = 5.16, p < 0.001). HFD exposure (vs. CD) increased the number of action potentials in response to currents of 180 pA to 200 pA (180 pA, p = 0.035; 190 pA, p = 0.047; 200 pA, p = 0.042, Fisher’s LSD). Retigabine increased the number of action potentials in response to currents of 60 pA to 120 pA (60 pA–80 pA, p < 0.01; 90 pA, p = 0.011; 100 pA, p = 0.022; 110 pA, p < 0.01; 120 pA, p = 0.027; Fisher’s LSD, n = 6–14 cells from at least four animals per condition). C) Representative traces and summary data of Ih currents recorded from layer II/III PLC pyramidal cells from behaviorally naïve CD- or HFD-exposed mice, using slices isolated 24 h after the last of eight daily doses of retigabine or vehicle. A two-way RM ANOVA revealed a main effect of V step (F(5,125) = 6.75, p < 0.001) and an interaction of diet and voltage (F(10,125) = 2.73, p = 0.005, 2-way RM ANOVA). HFD exposure (vs. CD) increased Ih currents in response to V-steps of −110 mV to −120 mV (−110 mV, p = 0.026; −120 mV, p = 0.002, n = 7–12 cells from at least four animals per condition). Retigabine (vs vehicle) reduced Ih currents of HFD-exposed mice in response to V steps of −100 mV to −120 mV (−100 mV, p = 0.03; −110 mV, p = 0.002; −120 mV, p = 0.001; n = 9–12 cells from at least four animals per condition, Fisher’s LSD). Error bars, SEMs; *,$p < 0.05, **,$ $p < 0.01.

Similar articles

Cited by

References

    1. Al-Hakeim HK, Al-Rammahi DA, Al-Dujaili AH, 2015. IL-6, IL-18, sIL-2R, and TNFalpha proinflammatory markers in depression and schizophrenia patients who are free of overt inflammation. J Affect Disord 182, 106–114. doi: 10.1016/j.jad.2015.04.044 - DOI - PubMed
    1. Alcocer-Gomez E, Ulecia-Moron C, Marin-Aguilar F, Rybkina T, Casas-Barquero N, Ruiz-Cabello J, Ryffel B, Apetoh L, Ghiringhelli F, Bullon P, Sanchez-Alcazar JA, Carrion AM, Cordero MD, 2016. Stress-Induced Depressive Behaviors Require a Functional NLRP3 Inflammasome. Mol Neurobiol 53, 4874–4882. doi: 10.1007/s12035-015-9408-7 - DOI - PubMed
    1. Almeida-Suhett CP, Graham A, Chen Y, Deuster P, 2017. Behavioral changes in male mice fed a high-fat diet are associated with IL-1beta expression in specific brain regions. Physiol Behav 169, 130–140. doi: 10.1016/j.physbeh.2016.11.016 - DOI - PubMed
    1. Arnold SE, Lucki I, Brookshire BR, Carlson GC, Browne CA, Kazi H, Bang S, Choi BR, Chen Y, McMullen MF, Kim SF, 2014. High fat diet produces brain insulin resistance, synaptodendritic abnormalities and altered behavior in mice. Neurobiol Dis 67, 79–87. doi: 10.1016/j.nbd.2014.03.011 - DOI - PMC - PubMed
    1. Au A, Feher A, McPhee L, Jessa A, Oh S, Einstein G, 2016. Estrogens, inflammation and cognition. Front Neuroendocrinol 40, 87–100. doi: 10.1016/j.yfrne.2016.01.002 - DOI - PubMed

MeSH terms