Case Reports
. 2019 Mar 11;2(2):e201900353.
doi: 10.26508/lsa.201900353. Print 2019 Apr.

PISD is a mitochondrial disease gene causing skeletal dysplasia, cataracts, and white matter changes

Affiliations
Case Reports

PISD is a mitochondrial disease gene causing skeletal dysplasia, cataracts, and white matter changes

Tian Zhao et al. Life Sci Alliance. .

Abstract

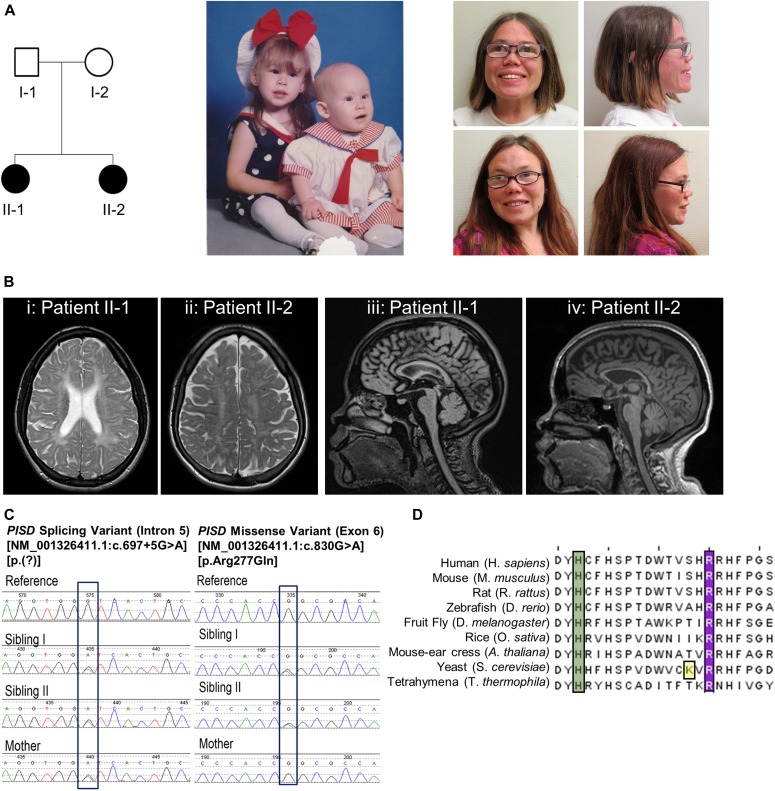
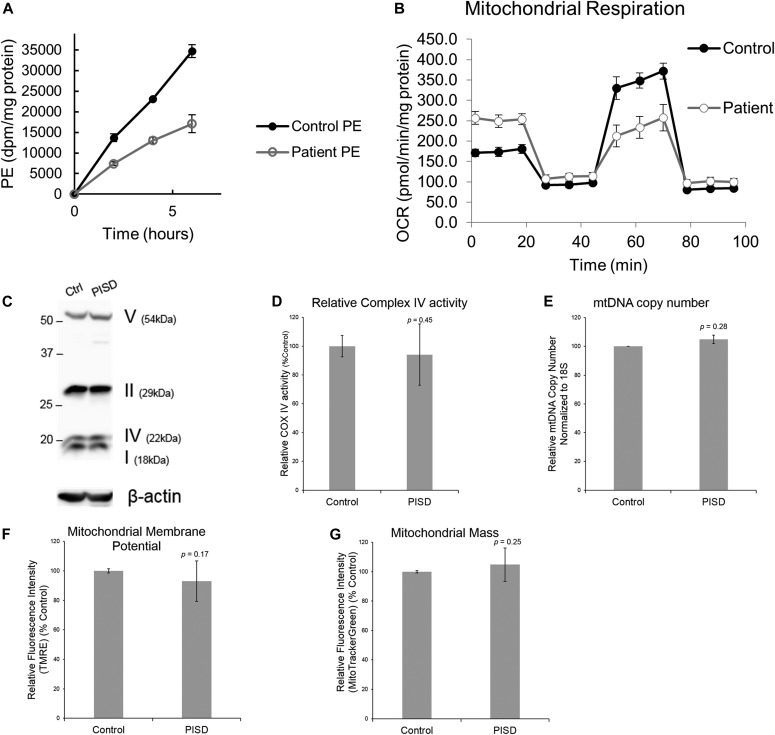
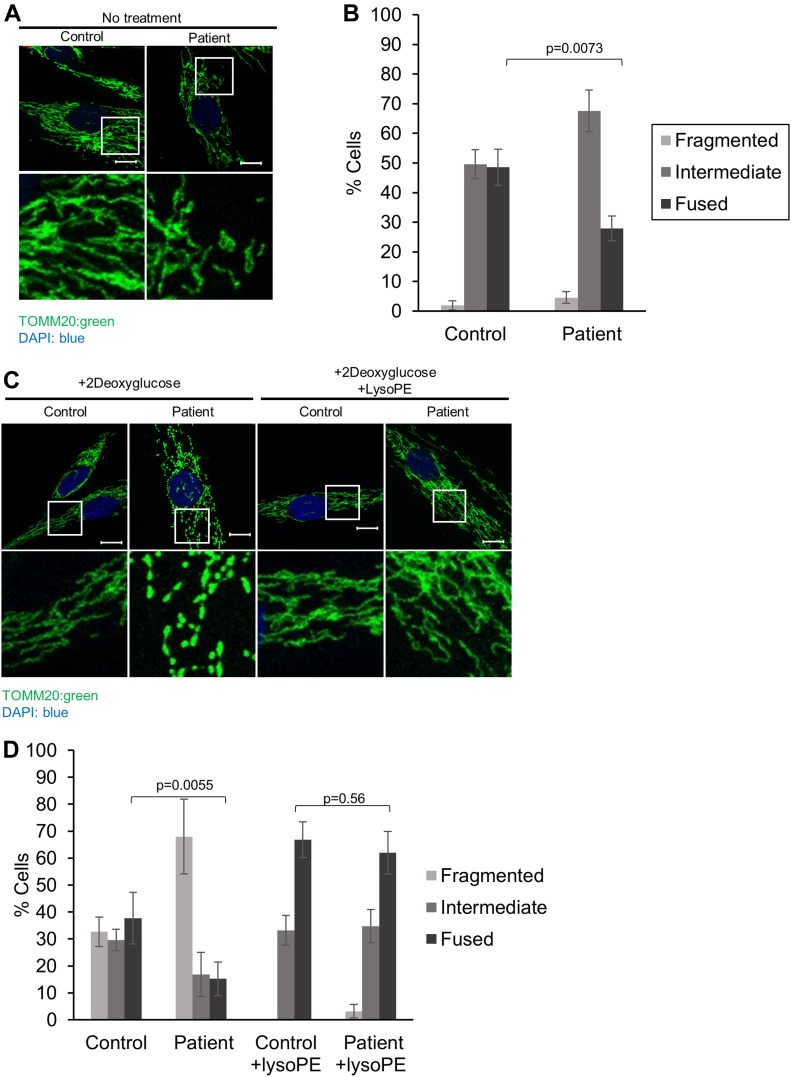
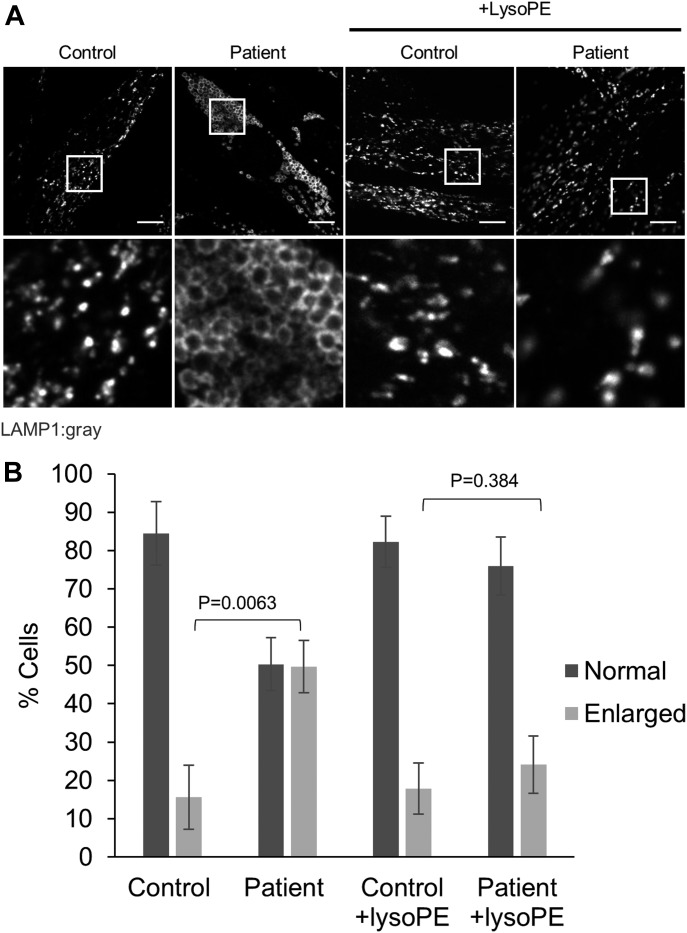
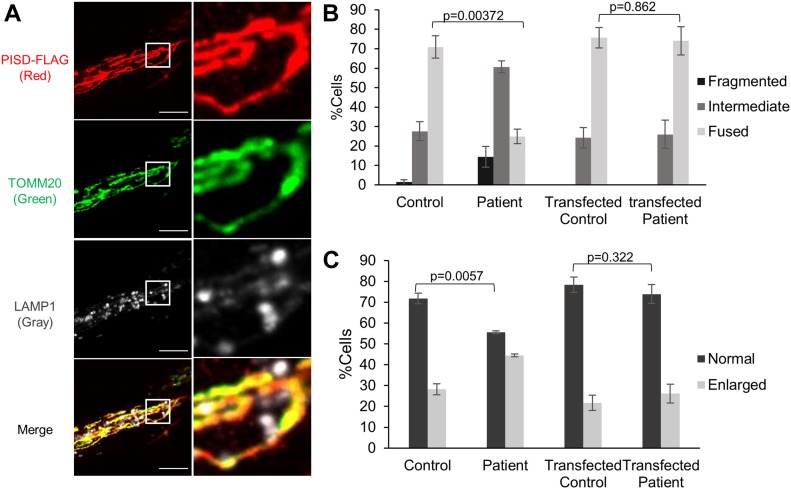
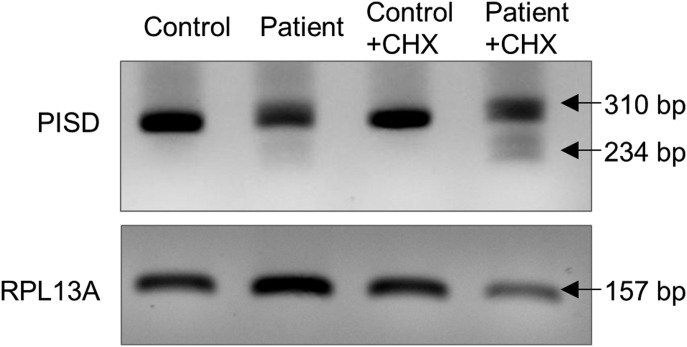
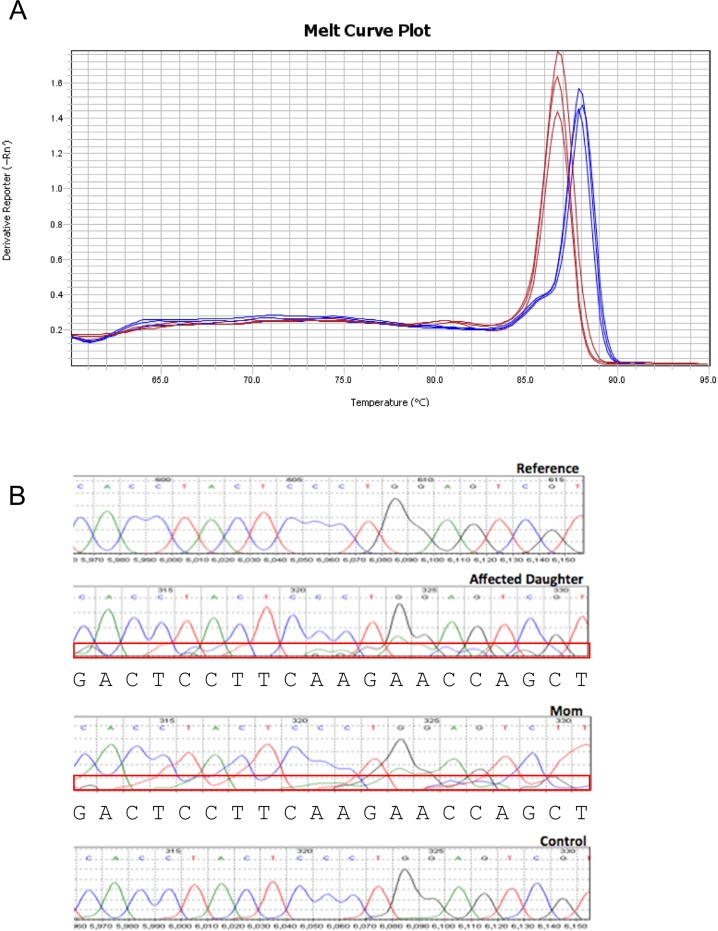
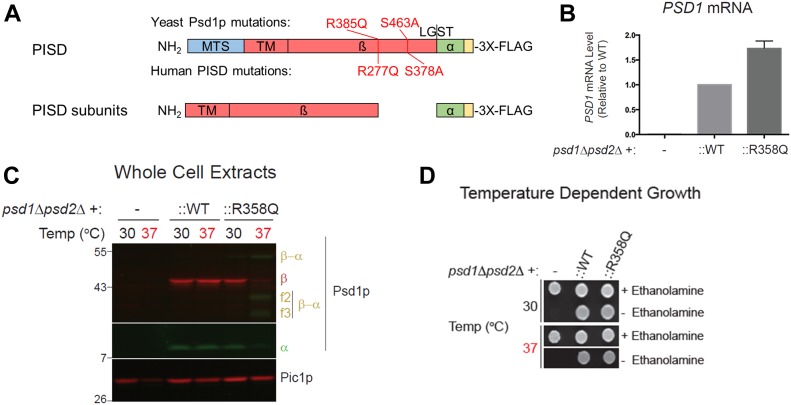
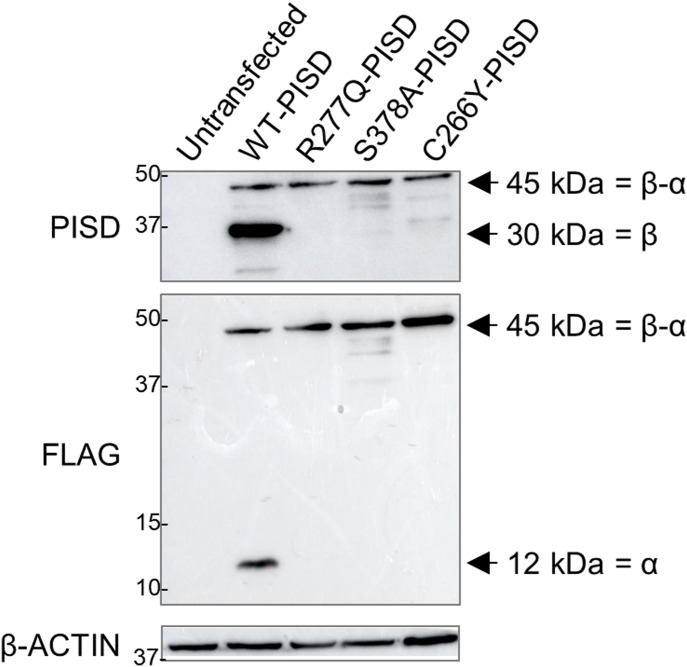
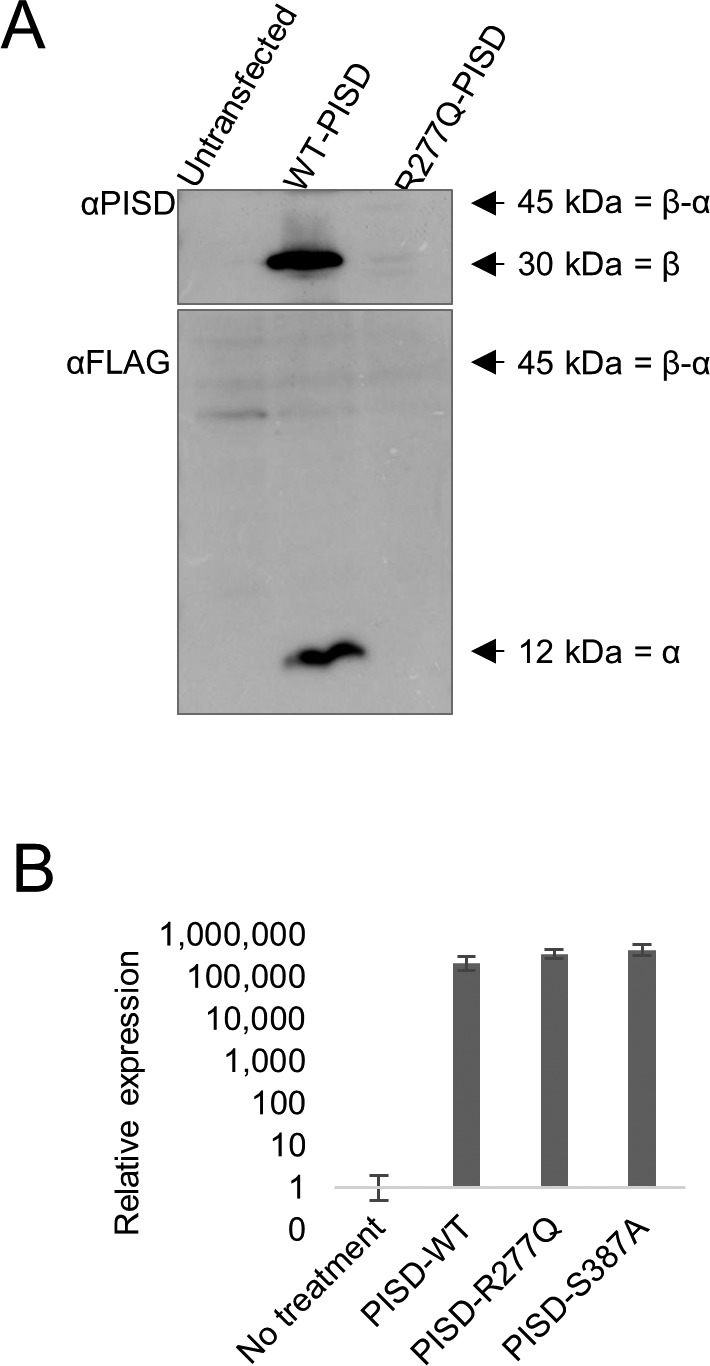
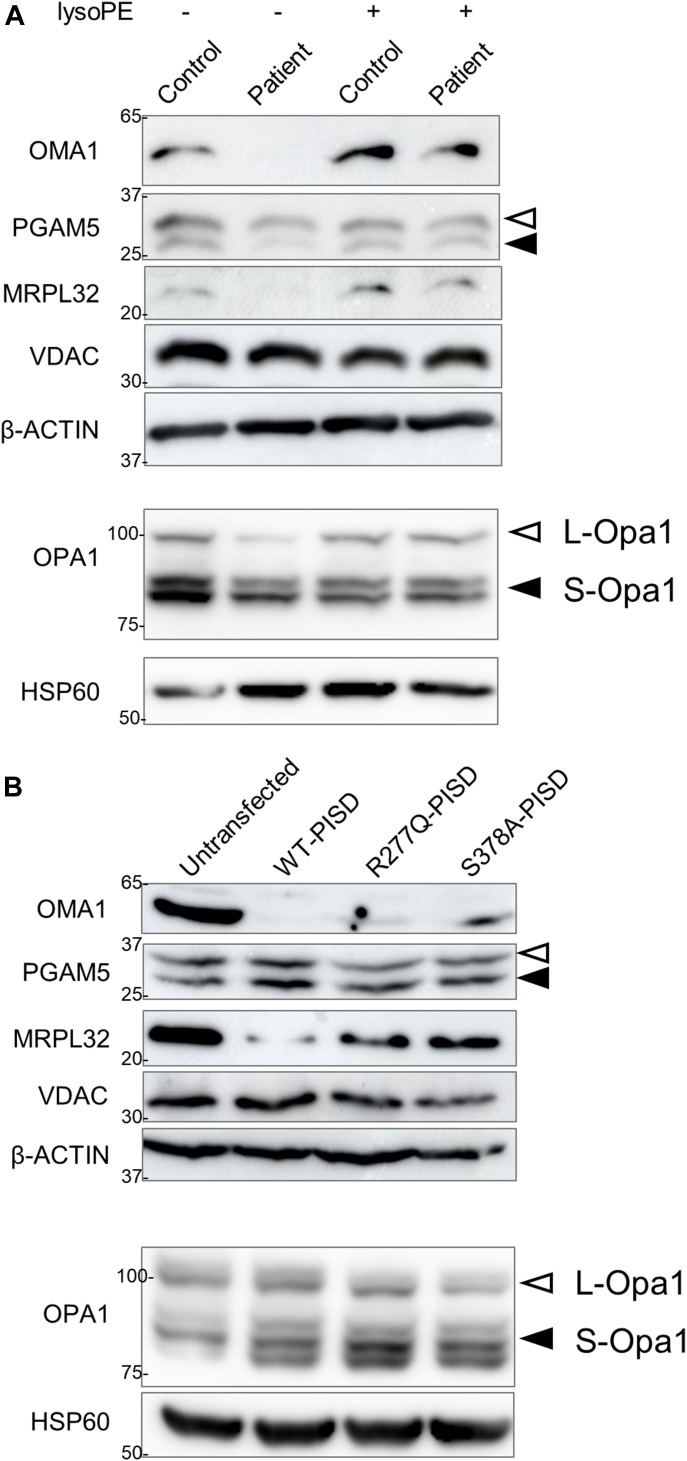
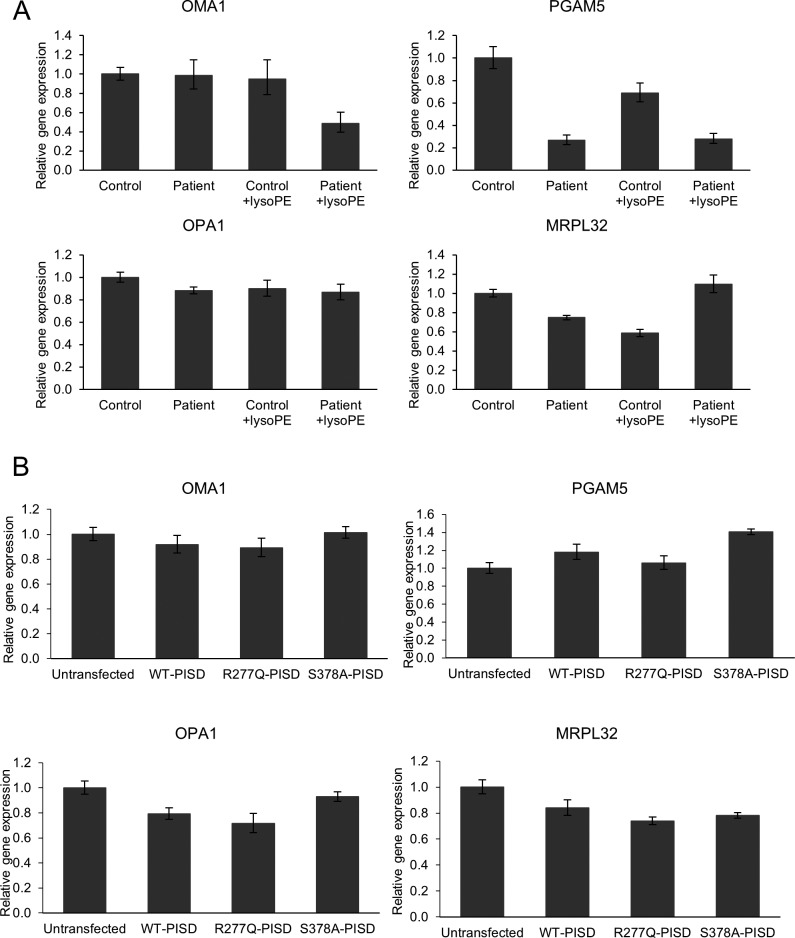
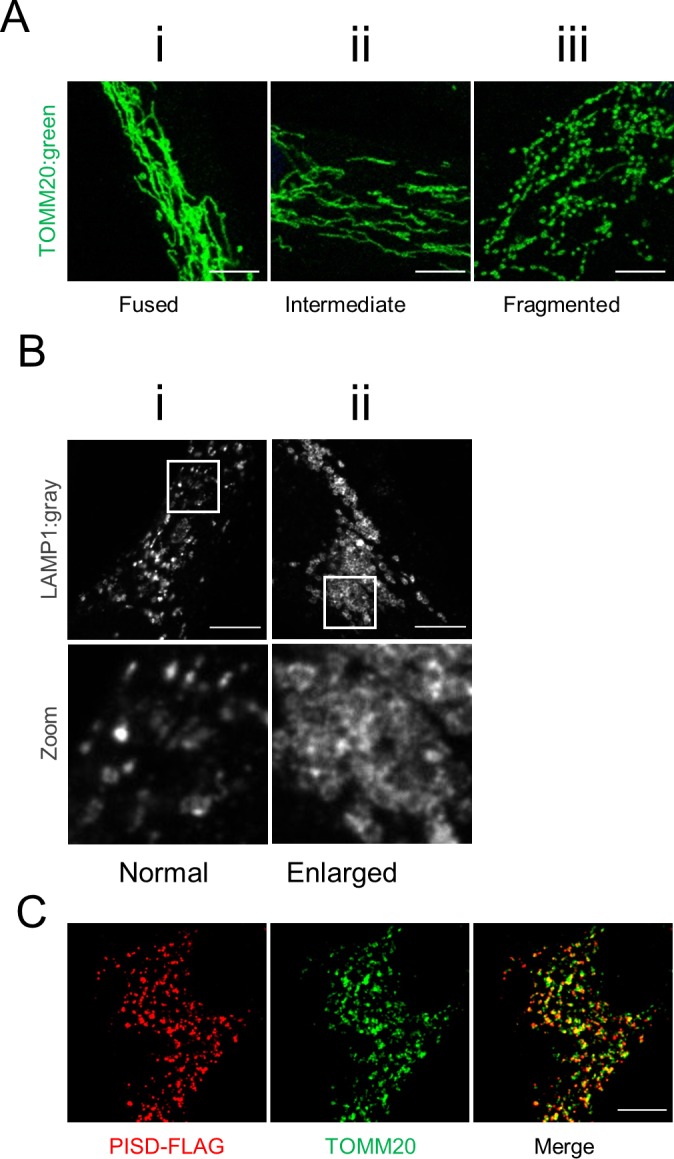
Exome sequencing of two sisters with congenital cataracts, short stature, and white matter changes identified compound heterozygous variants in the PISD gene, encoding the phosphatidylserine decarboxylase enzyme that converts phosphatidylserine to phosphatidylethanolamine (PE) in the inner mitochondrial membrane (IMM). Decreased conversion of phosphatidylserine to PE in patient fibroblasts is consistent with impaired phosphatidylserine decarboxylase (PISD) enzyme activity. Meanwhile, as evidence for mitochondrial dysfunction, patient fibroblasts exhibited more fragmented mitochondrial networks, enlarged lysosomes, decreased maximal oxygen consumption rates, and increased sensitivity to 2-deoxyglucose. Moreover, treatment with lyso-PE, which can replenish the mitochondrial pool of PE, and genetic complementation restored mitochondrial and lysosome morphology in patient fibroblasts. Functional characterization of the PISD variants demonstrates that the maternal variant causes an alternative splice product. Meanwhile, the paternal variant impairs autocatalytic self-processing of the PISD protein required for its activity. Finally, evidence for impaired activity of mitochondrial IMM proteases suggests an explanation as to why the phenotypes of these PISD patients resemble recently described "mitochondrial chaperonopathies." Collectively, these findings demonstrate that PISD is a novel mitochondrial disease gene.


Conflict of interest statement

The authors declare that they have no conflicts of interest.

Figures

Figure 1.
Figure 1.. Clinical and genetic patient data.
(A) Pedigree of the patient family along with pictures of the two siblings in infancy and in adulthood. Note strabismus, midface hypoplasia, and depressed nasal ridge. (B) Cranial MRI scans of the two sisters. Panes (i) and (iii) are individual II-1 at 22 y of age. Panes (ii) and (iv) are individual II- 2 at 25 y of age. Panes (i) and (ii) are axial T2-weighted images lacking the normal T2 hypointense signal, demonstrating hypomyelination. Panes (iii) and (iv) are sagittal MRI scans that revealed generalized hypomyelination of the corpus callosum. (C) Electropherogram conformation of the identified variants using Sanger sequencing, with mutated residues boxed. (D) Sequence alignment of PISD homologs from the indicated species showing region containing the R277Q variant, with the arginine 277 residue highlighted in purple. A conserved histidine residue essential for autocatalysis is highlighted in green and one of four missense variants in a yeast Psd1p temperature sensitive allele is highlighted in yellow (Birner et al, 2003; Choi et al, 2015; Ogunbona et al, 2017).
Figure 2.
Figure 2.. Characterization of PE synthesis and mitochondrial function in patient fibroblast cells.
(A) Patient fibroblasts have decreased ability to convert PS into PE. Control and patient fibroblasts were labelled with [3H] serine for 2, 4, and 6 h, after which total PE was isolated by thin-layer chromatography, and the incorporation rate of the [3H] label into PE was quantified. (B) Patient fibroblasts have decreased maximal respiration. Profiles of oxygen consumption rate (OCR) for control and patient fibroblast cells, measured using the Seahorse Extracellular Flux XF24 Analyzer. Each point on the plot represents the average of four technical replicates, and the experiment has been replicated independently three times. Error bars represent SD. (C–G) There are no differences between control and patient fibroblasts with regard to the expression of mitochondrial OxPhos complex subunits in Western blots with β-ACTIN as a load control (C) (shown is a representative blot, and the experiment has been repeated independently three times), changes in Complex IV activity measured using a Dipstick Assay Kit (D), relative mtDNA copy number measured by qPCR (E), membrane potential measured by TMRE (F), or mitochondrial mass measured by Mitotracker Green (G). For panels (D–G), graphs represent the average from three independent biological repeats, each performed with three technical replicates. Error bars represent SD, whereas P-values were determined by unpaired two-tailed t tests.
Figure 3.
Figure 3.. Mitochondrial fragmentation in PISD patient fibroblasts is rescued by supplementation with lyso-PE.
(A) Representative images of mitochondrial morphology under normal growth conditions, stained by immunofluorescence using a TOMM20 antibody (green), imaged with a Zeiss confocal microscope. Nuclei were stained with DAPI (blue). Bottom panels are a magnification of the white-boxed areas shown in the upper panel. Scale bars indicate 10 μm. (B) Quantification of mitochondrial morphology from cells in panel (A). (C) Representative images of mitochondrial morphology of cells treated with 2-deoxyglucose (20 mM) or lyso-PE (50 μM) for 48 h, as indicated. (D) Quantification of mitochondrial morphology of cells from in panel (C). For all statistical analysis, at least 50 cells from three technical replicates were quantified, the average percentage of the cell in each morphology category is plotted, and the experiment has been replicated independently three times. Error bars represent SD, and P-values were determined by unpaired two-tailed t tests compared with the number of fused cells in control.
Figure 4.
Figure 4.. Altered lysosomal morphology in PISD patient fibroblasts is rescued by supplementation with lyso-PE.
(A) Representative images of lysosomes stained by immunofluorescence (IF) against LAMP1 (gray) imaged with an Olympus SD-OSR confocal microscope. The cells were grown in either normal medium or medium supplemented with lyso-PE (50 μM) for 48 h, as indicated. Bottom panels are magnifications of the white-boxed areas in the upper panel. Scale bars indicate 10 μm. (B) Quantification of lysosomal morphology from three technical replicates, each counting at least 100 cells per condition, with the average percentage of cells with each morphology plotted. Error bars represent SD, and P-values were determined by unpaired two-tailed t tests compared with the number cells with enlarged lysosomes in control. Similar trends were replicated in three independent experiments.
Figure 5.
Figure 5.. Genetic complementation of PISD fibroblasts restores mitochondrial morphology in 2DG-treated cells.
(A) Representative image of a patient fibroblast transfected with PISD-FLAG showing mitochondrial localization of PISD and normal morphology for both mitochondria and lysosomes, imaged with an Olympus SD-OSR confocal microscope. Mitochondria, PISD-FLAG, and lysosomes were stained by IF against TOMM20 (green), FLAG (red), and LAMP1 (gray), respectively. Scale bars indicate 5 μm. Right panels are magnifications of the boxed area. (B) Quantification of mitochondrial morphology for control and PISD patient fibroblasts either untransfected, or expressing PISD-FLAG, following 2DG treatment for 48 h. (C) Quantification of lysosome morphology for control and PISD patient fibroblasts either untransfected, or expressing PISD-FLAG. For both mitochondrial and lysosome morphology quantification, images from three independent experiments of at least 50 cells per condition were quantified, with the average percentage of cells with each morphology plotted. Error bars represent SD, and P-values were determined by unpaired two-tailed t tests compared with the morphology of control fibroblasts.
Figure 6.
Figure 6.. Evidence for alternative splicing and nonsense mediated decay (NMD) of PISD mRNA in patient fibroblasts.
cDNA generated from control and patient fibroblasts was amplified by PCR across the region containing the splice sites in question. The cells were treated with cycloheximide (CHX) (10 μg/ml for 4 h) to block nonsense-mediated decay, as indicated. The 310-bp product corresponds to the normal splice product. The smaller ∼234-bp product corresponds to the predicted alternative splicing product, is visible in patient cDNA, and is more abundant following CHX treatment. Gene amplification of RPL13A was performed as a load control. Results were replicated in three independent experiments.
Figure S1.
Figure S1.. Evidence for alternative splicing.
(A) Melt curve plot from triplicate quantitative RT-PCR reactions spanning the predicted splice region shows two distinct peaks for RNA samples generated from control (red) or PISD patient (blue) fibroblasts. (B) Sequencing traces of PISD cDNA generated from blood. Low levels of an alternative sequence corresponding to the alternative splice product were detected in the affected daughter (II-2) and mother (I-2) (boxed in red). Base calls for the sequence of the alternative transcript are shown below the traces.
Figure 7.
Figure 7.. The R277Q variant disturbs autocatalytic proteolysis when modeled in yeast Psd1p.
(A) Schematic of the PISD and Psd1p constructs examined in this study, with numbering of variants indicated in red. A 3XFLAG tag was added to the C terminus of both constructs to enable detection of the α subunit following autocatalytic cleavage at the conserved LGST site necessary to generate the PISD proenzyme. (B) Relative PSD1 mRNA transcript levels were determined by two-step reverse transcription–quantitative PCR. The CT values were normalized to the nuclear housekeeping gene ACT1, and fold change expressed relative to WT which was set at 1 (n = 4, SEM). (C) The α (anti-FLAG mouse monoclonal) and β (anti-Psd1p rabbit antisera) subunits of Psd1p were analyzed by immunoblotting in cell extracts isolated from cultures grown at the indicated temperatures; Pic1p served as a loading control. α-β indicates Psd1p that has not undergone autocatalytic proteolysis. f2 and f3 mark proteolytic fragments generated from the non-processed Psd1p precursor. The migration of molecular mass markers in KiloDalton is indicated at the left. (D) Pre-cultures (30°C) of psd1Δpsd2Δ yeast, untransformed or transformed as indicated, were spotted onto synthetic complete dextrose plates with or without 2 mM ethanolamine and incubated at 30°C or 37°C for 3 d. Similar trends were replicated in three independent experiments. MTS, mitochondrial targeting signal; TM, transmembrane domain.
Figure 8.
Figure 8.. Impaired autocatalytic proteolysis of R277Q and C266Y pathogenic PISD variants.
Western blot analysis of PISD fragments in HEK cells overexpressing the indicated PISD constructs for 96 h. Wild-type PISD undergoes autocatalytic cleavage into 30-kD β-subunits and 12-kD α-subunits required to form an active PISD enzyme. The unprocessed 45-kD PISD protein is the predominant protein form for the PISD mutant constructs. Results were replicated in three independent experiments.
Figure S2.
Figure S2.. The R277Q PISD protein is not detected following 24 h of overexpression.
(A) Western blot analysis for PISD protein fragments in HEK cells overexpressing the indicated PISD constructs. Both the 30-kD α-subunit and 12-kD β-subunit are visible for the wild-type PISD, but no protein is visible for the R277Q mutant. (B) Relative expression of PISD mRNAs in HEK cells overexpressing the indicated PISD constructs demonstrates that mutant transcripts are still present 96 h following transfection. Error bars represent SD.
Figure 9.
Figure 9.. Altered mitochondrial protein homeostasis in PISD patient fibroblasts.
(A) Western blot analysis of various mitochondrial proteins in control and patient fibroblasts treated with 2-deoxyglucose (20 mM) and 50 μM lyso-PE for 48 h as indicated. VDAC was used as a marker for total mitochondrial signal, whereas β-ACTIN was used as a general load control. Open and solid triangles indicate unprocessed and processed forms, respectively. Decreased levels of OMA1, OPA1, MRPL32, and processed PGAM5 were observed in patient fibroblast cells, but rescued upon lyso-PE treatment. To obtain optimal separation of OPA1 bands, separate gels were run and blotted with HSP60 as a load control. (B) Protein extracts from HEK cells overexpressing wild-type or mutant PISD constructs (as in Fig 8) were analyzed by Western blot for the same proteins as in part (A). Overexpression of wild-type PISD leads to a dramatic decreased in OMA1 and MRPL32, which is blunted when mutant PISD proteins are overexpressed. Similar results were replicated in three independent experiments.
Figure S3.
Figure S3.. Relative mRNA quantification of OMA1, PGMA5, OPA1, and MRPL32 in control and patient fibroblasts, as well as in HEK cells overexpressing PISD.
(A) Relative mRNA levels of OMA1 and OPA1 were similar between control and patient fibroblast. Patient fibroblast mRNA levels of PGAM5 and MRPL32 decreased; however, these patterns were not correlating to the Western blot analysis. (B) Relative levels of OMA1, PGAM5, OPA1, and MRPL32 mRNA are similar across all treatments. Error bars represent SD.
Figure S4.
Figure S4.. Representative images for quantification of mitochondrial and lysosomal morphology.
(A) Mitochondrial morphology of cells was graded into three categories: (i) cells with a fused morphology have highly fused mitochondrial networks, (ii) cells with intermediate morphology have mostly elongated mitochondria and some networks, and (iii) cells with fragmented mitochondria contain primarily short mitochondria or punctate structures. Scale bars indicate 5 μm. (B) Lysosomal morphology of cells was graded into two categories: (i) cells with normal lysosome morphology have primarily small punctate lysosome, may contain some larger lysosome, but never form large sheets of connected lysosomes and (ii) cells with enlarged lysosomes contain lysosomes that primarily form into large connected sheets. Bottom panels are a magnification of the white-boxed areas shown in the upper panel. Scale bars indicate 5 μm. (C) Representative image of a control fibroblast cell expressing high levels of PISD-FLAG (red, anti-FLAG) with highly fragmented mitochondria (green, TOMM20) used to determine a cutoff threshold for overexpression effects and subsequent exclusion for quantifying morphology. Scale bars indicate 5 μm.

References

    1. Baile MG, Claypool SM (2013) The power of yeast to model diseases of the powerhouse of the cell. Front Biosci 18: 241–278. - PMC - PubMed
    1. Beaulieu CL, Majewski J, Schwartzentruber J, Samuels ME, Fernandez BA, Bernier FP, Brudno M, Knoppers B, Marcadier J, Dyment D, et al. (2014) FORGE Canada Consortium: Outcomes of a 2-year national rare-disease gene-discovery project. Am J Hum Genet 94: 809–817. 10.1016/j.ajhg.2014.05.003 - DOI - PMC - PubMed
    1. Birner R, Nebauer R, Schneiter R, Daum G (2003) Synthetic lethal interaction of the mitochondrial phosphatidylethanolamine biosynthetic machinery with the prohibitin complex of Saccharomyces cerevisiae. Mol Biol Cell 14: 370–383. 10.1091/mbc.e02-05-0263 - DOI - PMC - PubMed
    1. Calvo SE, Clauser KR, Mootha VK (2016) MitoCarta2.0: An updated inventory of mammalian mitochondrial proteins. Nucleic Acids Res 44: D1251–D1257. 10.1093/nar/gkv1003 - DOI - PMC - PubMed
    1. Choi JY, Duraisingh MT, Marti M, Ben Mamoun C, Voelker DR (2015) From protease to decarboxylase: The molecular metamorphosis of phosphatidylserine decarboxylase. J Biol Chem 290: 10972–10980. 10.1074/jbc.m115.642413 - DOI - PMC - PubMed

Publication types

MeSH terms