. 2019 Apr 26;294(17):6831-6842.
doi: 10.1074/jbc.RA118.006595. Epub 2019 Mar 11.

UVB-induced inactivation of manganese-containing superoxide dismutase promotes mitophagy via ROS-mediated mTORC2 pathway activation

Affiliations

UVB-induced inactivation of manganese-containing superoxide dismutase promotes mitophagy via ROS-mediated mTORC2 pathway activation

Sanjit K Dhar et al. J Biol Chem. .

Abstract

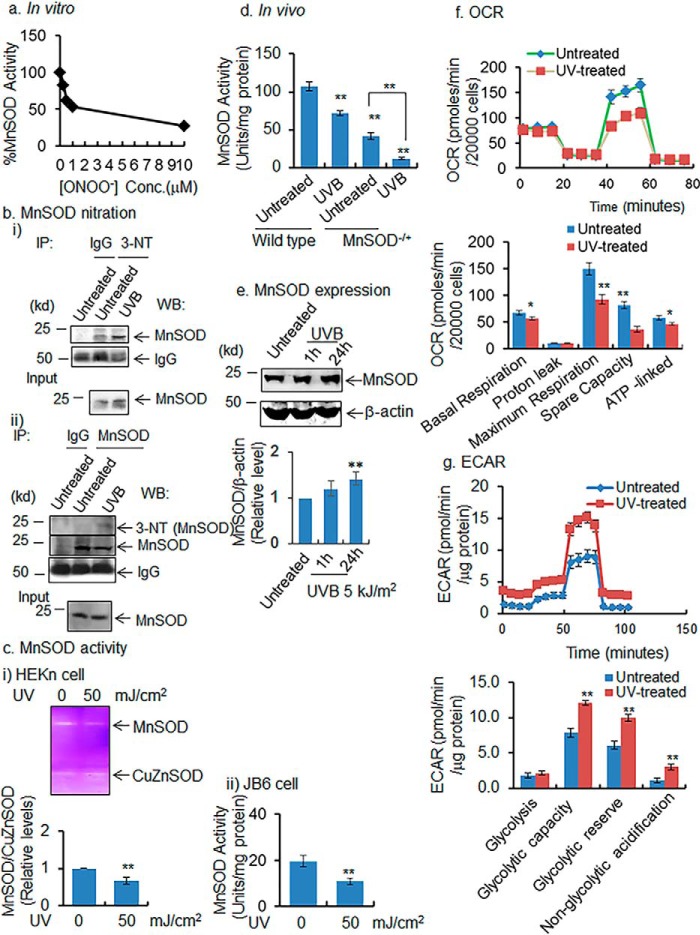
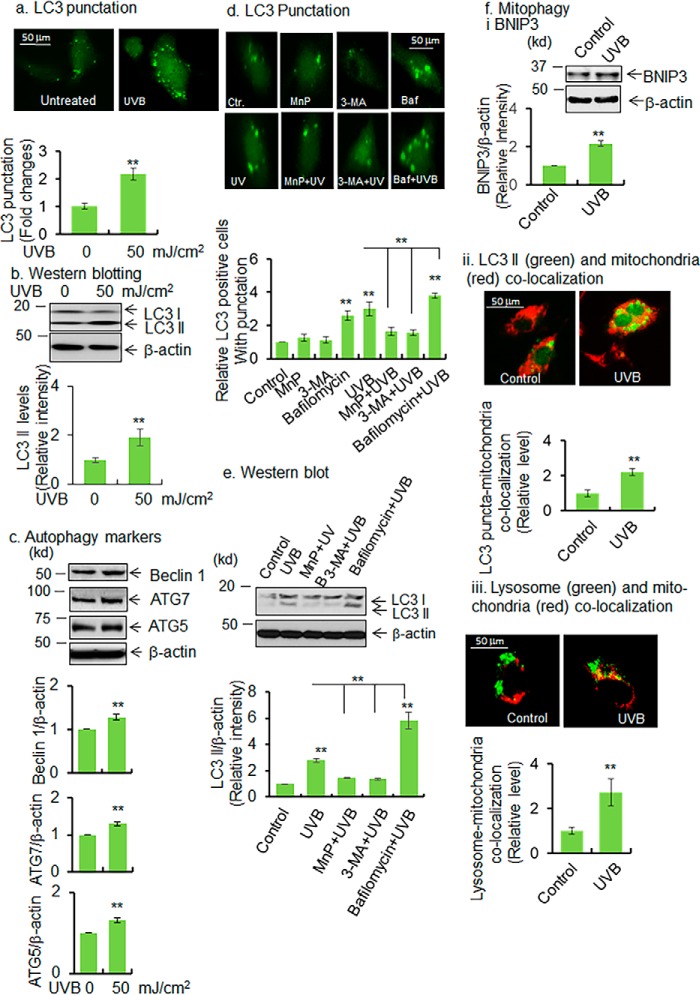
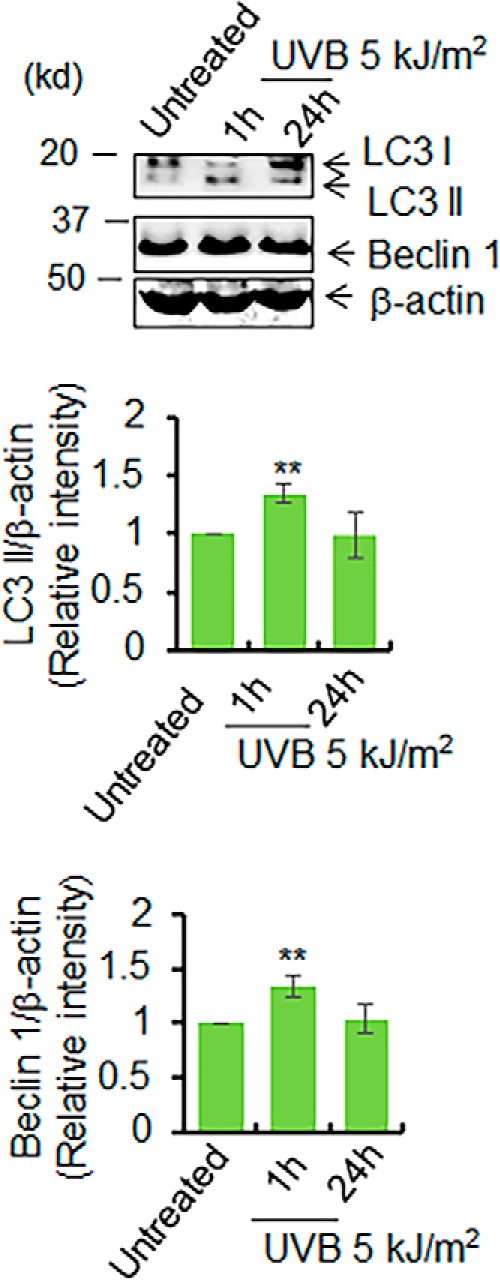
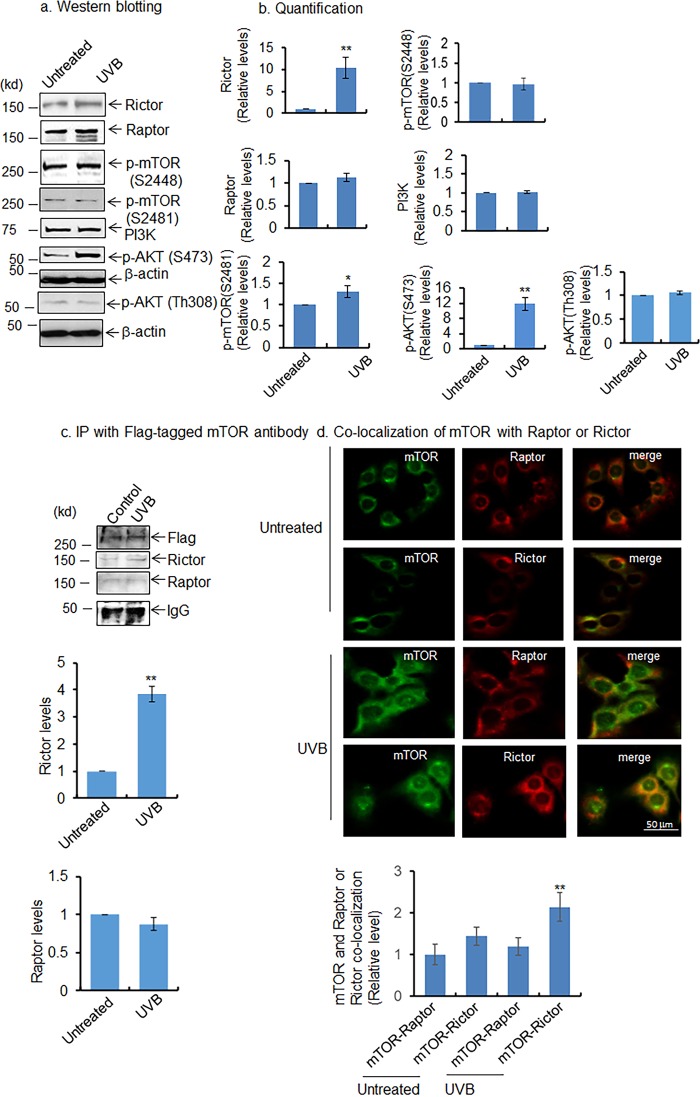
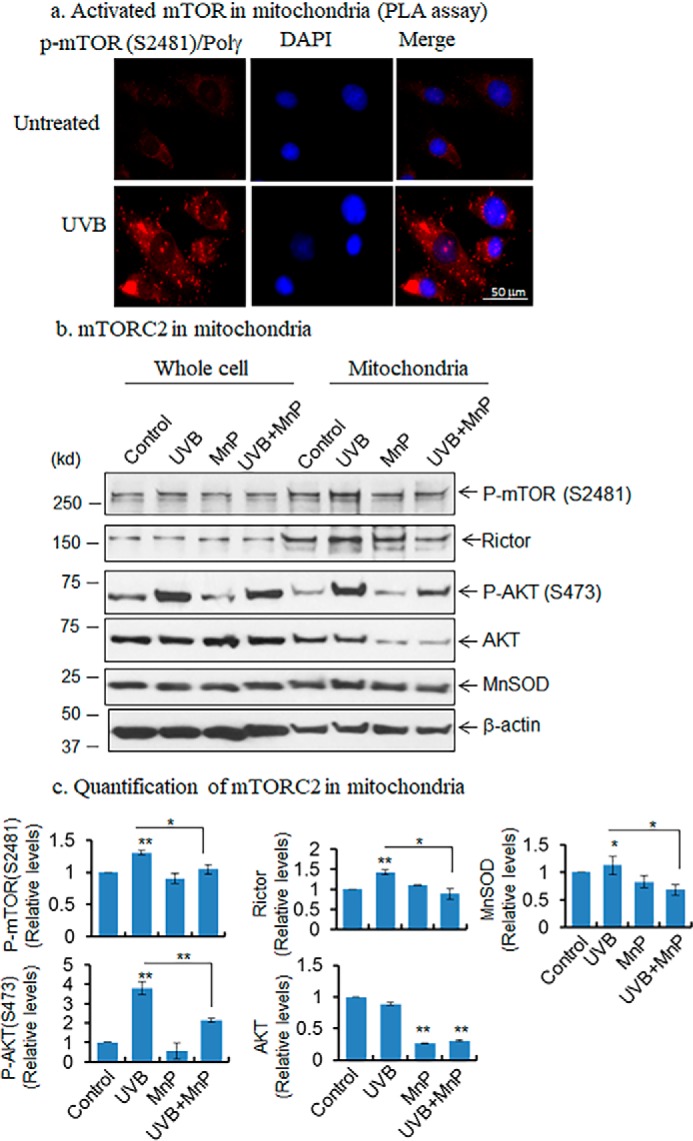
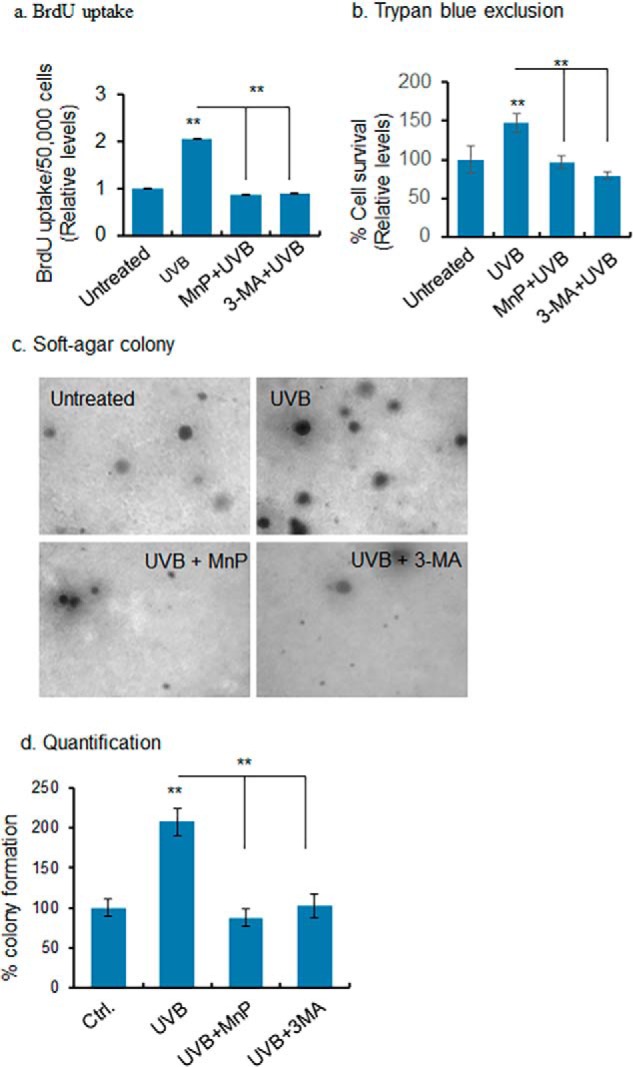
Mitochondria are major sites of energy metabolism that influence numerous cellular events, including immunity and cancer development. Previously, we reported that the mitochondrion-specific antioxidant enzyme, manganese-containing superoxide dismutase (MnSOD), has dual roles in early- and late-carcinogenesis stages. However, how defective MnSOD impacts the chain of events that lead to cell transformation in pathologically normal epidermal cells that have been exposed to carcinogens is unknown. Here, we show that UVB radiation causes nitration and inactivation of MnSOD leading to mitochondrial injury and mitophagy. In keratinocytes, exposure to UVB radiation decreased mitochondrial oxidative phosphorylation, increased glycolysis and the expression of autophagy-related genes, and enhanced AKT Ser/Thr kinase (AKT) phosphorylation and cell growth. Interestingly, UVB initiated a prosurvival mitophagy response by mitochondria-mediated reactive oxygen species (ROS) signaling via the mammalian target of the mTOR complex 2 (mTORC2) pathway. Knockdown of rictor but not raptor abrogated UVB-induced mitophagy responses. Furthermore, fractionation and proximity-ligation assays reveal that ROS-mediated mTOC2 activation in mitochondria is necessary for UVB-induced mitophagy. Importantly, pretreatment with the MnSOD mimic MnTnBuOE-2-PyP5+ (MnP) attenuates mTORC2 activation and suppresses UVB-induced mitophagy. UVB radiation exposure also increased cell growth as assessed by soft-agar colony survival and cell growth assays, and pretreatment with MnP or the known autophagy inhibitor 3-methyladenine abrogated UVB-induced cell growth. These results indicate that MnSOD is a major redox regulator that maintains mitochondrial health and show that UVB-mediated MnSOD inactivation promotes mitophagy and thereby prevents accumulation of damaged mitochondria.

Keywords: MnSOD; autophagy; cancer; mTOR; mTOR complex 2 (mTOR C2); metabolism; mitophagy; oxidative stress; reactive oxygen species (ROS); rictor.


Conflict of interest statement

The authors declare that they have no conflicts of interest with the contents of this article

Figures

Figure 1.
Figure 1.
MnSOD nitration, activity, and mitochondrial function. a, purified MnSOD protein was incubated with peroxynitrite at various concentrations, and MnSOD activity was determined by activity gel analysis. b, panel i, nitrated MnSOD detected in UVB-treated primary HEKn cells by immunoprecipitation (IP) with 3-nitrotyrosine antibody followed by Western blotting with MnSOD antibody. Panel ii, reverse immunoprecipitation was performed using MnSOD antibody, and the nitrated MnSOD was detected by 3-nitrotyrosine antibody. c, MnSOD activity in HEKn cells in panel i and JB6 cells in panel ii using activity gel and spectrophotometry assays, respectively. d, MnSOD enzyme activity in mouse skin tissues following UVB treatment. e, MnSOD protein level estimated by Western blotting in mouse skin tissues after UVB treatment (5 kJ/m2). f, mitochondrial oxygen consumption was measured as described under “Experimental procedures.” g, glycolysis was measured as described under “Experimental procedures.” In all bar graphs and line graphs, each data point represents the mean ± S.D. of three to four individual samples. Each experiment was repeated at least three times, and statistical analysis was performed using t tests for two groups or one one-way ANOVA analysis followed by Bonferroni's post-test for multiple-group comparisons. Statistical significance is indicated by asterisks: *, p ≤ 0.05, and **, p ≤ 0.01.
Figure 2.
Figure 2.
UVB induces autophagy/mitophagy. a, JB6 cells were transfected with LC3 expression vector using Lipofectamine transfection protocol. LC3 punctation was detected in UVB-treated cells by a fluorescence microscope. For quantification of autophagic response, 100 GFP-positive cells were counted and compared with control, and the data are presented as fold changes. b and c, Western blot analysis was performed to detect LC3 II, beclin 1, ATG7, and ATG5 proteins in UVB-treated cells and compared with control. Bar graph shows the relative levels of each protein upon UVB treatment compared with control. d, autophagy flux was determined by detecting the puncta formation with or without autophagy inhibitors. The bar graph shows the quantification of punctated cells (100 GFP-positive cells were counted for each cell type). e, autophagy flux was also detected by Western blotting in UVB-treated cells following treatment of autophagy inhibitors (MnP, MnTnBuOE-2-PyP5+, 3-MA, and bafilomycin). The bar graph shows the quantification of LC3 II band intensity normalized to β-actin. f, panel i, BNIP3 proteins are detected by Western blotting in UVB-treated JB6 cells as a marker of mitophagy. The bar graph shows the quantification of BNIP3 band intensity normalized with β-actin. Panel ii, increase of mitophagy was observed by detecting the autophagosome (LC3 II) and mitochondria co-localization. One hundred LC3-positive cells were selected, and the number of LC3 puncta was selected, followed by counting the number of co-localized LC3 puncta with mitochondria. The mitochondria and LC3 puncta were identified and arbitrarily gated. The co-localized area is counted as LC3 and mitochondria co-localization. The mitochondria–LC3 co-localized puncta was normalized with the total number of puncta in each cell. Bar graph shows the relative number of LC3–puncta–mitochondrial co-localization in UVB-treated cells compared with control. Panel iii, mitophagy was also monitored by observing mitochondria–lysosome co-localization. Live cells were stained with MitoTracker Red and LysoTracker Green for mitochondria and lysosomes, respectively; the co-localized mitochondria and lysosomes were estimated by counting the number of arbitrarily selected co-localized areas, panel ii. Each experiment was repeated at least three times, and statistical analysis was performed using t tests for two groups or one-way ANOVA followed by Bonferroni's post-test analysis for multiple-group comparisons. Statistical significance is indicated by asterisks: *, p ≤ 0.05, and **, p ≤ 0.01.
Figure 3.
Figure 3.
UVB induces autophagy in vivo. The levels of LC3 II formation and beclin 1 were examined in mouse skin tissue lysates after UVB treatment by Western blotting. The bar graph shows the quantification of the band intensity of LC3 II and beclin 1 after normalization with β-actin. Each experiment was repeated at least three times, and statistical analysis was performed using one-way ANOVA followed by Bonferroni's post-test analysis for multiple-group comparisons. Statistical significance is indicated by asterisks: *, p ≤ 0.05, and **, p ≤ 0.01.
Figure 4.
Figure 4.
Activation of AKT/mTORC2 pathway after UVB treatment. a, increased levels of mTOR phosphorylation at Ser-2481, AKT phosphorylation at Ser-473, AKT phosphorylation at Thr-308, and rictor were detected by Western blotting in JB6 cells after UVB treatment. b, quantification of protein band intensity by densitometric scanning; results are normalized with corresponding β-actin band intensity. c and d, co-localization of mTOR with raptor and rictor was detected by immunoprecipitation (IP) with mTOR antibody followed by Western blot analysis (c). Immunocytochemistry was performed using mTOR, raptor, or rictor antibody after UVB treatment. The bar graph represents the relative level of mTOR and raptor co-localization or mTOR and rictor co-localization. For quantification, 100 cells were randomly selected, and the density of the merged image was quantified by densitometric scaning using ImageJ software (d). Each experiment was repeated at least three times, and statistical analysis of the quantifications was performed using t test. Statistical significance is indicated by asterisks: *, p ≤ 0.05, and **, p ≤ 0.01.
Figure 5.
Figure 5.
Detection of mTOR in mitochondria. a, presence of activated mTOR in mitochondria was detected by proximity ligation assay using phosphorylated mTOR and DNA polymerase γ antibodies. Briefly, the cells were treated with UVB radiation, and after 1 h cells were fixed with 4% formalin, then treated with two specific antibodies with different origins, and then probed with Duo-linked (PLA kit) secondary antibody according to the manufacturer's instructions. b, presence of mTORC2 in mitochondria was detected in purified mitochondria. First, mitochondria were isolated using mitochondria purification kit and subjected to Western blotting to identify the mTOR component in purified mitochondrial fraction. c, increase in activated mTOR was detected in UVB-treated mitochondria compared with control. Pretreatment with MnP inhibits mTOR phosphorylation (Ser-2481), AKT phosphorylation (Ser-473), and rictor levels in mitochondria. Statistical significance is indicated by asterisks: *, p ≤ 0.05, and **, p ≤ 0.01.
Figure 6.
Figure 6.
Role of mTOR complex in autophagy. a, to demonstrate the role of a specific mTOR complex associated with UVB-induced autophagy, JB6 cells were overexpressed with a combination of mTOR siRNA and raptor siRNA or mTOR siRNA and rictor siRNA to suppress mTORC1 and mTORC2 complexes, respectively. Suppression of mTOR and rictor attenuates LC3 II formation (lanes 2 and 5), but suppression of mTOR and raptor has no effect on LC3 II formation (lanes 3 and 6) with or without UVB treatment. b, effects of the suppression of mTOR complexes on autophagic marker LC3 II formation were quantified and are presented as a bar graph. c, activation of mTORC2 and autophagy/mitophagy was also determined in HEKn cells with both UVB treatment and by suppressing MnSOD levels using MnSOD siRNA. UVB and MnSOD siRNA both increase mTOR and AKT phosphorylation. UVB and MnSOD siRNA also enhance LC3 II formation and BNIP3 expression. d, quantification of Western blotting data are presented as bar graphs. Each experiment was repeated at least three times, and statistical analysis was performed using one-way ANOVA followed by Bonferroni's post-test analysis for multiple-group comparisons. Statistical significance is indicated by asterisks: *, p ≤ 0.05, and **, p ≤ 0.01.
Figure 7.
Figure 7.
Autophagy-dependent UVB-induced cell proliferation. a, BrdU uptake was determined as a measure of cell growth in UVB-treated cells with or without ROS or autophagy inhibitors. b, cell survival was assessed by counting the cells following UVB treatment using trypan blue exclusion assay. c, soft agar colony formation assay assessed cell growth after UVB treatment with or without ROS and autophagy inhibitor. For each treatment, 6–10 dishes were used, and microscopic images of transformed colonies were taken from six randomly selected fields in each dish (6–10 dishes/group). A representative microscopic view is shown. d, number of transformed colonies was counted and presented as a bar graph. Each experiment was repeated at least three times, and statistical analysis was performed using one-way ANOVA followed by Bonferroni's post-test analysis for multiple-group comparisons. Statistical significance is indicated by asterisks: *, p ≤, 0.05 and **, p ≤ 0.01.

Similar articles

Cited by

References

    1. Gregory E. M., and Fridovich I. (1973) Oxygen toxicity and the superoxide dismutase. J. Bacteriol. 114, 1193–1197 - PMC - PubMed
    1. Aitken G. R., Henderson J. R., Chang S. C., McNeil C. J., and Birch-Machin M. A. (2007) Direct monitoring of UV-induced free radical generation in HaCaT keratinocytes. Clin. Exp. Dermatol. 32, 722–727 10.1111/j.1365-2230.2007.02474.x - DOI - PubMed
    1. Moldogazieva N. T., Lutsenko S. V., and Terentiev A. A. (2018) Reactive oxygen and nitrogen species-induced protein modifications: implication in carcinogenesis and anticancer therapy. Cancer Res. 78, 6040–6047 10.1158/0008-5472.CAN-18-0980 - DOI - PubMed
    1. Alvarez B., and Radi R. (2003) Peroxynitrite reactivity with amino acids and proteins. Amino Acids 25, 295–311 10.1007/s00726-003-0018-8 - DOI - PubMed
    1. Justilien V., Pang J.-J., Renganathan K., Zhan X., Crabb J. W., Kim S. R., Sparrow J. R., Hauswirth W. W., and Lewin A. S. (2007) SOD2 knockdown mouse model of early AMD. Invest. Ophthalmol. Vis. Sci. 48, 4407–4420 10.1167/iovs.07-0432 - DOI - PMC - PubMed

Publication types

MeSH terms

Substances

LinkOut - more resources